
Red Hat Training
A Red Hat training course is available for Red Hat JBoss Operations Network
3. Availability
One of the most basic elements for monitoring is knowing whether your server or application is running. Availability monitoring tells administrators that a certain process is running and minimally responsive.
3.1. Core "Up and Down" Monitoring
The first question with monitoring is is the resource running? A resource's availability is the first thing to check for overall performance, for determining service levels, and for maintaining infrastructure.
Availability (sometimes called up or down monitoring) determines whether a resource is up or whether it is in some other state.
Up means that the resource is running and that it responds to the agent within a prescribed time.
How availability is determined depends on the resource; it could be checking a process ID or a JVM or something else. Availability for a resource type is defined in its plug-in descriptor. Therefore, the plug-in container is the intermediary between the resource and the agent. The agent checks the plug-in container for resource availability; the container obtains it from the resource component.
Usually, an availability check takes a fraction of a second; for certain types of resources or in certain environments, it could take longer. There is a timeout period for availability scans, set to five (5) seconds by default. If a resource is running and responds to the availability scan within that five-second window, the resource is up.
Because availability — or "up and down" — monitoring is so critical to IT administrators, availability states in JBoss ON are highly visible. Availability is displayed on resource details pages, in every list of resources, in groups, and in monitoring reports. The idea is that it should only take a glance to be able to determine whether your resource is up.
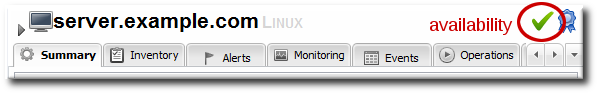
Figure 1. Resource Availability
Even though availability is not a true monitoring metric, the Monitoring > Graphs page even shows the percentage of time, within the display time period, that the resource has been in an up state. This is because availability (and concomitant uptime) impacts every other metric collected by the agent.
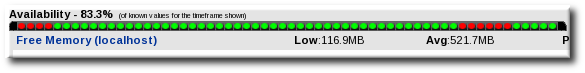
Figure 2. Availability Uptime Percentage
Note
Often, if a resource shows down availability even when it is running, it is a problem with the connection settings. The agent may not have information it requires, such as a username or new port number, that it requires to connect to the resource. Since the agent cannot connect to the resource, it assumes it is down.
3.1.1. Availability States
There is a gray area between up and not up. While a resource may not be up, it may be not up for different reasons. For instance, an agent could have been restarted, so no resource states are known. Or a resource may have been taken offline for maintenance, so no availability reports are being sent.
The different resource states are listed in Table 1, “Availability States”.
Table 1. Availability States
| State | Description | Icon |
|---|---|---|
| Available (UP) | The resource is running and responding to availability status checks. | |
| Down | The resource is not responding to availability checks. | |
| Unknown | The agent does not have a record of the resource's state. This could be because the resource has been newly added to the inventory and has not had its first availability check or because the agent is down. | |
| Disabled | The resource has been administratively marked as unavailable. The resource (in reality) could be running or stopped. Disabling a resource means that the server ignores the availability reports from the agent to prevent unnecessary alerts based on a (known) down or cycling state. | |
| Mixed (For groups only.)[a] | The resources in a group have different availability states. | |
[a]
A similar warning sign can be displayed next to the resource availability at the top of the resource details page. That warning indicates that an error message or suspect metric has been returned for that resource, not that the resource's availability is in a warning state.
| ||
3.1.2. Collection Intervals and Agent Scan Periods
As alluded to, an availability reading is not the same as a metric collection. There are some superficial similarities, mainly in that they both are collected on schedules and that they both relate to resource performance.
Internally, availability and metrics are treated differently. Availability is called through different functions and reported separately, and, more important, availability reports are prioritized higher than other reports sent by the agent, including monitoring reports.
While availability reports are sent as first priority messages, resources themselves have different priorities for availability scans. Higher priority (more critical) resources are, by default, checked for availability more frequently:
- An agent heartbeat ping (analogous to the platform's availability) is sent to the server every minute.
- Server availability is checked every minute.
- Service availability is checked every 10 minutes.
The agent itself runs an availability scan at 30-second intervals. Not every resource is checked with every scan. When the agent scan runs, only those resources scheduled to be checked are checked. So, there are functionally two availability schedules working together in tandem, the agent scan interval and the resource collection schedule. For example, if a server is configured with a 60-second interval for availability checks and the agent scan period is 30 seconds, the server is eligible to be checked every two scans. That means that the server is checked roughly every 60 seconds, but that is a best effort estimate; if the agent is under a heavy load or if there are a large number of resources, the agent may run its scans longer than every 30 seconds, so the actual interval between checks for a specific resource would be longer.
The agent only sends an availability report to the server if there is an availability state change for one of its managed resources.
If an agent goes down suddenly, it shows a down state within five minutes, the (default) agent quiet period. If the agent shuts down gracefully, the JBoss ON server recognizes the state change within about a minute. Once the server recognizes the agent is down, it begins backfilling the states of all of the resources in that agent's inventory (Section 3.1.4, “Parent-Child States and Backfilling”).
Down servers typically record a down state between one and two minutes after going down. This is not exactly real-time, but it is close enough for most infrastructure to be able to establish a reliable baseline of performance and even calculate service levels and uptime. A short window of 90 seconds can catch most resource cycling.
The default agent scan interval is 30 seconds, but, depending on a resource schedule, it could be over 10 minutes before some services are detected as down. If an administrator suspects that there has been a state change, it is possible to force an immediate availability scan for all resources for the agent through the interactive agent prompt:
> avail -- force
Using simply the
avail command runs the check for the next scheduled resources, not all resources.
Additionally, resource plug-ins can be written so that any operation which could cause a state change (such as start, stop, and restart operations) automatically requests an availability check for the resource when the operation ends.
3.1.3. Long Scan Times and Async Availability Collection
Availability scans are performed by a resource plug-in itself, for its defined resource types, and then reported to the plug-in container..
Availability checks are typically very fast, fractions of a second, but there can be situations where an availability check takes longer. The plug-in container limits how long an availability check can run to five seconds, to prevent a rogue plug-in from delaying availability reporting for all other resources managed by the agent.
There can be instances where a certain plug-in or resource type consistently has scans longer than the five-second timeout period.
For custom plug-ins, plug-in writers can configure asynchronous availability checking. Basically, with async availability checks, the resource component creates its own, independent thread to run availability checks. Within that thread, the availability checks can take as long as they need to complete. The availability checks can also be run fairly frequently, every minute by default, to make sure that the availability state is current, even if the full check takes longer to complete.
The component caches and then reports the most recent availability result to the plug-in container. That stored last availability can be delivered very quickly, in the fractions of a second that the plug-in container expects.
Async availability checks are implemented through the
AvailabilityCollectorRunnable class in the JBoss ON plug-in API. Details for this class are available in the plug-in API and Writing Custom Plug-ins.
Note
It is also possible to address long availability check times by extending the scan timeout period in the agent configuration itself. For example, add a new timeout period to the
ADDITIONAL_JAVA_OPTIONS parameters in the rhq-agent-env.sh file:
RHQ_AGENT_ADDITIONAL_JAVA_OPTS="-Drhq.agent.plugins.availability-scan.timeout=15000"
However, that timeout period applies to the entire plug-in container, not just one specific, slow-running plug-in. If there are several plug-ins that are running sluggish availability checks, then the availability report may take too long to complete, causing the agent to delay or even miss sending availability reports to the JBoss ON server.
Generally, it is preferable to configure async availability on a custom plug-in, rather than trying to reset the scan interval for all plug-ins.
3.1.4. Parent-Child States and Backfilling
Availability is assessed from the top of the resource tree downward. For example, if an application server is down, it is safe to assume that all of its dependent webapp children are also down.
This is called backfilling. The parent's state is propagated to its children without running additional availability scans for each child. Backfilling can set children to down, unknown, or disabled states.
In some cases, backfilling even includes up states. Some dependent child resources (low priority services that only run if the parent is running) may not even have their own availability assessed independently by default. When a child's availability checking is disabled, the child presumptively uses its parent's state. If the parent is up, those children are assumed to be up.
There is one slight variation on backfilling — if a platform is marked as down. A platform being down is the same as the agent being down. It means that the agent has not reported to the server. There could be a number of reasons for that, apart from any servers or services actually being offline. In this case, the platform (functionally, the agent) is set to down, but its children are set to unknown.
3.2. Viewing a Resource's Availability Charts
- Click the Inventory tab in the top menu.
- Select the resource category, such as servers or services, in the Resources menu table on the left. Then browse or search for the resource.

- Click the name of the resource in the list.
- Open the resource's Monitoring tab.
- Click the Availability subtab.
The Availability chart for a resource shows when, and for how long, a resource changes states. This includes timestamps of whenever the availability changes and total counts of how much time the resource spends in the up and down states.
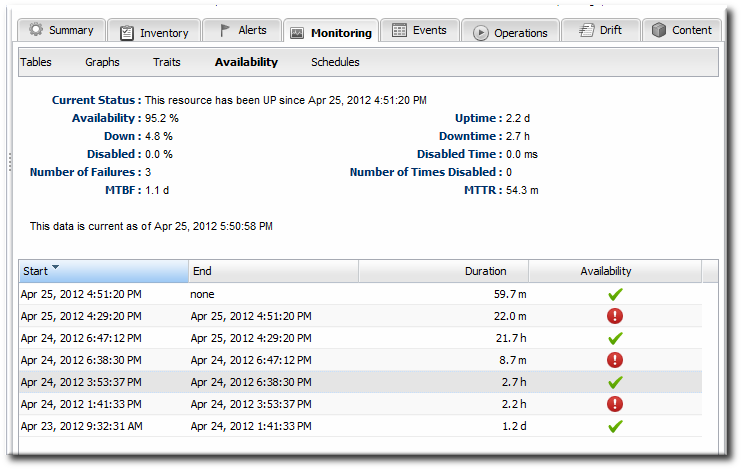
Figure 3. Availability Charts
3.3. Detailed Discussion: Availability Duration and Performance
Availability as a monitoring mechanism has two important facets: the immediate effect of when it changes and then the historic perspective on how changes in availability reflect resource performance.
An historic perspective introduces the idea of availability duration. How long was a resource in a particular state? How often does it change?
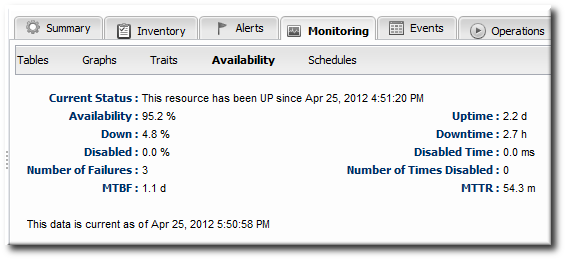
Figure 4. Availability Counts
The idea of availability duration is important to get an accurate picture of how a resource is performing. There are several ways that JBoss ON breaks out that information:
- Total time in up, down, and disabled states
- Percentage of time time in up, down, and disabled states
- The number of times the resource has been in a down or disabled state
- The mean time between failures (MTBF) and mean time to recovery (MTTR)
Note
Unknown states are not included in calculating the resource's overall availability history.
The last element is particularly important in assessing the resource's performance in light of its availability. The mean time between failures is the time between when a resource comes up and when it next goes down — it is the mean[1] of all of its up periods. This gives an idea of how stable a system is. The mean time to recovery gives an idea of how long the resource stays down, which indicates its resilience or fault tolerance. A low MTBF and high MTTR indicate some potential maintenance problems or application instability on a resource.
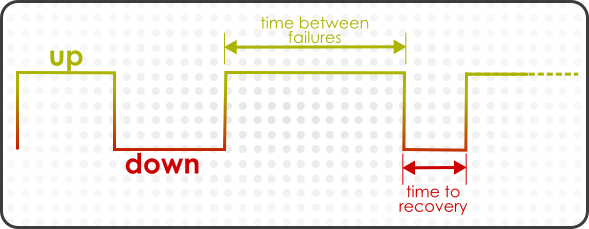
Figure 5. Up and Down Monitoring
From a monitoring perspective, the historic perspective is critical, particularly when planning equipment replacements and upgrades.
From an alerting perspective — from an immediate response perspective — only availability changes matter.
The first and most obvious alert condition issues an alert based solely on a state change.
However, resources can cycle or can have a few seconds or minutes where they are inaccessible but that doesn't affect the overall performance of the resource or of whatever function it performs. A resource hits a certain state and has to stay there for a certain amount of time before the state becomes important.

Figure 6. Availability Duration Alert
Note
An availability alert does not lend itself to dampening, because the state changes and then stays, such as an availability alert that fires when the resource changes to a down state. If a resource is cycling, it may go down and up several times, each time triggering a new alert, but it may all be related to the same performance issue on the resource.
Instead of dampening, a disable setting on the alert will fire the alert once, then disable that alert definition until it is acknowledged by an administrator, as described in Section 12.5, “Detailed Discussion: Automatically Disabling and Recovering Alerts”. (In this case, do not set a corresponding recover setting; otherwise, if the resource is cycling, every UP reading would reset the alert and then the next DOWN report would fire another notification — essentially undoing the dampening effect of disabling the alert until acknowledgment.)
3.4. Detailed Discussion: "Not Up" Alert Conditions
There are four possible availability states for a resource:
- Up
- Down
- Unknown
- Disabled
These are summarized in Section 3.1.1, “Availability States”.
Since one of the core monitoring factors for a resource is knowing its availability, alerts can be defined on any availability state change.
Generally, the condition can be set to send an alert on any explicit state. For example, a goes down condition alerts only when the availability state changes to DOWN. Any other state change is ignored.
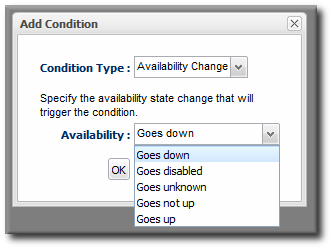
Figure 7. Availability Change Conditions
For critical platforms or resources, however, any change in availability other than UP may need to trigger an alert. Even known state changes like DISABLED.
The goes not up condition triggers an alert if there is a change to any availability state other than UP, so it is a logical OR combination of DOWN, UNKNOWN, and DISABLED conditions.
Note
Availability change conditions are well suited to using recovery alerts. When a resource goes down (or not up) an alert can fire that informs the administrators and then enables (or recovers) a companion alert that will inform them when the resource is available again.
See Section 12.5, “Detailed Discussion: Automatically Disabling and Recovering Alerts” for more information.
3.5. Viewing Group Availability
To view group availability:
- Click the Inventory tab in the top menu.
- Select the compatible or mixed groups item in the Groups menu on the left.
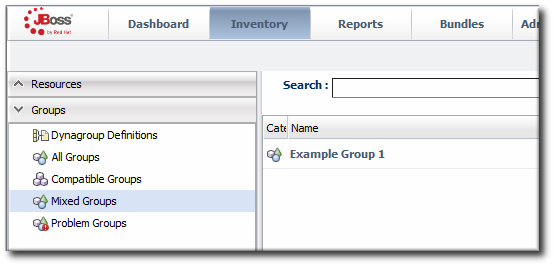
- Click the name of the group.
- Click the Inventory tab for the group.
Group availability is a composite of the states of its member resources. If all resources are in one state or another, the group as a whole is in that state. If the resources are in different states, then the group state is determined based on the mix of resource states.
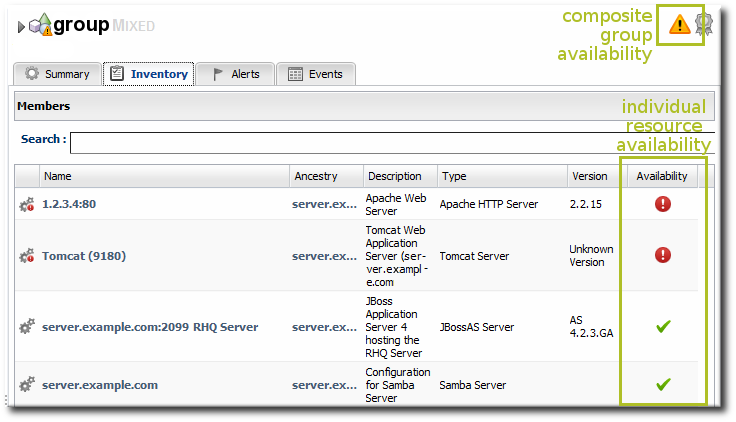
Figure 8. Group Availability
Note
Availability states are evaluated "top down." If a resource is down, disabled, or unknown, then all of its children are immediately assumed to be in that state, as well.
Table 2. Group Availability States
| If the Resource States Are .... | ... the Group State Is ... |
|---|---|
| Empty Group (Unknown) | Empty |
| All Red (Down) | Red (Down) |
| Some Down or Unknown | Yellow (Mixed) |
| Some Orange (Disabled) | Orange (Disabled) |
| All Green (Up) | Green (Up) |
3.6. Disabling Resources for Maintenance
Disabling a resource essentially removes it from the JBoss ON server's view. There can be a lot of reasons why a resource will be taken offline — a machine could be moved to a new colocation facility, the platform may be upgraded, or there could be hardware changes. When an IT administrator knows that a resource will be unavailable, there is no reason to have an availability check which could trigger white noise of unnecessary reports. The resource can be disabled, which signals to the JBoss ON server that the resource availability is down (or cycling) and should be ignored.
There are two things to remember when disabling a resource:
- If the agent is still up, then the resource availability is still reported. It is just ignored by the JBoss ON server, and is not included in any availability calculations.
- Disabling a parent resource automatically disables all of its children, too.
- Click the Inventory tab in the top menu.
- Select the resource category, such as servers or services, in the Resources menu table on the left. Then browse or search for the resource.
- Select the resource in the list.
- Click the button at the bottom of the page.
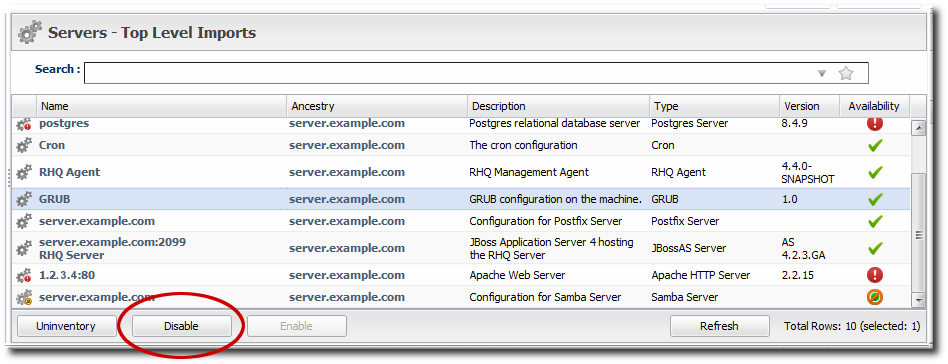
- When prompted, confirm that the resource should be disabled.
The disabled resource has an orange icon marking its state.
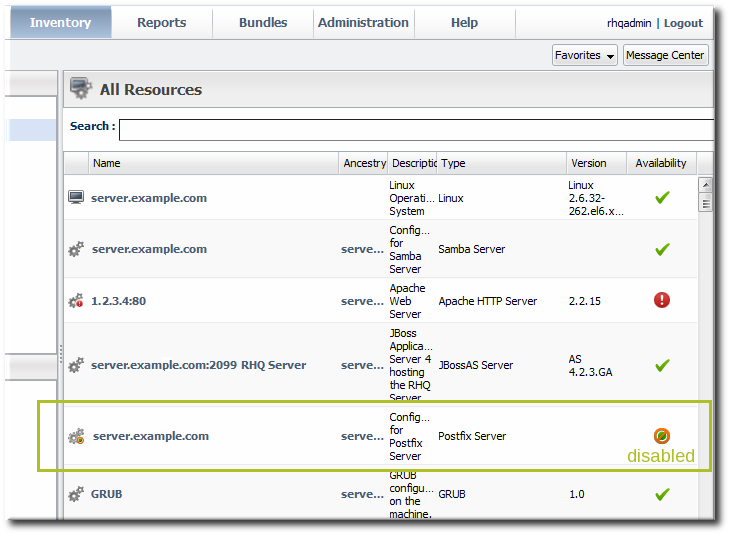
Figure 9. Disabled Resource
Note
When the resource is re-enabled, it has an unknown state until the next scheduled availability scan.
3.7. Allowing Plug-ins to Disable and Enable Resources Automatically
Some child or dependent resources may consistently use a disabled state to indicate that the resource is inactive. For example, a managed server in a JBoss EAP 6 domain or a web context under mod_cluster may be offline because it is inactive, and this should be treated differently than being explicitly down. In this case, the parent resource can start or stop the dependent child automatically; when not started, the child is off, but not down.
The resource plug-in itself can automatically disable and enable dependent resources by using the
AvailabilityContext.disable() and AvailabilityContext.enable() methods as part of its availability definition in its component JAR files.
Important
Be careful when allowing a resource plug-in to enable or disable a resource automatically. This potentially allows the plug-in to override whatever state the administrator has set.
For more information on writing resource plug-ins, see the Development: Writing Custom Plug-ins.
3.8. Changing the Availability Check Interval
While the availability check is not strictly a metric, it does have a collection schedule that can be edited with the other metric collection schedules.
- Click the Inventory tab in the top menu.
- Select the resource category, such as servers or services, in the Resources menu table on the left. Then browse or search for the resource.
- Click the Monitoring tab on the resource entry.
- Click the Schedules subtab.
- Select the availability metric, and enter the desired collection period in the Collection Interval field, with the appropriate time unit (seconds, minutes, or hours).

Note
Availability schedules can be set on compatible groups or resource type templates. Setting it at the group or resource type level changes multiple resources simultaneously. - Click Set.
3.9. Changing the Agent's Availability Scan Period
Since availability is processed on the server, large environments with hundreds of agents and tens of thousands of resources can stress the server and hurt performance. In that case, the default scan interval may be too short, and setting a longer scan interval may improve JBoss ON server performance.
Note
When changing core agent or server settings, especially ones that impact JBoss ON performance, contact Red Hat Support Services for assistance.
- Open the agent configuration file.
vim agentRoot/rhq-agent/conf/agent-configuration.xml
- Uncomment the lines in the XML file, and set the new scan time (in seconds).
<entry key="rhq.agent.plugins.availability-scan.period-secs" value="60"/>
- Restart the agent in the foreground of a terminal. Use the
--cleanconfigoption to force the agent to read the new configuration from the configuration file.agentRoot/rhq-agent/bin/rhq-agent.sh --cleanconfig
[1]
This is mean in the statistical sense. It is the middle data point of all collected uptime lengths.