
Red Hat Training
A Red Hat training course is available for Red Hat JBoss Operations Network
Setting up Monitoring, Alerts, and Operations
for monitoring resources and responding to incidents
Abstract
1. Document Information
1.1. Giving Feedback
- Select the JBoss products group.
- Select JBoss Operations Network from the list.
- Set the component to Documentation.
- Set the version number to 3.1.2.
- For errors, give the page number (for the PDF) or URL (for the HTML), and give a succinct description of the problem, such as incorrect procedure or typo.For enhancements, put in what information needs to be added and why.
- Give a clear title for the bug. For example,
"Incorrect command example for setup script options"is better than"Bad example".
1.2. Document History
| Revision History | ||||
|---|---|---|---|---|
| Revision 3.1.2-2.400 | 2013-10-31 | |||
| ||||
| Revision 3.1.2-2 | January 23, 2013 | |||
| ||||
| Revision 3.1.1-1 | September 19, 2012 | |||
| ||||
| Revision 3.1-0 | June 12, 2012 | |||
| ||||
2. Introduction: Monitoring and Responding to Resource Activity
2.1. Monitoring and Types of Data
- Availability or "up and down" monitoring
- This is both basic and critical. Availability is status information about the resource, whether it is running or stopped.
- Numeric metrics
- Metrics are the core performance data for a resource. Almost every software product exposes some sort of information about itself, some measurable facet that can be checked. This is usually This numeric information is collected by JBoss ON, on defined schedules.Metric information is processed by the server. There are three states of the monitoring data used:
- Raw data, which are the readings collected on schedule by the agent and sent to the server
- Aggregated data, which is compressed data processed by the server into 1-hour, 6-hour, and 24-hour averages and used to calculate baselines and normal operating ranges for resources. These aggregated data are the information displayed in the monitoring graphs and returned in the CLI as metrics.
- Live values, which are ad hoc requests for the current value of a metric.Metric values are rolling live-streams of the resource state; they are essentially snapshots that the agent takes of the readings on predefined schedules. Those data are then aggregated into means and averages to use to track resource performance.Live values are immediate, aggregated, current readings of a metric value.
Metric information is especially important because it is collected and stored long-term. This allows for historical views on resource performance, as well as recent views. - Logfile messages (events)
- While JBoss ON is not a log viewer, it can monitor specified logs and check for important log messages based on severity or strings within the log messages. This is event monitoring, and it allows JBoss ON to identify incidents for a resource and to send an alert notification and, if necessary, take corrective action based on dynamic information outside normal metrics.
- Response time metrics
- Certain types of resources (URLs for web servers or session beans) depend on responsiveness as a component of overall performance. Response time or call-time data tracks how quickly the URL or session bean responds to client requests and helps determine that the overall application is performant.
- Descriptive strings (traits)
- Most resources have some relatively static information that describe the resource itself, such as an instance name, build date, or version number. This information is a trait. As with other attributes for a resource, this can be monitored. Traits are useful to identify changes to the underlying application, like a version update.
2.2. Alerts and Responses to Changing Conditions
- Alerts communicate that there has been a problem, based on parameters defined by an administrator.
- Alerts respond to incidents automatically. Administrators can automatically initiate an operation, run a JBoss ON CLI script to change JBoss ON or resource configuration, redeploy content, or run a shell script, all in response to an alert condition.Automatic, administrator-defined responses to alerts make it significantly easier for administrators to address infrastructure problems quickly, and can mitigate the effect of outages.
2.3. Potential Impact on Server Performance
- Database performance, which is the primary factor in most environments
- Network bandwidth
- Up to 30,000 metrics can be collected per minute
- Up to 100,000 alerts can be fired per day (roughly 70 per minute)
2.4. Differences with Monitoring Based on Different Resource Types
3. Availability
3.1. Core "Up and Down" Monitoring
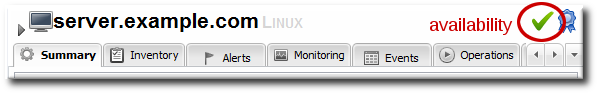
Figure 1. Resource Availability
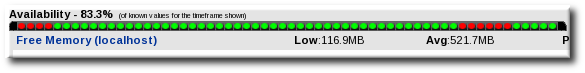
Figure 2. Availability Uptime Percentage
Note
3.1.1. Availability States
Table 1. Availability States
| State | Description | Icon |
|---|---|---|
| Available (UP) | The resource is running and responding to availability status checks. | |
| Down | The resource is not responding to availability checks. | |
| Unknown | The agent does not have a record of the resource's state. This could be because the resource has been newly added to the inventory and has not had its first availability check or because the agent is down. | |
| Disabled | The resource has been administratively marked as unavailable. The resource (in reality) could be running or stopped. Disabling a resource means that the server ignores the availability reports from the agent to prevent unnecessary alerts based on a (known) down or cycling state. | |
| Mixed (For groups only.)[a] | The resources in a group have different availability states. | |
[a]
A similar warning sign can be displayed next to the resource availability at the top of the resource details page. That warning indicates that an error message or suspect metric has been returned for that resource, not that the resource's availability is in a warning state.
| ||
3.1.2. Collection Intervals and Agent Scan Periods
- An agent heartbeat ping (analogous to the platform's availability) is sent to the server every minute.
- Server availability is checked every minute.
- Service availability is checked every 10 minutes.
> avail -- force
avail command runs the check for the next scheduled resources, not all resources.
3.1.3. Long Scan Times and Async Availability Collection
AvailabilityCollectorRunnable class in the JBoss ON plug-in API. Details for this class are available in the plug-in API and Writing Custom Plug-ins.
Note
ADDITIONAL_JAVA_OPTIONS parameters in the rhq-agent-env.sh file:
RHQ_AGENT_ADDITIONAL_JAVA_OPTS="-Drhq.agent.plugins.availability-scan.timeout=15000"
3.1.4. Parent-Child States and Backfilling
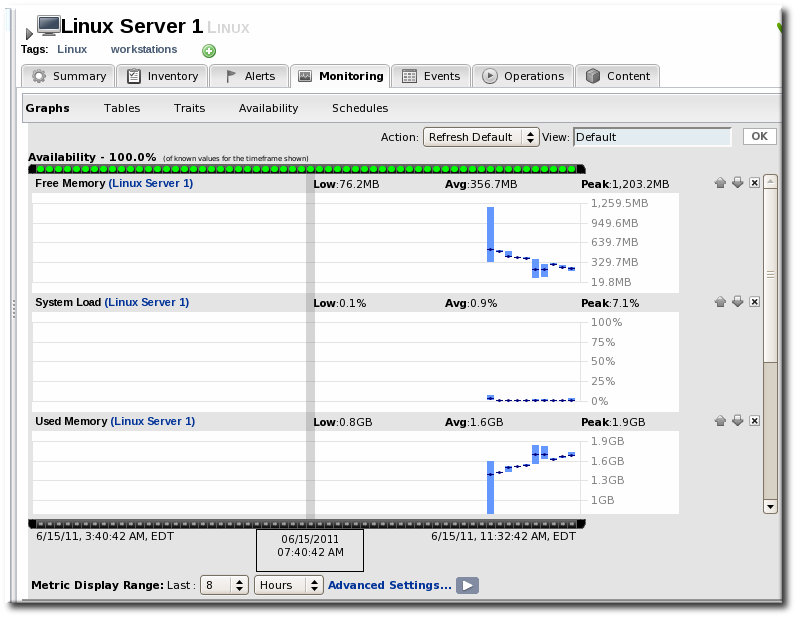
3.2. Viewing a Resource's Availability Charts
- Click the Inventory tab in the top menu.
- Select the resource category, such as servers or services, in the Resources menu table on the left. Then browse or search for the resource.

- Click the name of the resource in the list.
- Open the resource's Monitoring tab.
- Click the Availability subtab.
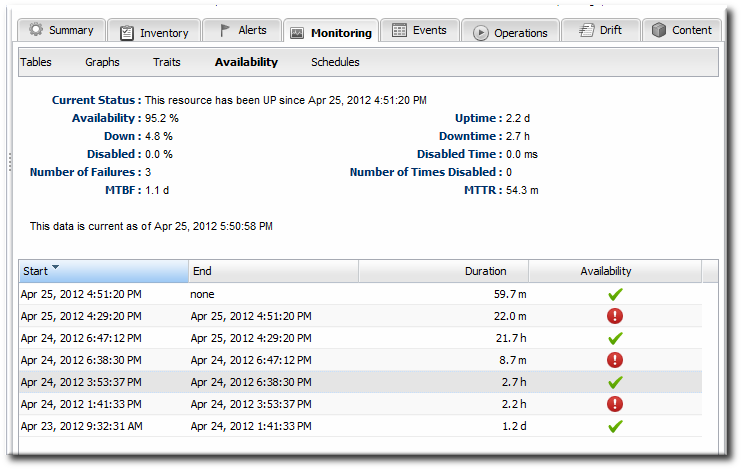
Figure 3. Availability Charts
3.3. Detailed Discussion: Availability Duration and Performance
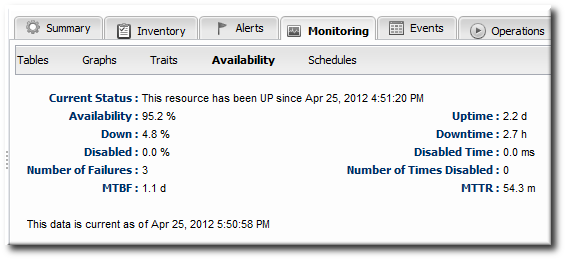
Figure 4. Availability Counts
- Total time in up, down, and disabled states
- Percentage of time time in up, down, and disabled states
- The number of times the resource has been in a down or disabled state
- The mean time between failures (MTBF) and mean time to recovery (MTTR)
Note
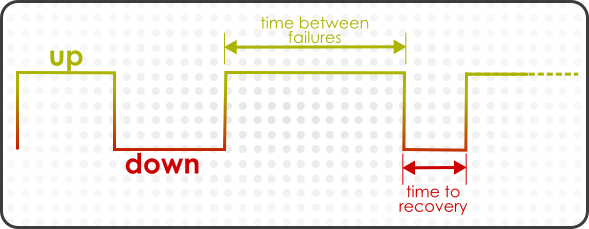
Figure 5. Up and Down Monitoring

Figure 6. Availability Duration Alert
Note
3.4. Detailed Discussion: "Not Up" Alert Conditions
- Up
- Down
- Unknown
- Disabled
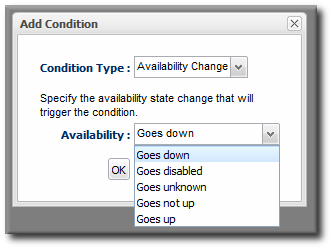
Figure 7. Availability Change Conditions
Note
3.5. Viewing Group Availability
- Click the Inventory tab in the top menu.
- Select the compatible or mixed groups item in the Groups menu on the left.
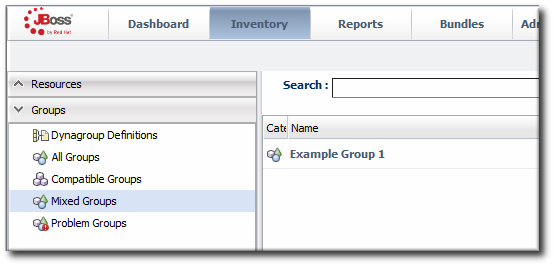
- Click the name of the group.
- Click the Inventory tab for the group.
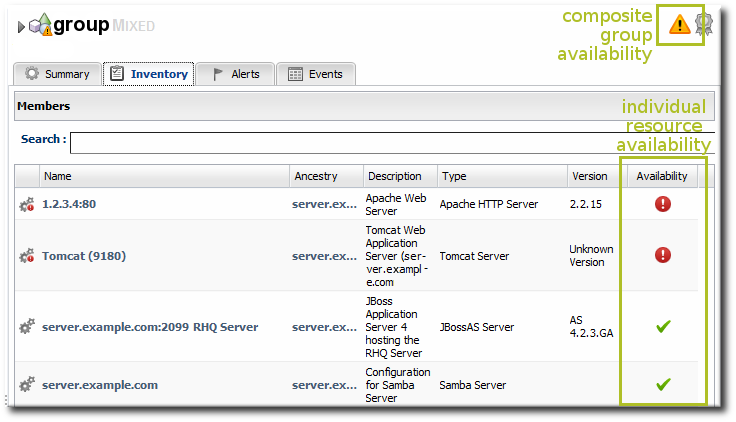
Figure 8. Group Availability
Note
Table 2. Group Availability States
| If the Resource States Are .... | ... the Group State Is ... |
|---|---|
| Empty Group (Unknown) | Empty |
| All Red (Down) | Red (Down) |
| Some Down or Unknown | Yellow (Mixed) |
| Some Orange (Disabled) | Orange (Disabled) |
| All Green (Up) | Green (Up) |
3.6. Disabling Resources for Maintenance
- If the agent is still up, then the resource availability is still reported. It is just ignored by the JBoss ON server, and is not included in any availability calculations.
- Disabling a parent resource automatically disables all of its children, too.
- Click the Inventory tab in the top menu.
- Select the resource category, such as servers or services, in the Resources menu table on the left. Then browse or search for the resource.
- Select the resource in the list.
- Click the button at the bottom of the page.
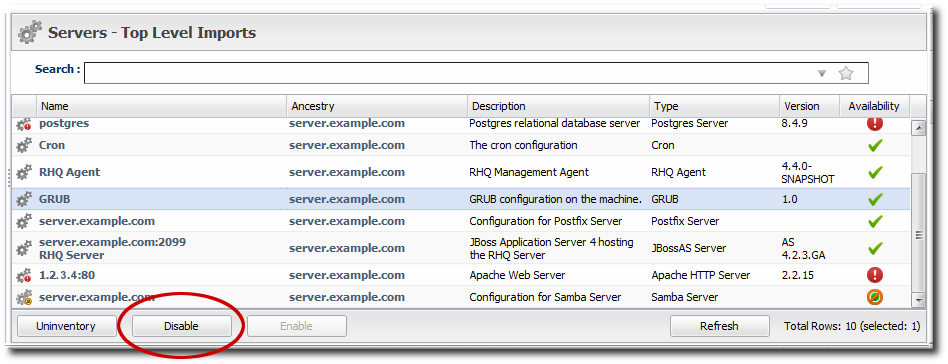
- When prompted, confirm that the resource should be disabled.
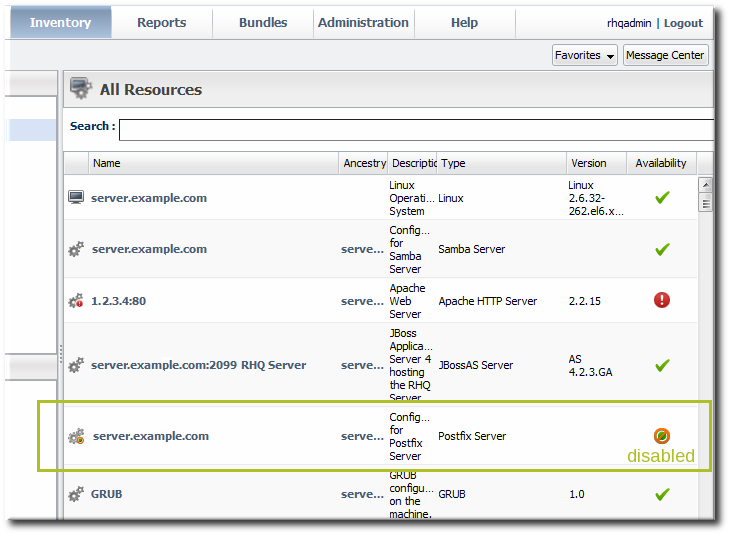
Figure 9. Disabled Resource
Note
3.7. Allowing Plug-ins to Disable and Enable Resources Automatically
AvailabilityContext.disable() and AvailabilityContext.enable() methods as part of its availability definition in its component JAR files.
Important
3.8. Changing the Availability Check Interval
- Click the Inventory tab in the top menu.
- Select the resource category, such as servers or services, in the Resources menu table on the left. Then browse or search for the resource.
- Click the Monitoring tab on the resource entry.
- Click the Schedules subtab.
- Select the availability metric, and enter the desired collection period in the Collection Interval field, with the appropriate time unit (seconds, minutes, or hours).

Note
Availability schedules can be set on compatible groups or resource type templates. Setting it at the group or resource type level changes multiple resources simultaneously. - Click Set.
3.9. Changing the Agent's Availability Scan Period
Note
- Open the agent configuration file.
vim agentRoot/rhq-agent/conf/agent-configuration.xml
- Uncomment the lines in the XML file, and set the new scan time (in seconds).
<entry key="rhq.agent.plugins.availability-scan.period-secs" value="60"/>
- Restart the agent in the foreground of a terminal. Use the
--cleanconfigoption to force the agent to read the new configuration from the configuration file.agentRoot/rhq-agent/bin/rhq-agent.sh --cleanconfig
4. Metrics and Measurements
4.1. Direct Information about Resources

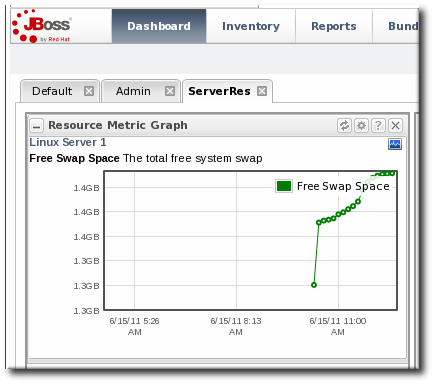
Figure 10. Metric Graph
4.1.1. Baselines and Out-of-Bounds Metrics
Note
Note

Figure 11. Out-of-Bound Factors
4.1.2. Collection Schedules
4.1.3. Metric Schedules and Resource Type Templates
4.1.4. Raw Metrics, Displayed Metrics, and Storing Data
4.2. Viewing Metrics and Baseline Charts
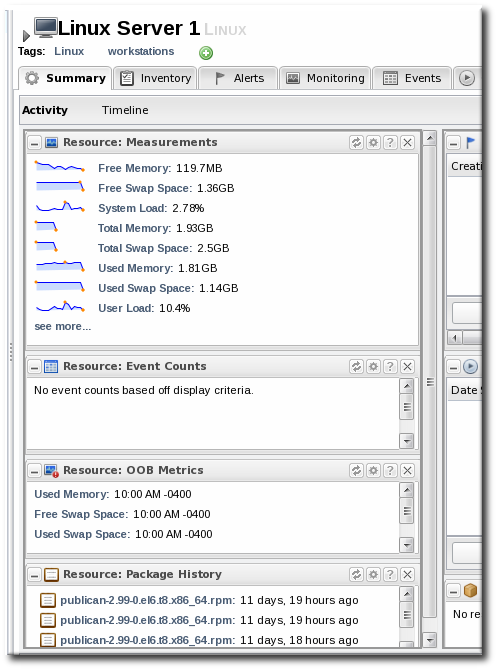
- The resource-level Summary
- Graphs
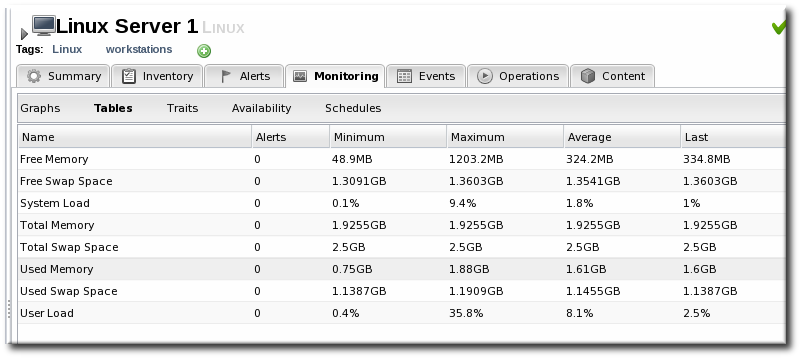
- Tables

4.3. Viewing Live Values
- Click the Inventory tab in the top menu.
- Select the resource category in the Resources menu table on the left, and then browse or search for the resource.
- Click the resource name.
- Open the Monitoring tab, and select the Tables subtab.
- Select the metric (or metrics, using Ctrl) in the list.
- Click the Get Live Values button at the bottom of the table.
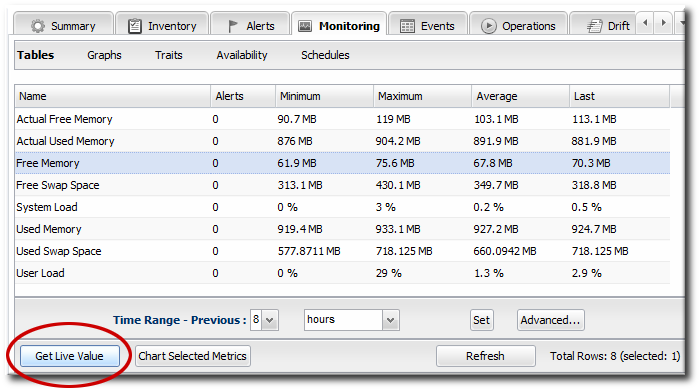
- The server displays the current (not aggregated) reading of the selected metrics.

4.4. Defining Baselines
4.4.1. Setting Baseline Calculation Properties
- In the System Configuration menu, select the item.

- Scroll to the Automatic Baseline Configuration Properties section.
- Change the settings to define the window used for calculation.
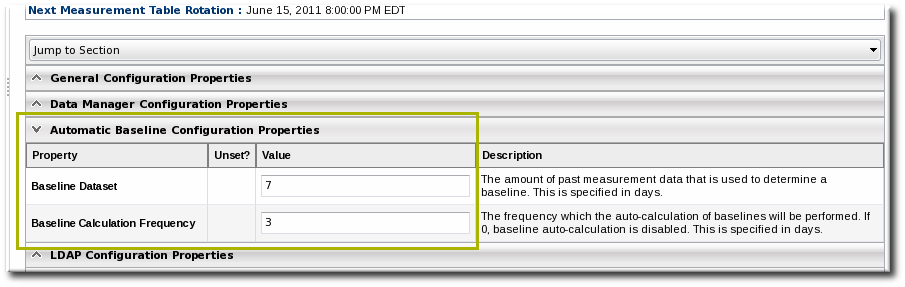
- Baseline Frequency sets the interval, in days, for how often baselines are recalculated. The default is three days.
- Baseline Dataset sets the time interval, in days, used to calculate the baseline. The default is seven days.
4.4.2. Recalculating Baseline Values
- Click the Inventory tab in the top menu.
- Select the resource type in the Resources menu table on the left, and then browse or search for the resource.
- In the summary tab, click the name of the metric to recalculate.
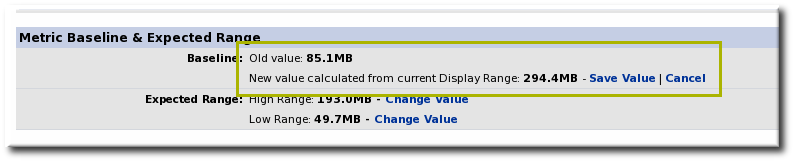
- Scroll to the bottom of the baseline chart, to the Metric Baseline & Expected Range area.
- Click the Change Value link next to the baseline figure.
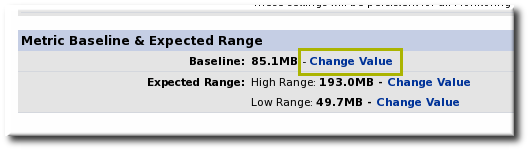
- A new baseline is calculated using the baseline dataset property from the configuration properties, starting from the current time. Accept the new baseline value by clicking Save Value.
4.5. Setting Collection Intervals for a Specific Resource
- Click the Inventory tab in the top menu.
- Select the resource category, such as servers or services, in the Resources menu table on the left. Then browse or search for the resource.
- Click the Monitoring tab on the resource entry.
- Click the Schedules subtab.
- Select the metric for which to change the monitoring frequency. Multiple metrics can be selected, if they will all be changed to the same frequency.

- Enter the desired collection period in the Collection Interval field, with the appropriate time unit (seconds, minutes, or hours).
- Click Set.
4.6. Enabling and Disabling Metrics for a Specific Resource
- Click the Inventory tab in the top menu.
- Select the resource type in the Resources menu table on the left, and then browse or search for the resource.
- Click the Monitoring tab on the resource entry.
- Click the Schedules sub tab.
- Select the metrics to enable or disable.
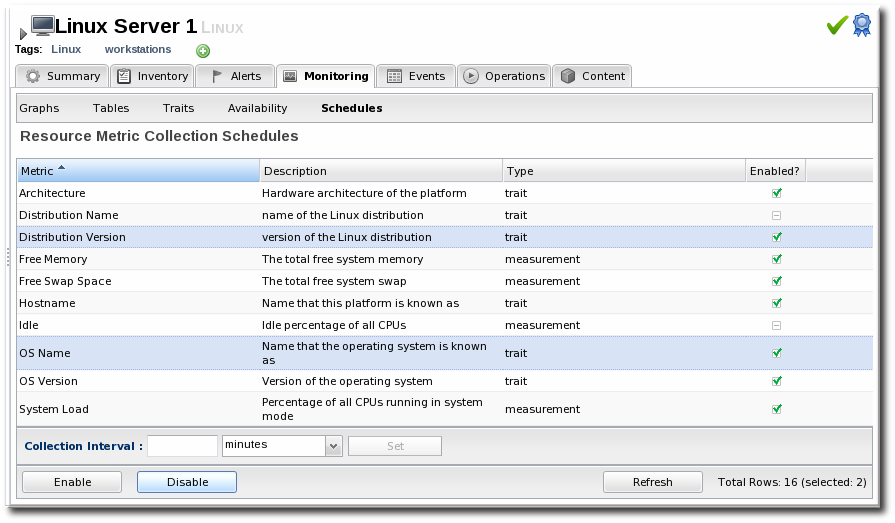
- Click the Enable or Disable button.
4.7. Changing Metrics Templates
Note
- In the top navigation, open the Administration menu, and then the System Configuration menu.
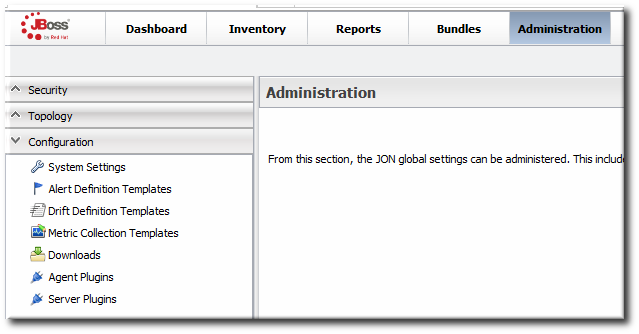
- Select the Metric Collection Templates menu item. This opens a long list of resource types, both for platforms and server types.
- Locate the type of resource for which to create the template definition.
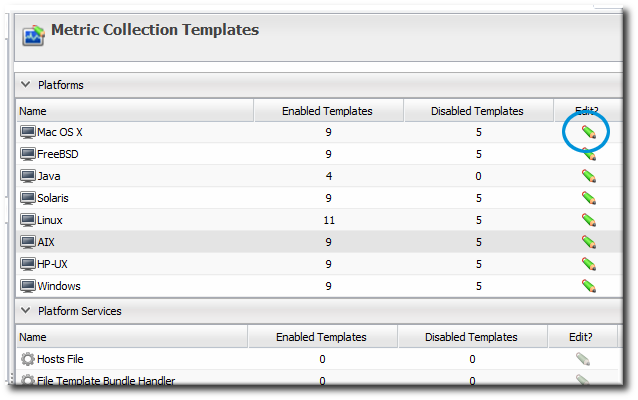
- Click the pencil icon to edit the metric collection schedule templates.
- Select the required metrics to enable or disable, and click the or button.
- To edit the frequency that a metric is collected, select the Update schedules for existing resources of marked type checkbox, and then enter the desired time frame into the Collection Interval for Selected: field.
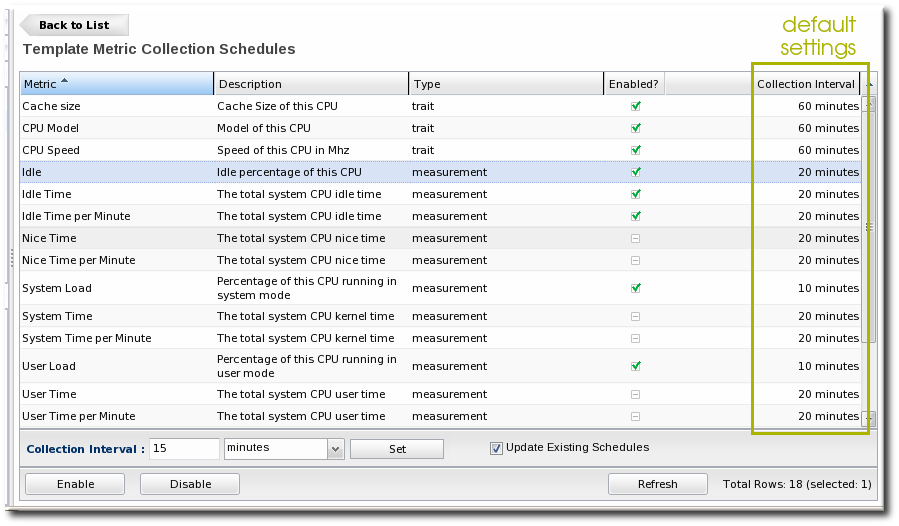
- Click the button.
4.8. Adding a PostgreSQL Query as a Metric
- metricColumn
- count(id)
SELECT 'metricColumn', count(id) FROM my_application_user WHERE is_logged_in = true
SELECT statement defines the metric for the JBoss ON agent. The rest of the query collects the data from the database. Simple as that.
- Click the Inventory tab in the top menu.
- Search for the PostgreSQL resource.
- Click the Inventory tab for the PostgreSQL database.
- Click the Import button in the bottom of the Inventory tab, and select Query.
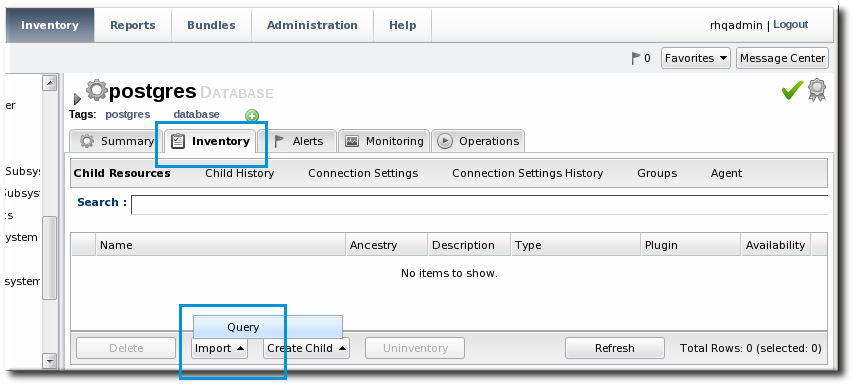
- Fill in the properties for the query metric. Three fields are particularly important:
- The Table gives which table within the database contains the data; this is whatever is in the
FROMstatement in the query. - The Metric Query contains the full query to run. The
SELECTstatement must be'metricColumn',count(id)to format the query properly for the JBoss ON agent to interpret it as a metric.SELECT 'metricColumn', count(id) FROM my_application_user WHERE is_logged_in = true
- The Name field is not important in configuring the metric, but it is important identifying the metric later.


Figure 12. Query: Total Logged-in User Count
5. Events
5.1. Events, Logs, and Resources
- Windows (Windows event logs)
- Apache server (log files)
- JBoss AS server (log files)
Note
5.2. Event Date Formatting
date severity [class] message
YYYY-mm-dd HH:mm:ss,SSS
HH:mm:ss,SSS
dd MM yyyy HH:mm:ss,SSS
date SEVERITY [org.foo.bar] my message
date [SEVERITY] [org.foo.bar] my message
date ( SEVERITY ) [org.foo.bar] my message
5.3. Defining a New Event
- Click the Inventory tab in the top menu.
- Select the resource type in the Resources menu table on the left, and then browse or search for the resource.
- Click the Inventory tab on the resource entry.
- Select the Connection Settings subtab.
- Click green plus icon under the Events Log section.

- Set the path to the log file, enable the event entry, and set the date format. Other properties about the log file, such as whether it is a file or listener and a message parser, can also be configured.

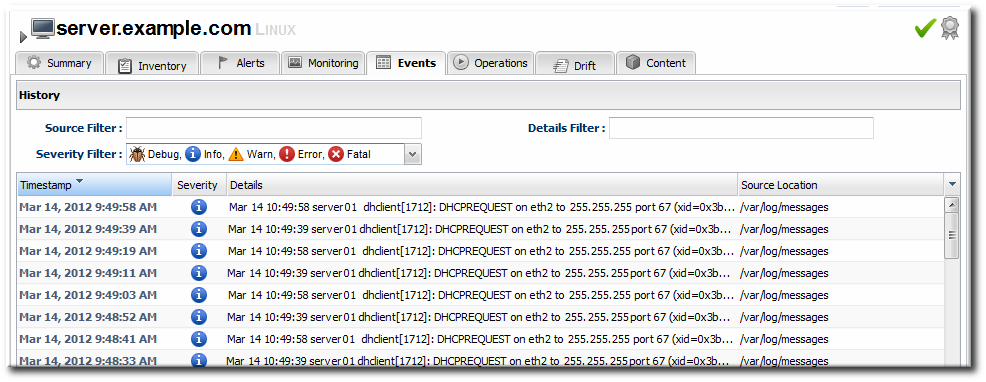
5.4. Viewing Events
- Click the Inventory tab in the top menu.
- Select the resource type in the Resources menu table on the left, and then browse or search for the resource.
- Click the Events tab on the resource entry. Events can be filtered by severity (debug, info, warn, error, and fatal).
- Click the specific event for further details.
5.5. Detailed Discussion: Event Correlation
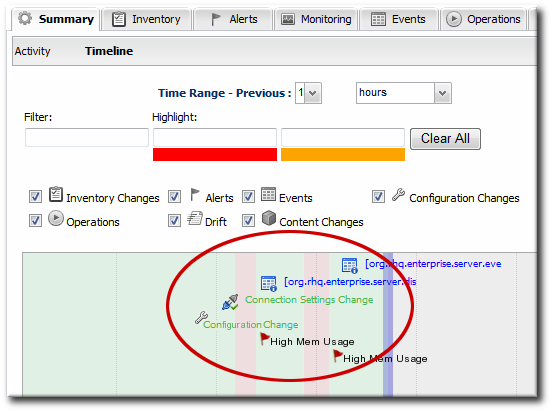
Figure 13. Resource Timeline Cluster
6. URL Response Time Monitoring
6.1. Call-Time (or Response Time) Monitoring for URLs
- Session beans, for EJB method calls.
- Web servers (standalone or embedded in an application server), for URL responses. Web servers require an additional response time filter with configuration on what URL resources to measure for response times.
6.2. Viewing Call Time Metrics
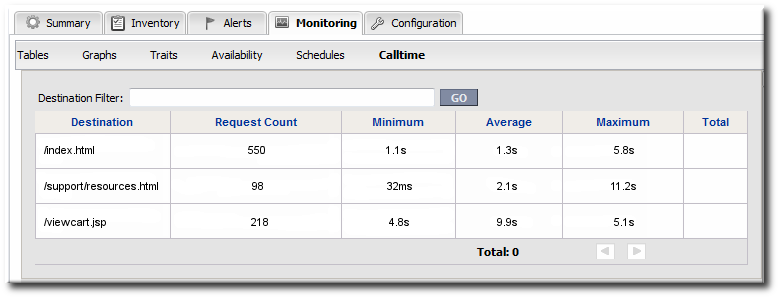
Figure 14. URL Metrics for a Web Server
6.3. Extended Example: Website Performance
A significant amount of Example Co.'s business, services, and support is tied to its website. Customers have to be able to access the site to purchase products, schedule training or consulting, and to receive most support and help. If the site is slow or if some resources are inaccessible, customers immediately have a negative experience.
Tim the IT Guy identifies three different ways that he can capture web application performance information:
- Response times for individual URLs
- Throughput information like total number of requests and responses
- Counts for critical HTTP response codes
- If there are poor response times and a high number of HTTP error 500 responses, then the alert can be configured with an operation to restart the web server (Section 13.2, “Detailed Discussion: Initiating an Operation”).
- If there are poor response times and a high number of HTTP error 404 response (meaning that resources may not be delivered properly), then the alert is configured to restart the database.
- If there are poor response times and a high number of total requests per minute, then it may mean that there is simply too much load on the server. The alert can be configured to create another web server instance to help with load balancing; using a JBoss ON CLI script allows the JBoss ON server to create new resources as necessary and deploy bundles of the appropriate web apps (Section 13.3, “Detailed Discussion: Initiating Resource Scripts”).
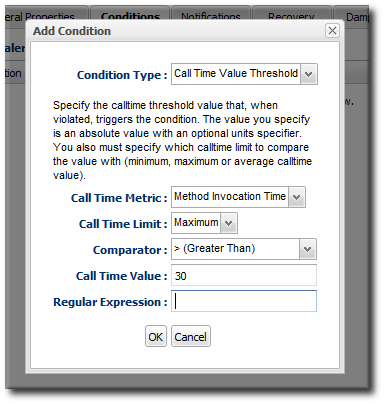
6.4. Configuring EJB Call-Time Metrics
- Click the Inventory tab in the top menu.
- Select the Services menu table on the left, and then navigate to the EJB resource.
Note
It is probably easier to search for the session bean by name, if you know it.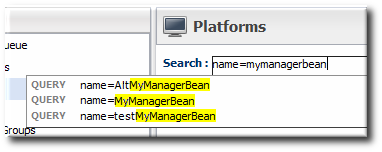
- Click the Monitoring tab on the EJB resource entry.
- Click the Schedules subtab.
- Select the Method Invocation Time metric. This metric is the calltime type.
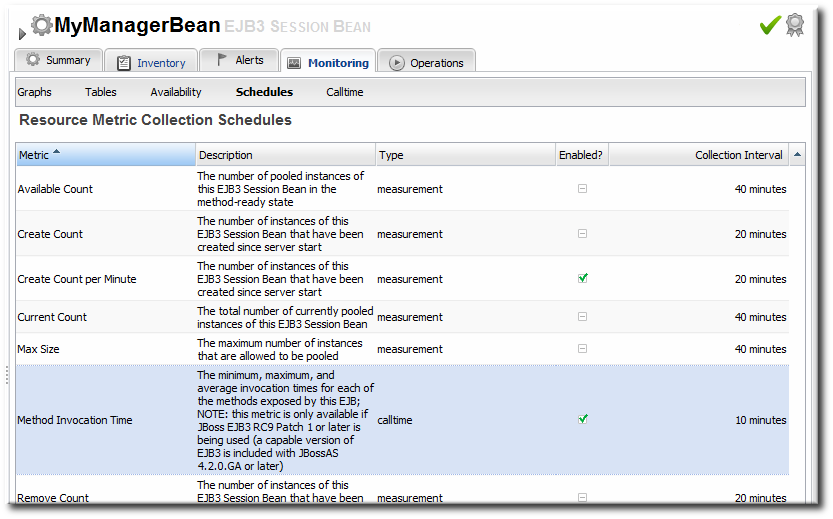
- Click the at the bottom of the list.
6.5. Configuring Response Time Metrics for JBoss EAP 6/AS 7
6.5.1. Installing the Response Time Filters
- Make sure that you have created a management user to access the JBoss EAP 6 instance.For more information, see the JBoss AS 7.1 documentation.
- Download the response rime packages for JBoss from the JBoss ON UI. The response time filters are packaged as AS 7 modules. There are two modules to obtain:
rhq-rtfilter-module.zip
rhq-rtfilter-subsystem-module.zip
Note
This can also be done from the command line usingwget:[root@server ~]# wget http://server.example.com:7080/downloads/connectors/rhq-rtfilter-module.zip [root@server ~]# wget http://server.example.com:7080/downloads/connectors/rhq-rtfilter-subsystem-module.zip
- Click the Administration tab in the top menu.
- In the Configuration menu box on the left, select the item.

- Click the rhq-rtfilter-module.zip and
rhq-rtfilter-subsystem-module.ziplinks, and save the files to an accessible directory, like the/tmpdirectory.
- Open the
modules/directory for the JBoss EAP 6 instance. For example:[root@server ~]# cd /opt/jboss-eap-6.0/modules/
- Unzip the
rhq-rtfilter-module.ziparchive to install the response time filter JAR and the associatedmodule.xmlfile.[root@server modules]# unzip /tmp/rhq-rtfilter-module.zip
- Open the configuration file for the server,
domain.xmlorstandalone.xml. - Deploy the response time module globally by adding the module to the list of global modules in the <subsystem> element.
<subsystem xmlns="urn:jboss:domain:ee:1.0"> <global-modules> <module name="org.rhq.helpers.rhq-rtfilter" slot="main"/> </global-modules> </subsystem> - Save the file.
- Unzip the
rhq-rtfilter-subsystem-module.ziparchive to install the subsystem response time filter JAR and the associatedmodule.xmlfile.[root@server modules]# unzip /tmp/rhq-rtfilter-subsystem-module.zip
This installs the filters as a subsystem for the application server or individual web apps. - After the filters have been installed, the JBoss EAP 6 server needs to be configured to use them.The response time filter can be deployed globally, for all web applications hosted by the EAP/AS instance, or it can be configured for a specific web application.To deploy the filter as a global subsystem:
- Open the configuration file for the server,
domain.xmlorstandalone.xml. - Add the an
<extensions>element for the response time filter.<extension module="org.rhq.helpers.rhq-rtfilter-subsystem"/>
- Add a
<subsystem>element beneath the<profileelement.All that is required for response time filtering to work is the default<subsystem>element, without any optional parameters. However, the parameters can be uncommented and set as necessary; the different ones are described in Table 3, “Parameters Available for User-Defined <filter> Settings”.The<subsystem>element should be added even if none of the optional parameters are set.<subsystem xmlns="urn:rhq:rtfilter:1.0"> <!-- Optional parameters. <init-param> <param-name>chopQueryString</param-name> <param-value>true</param-value> </init-param> <init-param> <param-name>logDirectory</param-name> <param-value>/tmp</param-value> </init-param> <init-param> <param-name>logFilePrefix</param-name> <param-value>localhost_7080_</param-value> </init-param> <init-param> <param-name>dontLogRegEx</param-name> <param-value></param-value> </init-param> <init-param> <param-name>matchOnUriOnly</param-name> <param-value>true</param-value> </init-param> <init-param> <param-name>timeBetweenFlushesInSec</param-name> <param-value>73</param-value> </init-param> <init-param> <param-name>flushAfterLines</param-name> <param-value>13</param-value> </init-param> <init-param> <param-name>maxLogFileSize</param-name> <param-value>5242880</param-value> </init-param> --> </subsystem>
To configure the response time filters for an individual web application:- Open the web application's
web.xmlfile.[root@server ~]# vim WARHomeDir/WEB-INF/web.xml
- Add the filter and, depending on the configuration, filter mapping elements to the file. This activates the response time filtering.All that is required for response time filtering to work is the default
<filter>element, without any optional parameters. However, the parameters can be uncommented and set as necessary; the different ones are described in Table 3, “Parameters Available for User-Defined <filter> Settings”.<filter> <filter-name>RhqRtFilter</filter-name> <filter-class>org.rhq.helpers.rtfilter.filter.RtFilter</filter-class> <!-- Optional parameters. <init-param> <param-name>chopQueryString</param-name> <param-value>true</param-value> </init-param> <init-param> <param-name>logDirectory</param-name> <param-value>/tmp</param-value> </init-param> <init-param> <param-name>logFilePrefix</param-name> <param-value>localhost_7080_</param-value> </init-param> <init-param> <param-name>dontLogRegEx</param-name> <param-value></param-value> </init-param> <init-param> <param-name>matchOnUriOnly</param-name> <param-value>true</param-value> </init-param> <init-param> <param-name>timeBetweenFlushesInSec</param-name> <param-value>73</param-value> </init-param> <init-param> <param-name>flushAfterLines</param-name> <param-value>13</param-value> </init-param> <init-param> <param-name>maxLogFileSize</param-name> <param-value>5242880</param-value> </init-param> --> </filter> <!-- Use this only when also enabling the RhqRtFilter in the filter <filter-mapping> <filter-name>RhqRtFilter</filter-name> <url-pattern>/*</url-pattern> </filter-mapping> -->
- Restart the JBoss EAP/AS server to load the new
web.xmlsettings.
Table 3. Parameters Available for User-Defined <filter> Settings
|
Parameter
|
Description
|
|---|---|
|
chopQueryString
|
Only the URI part of a query will be logged if this parameter is set to true. Otherwise the whole query line will be logged. Default is true.
|
|
logDirectory
|
The directory where the log files will be written to. Default setting is {
jboss.server.log.dir}/rt/ (usually server/xxx/log/rt). If this property is not defined, the fallback is {java.io.tmpdir}/rt/ (/tmp/ on UNIX®, and ~/Application Data/Local Settings/Temp – check the TEMP environment variable) is used. If you specify this init parameter, no directory rt/ will be created, but the directory you have provided will be taken literally.
|
|
logFilePrefix
|
A prefix that is put in front of the log file names. Default is the empty string.
|
|
dontLogRegEx
|
A regular expression that is applied to query strings. See java.util.regex.Pattern. If the parameter is not given or an empty string, no pattern is applied.
|
|
matchOnUriOnly
|
Should the dontLogRegEx be applied to the URI part of the query (true) or to the whole query string (false). Default is true.
|
|
timeBetweenFlushesInSec
|
Log lines are buffered by default. When the given number of seconds have passed and a new request is received, the buffered lines will be flushed to disk even if the number of lines to flush after (see next point) is not yet reached.. Default value is 60 seconds (1 Minute).
|
|
flushAfterLines
|
Log lines are buffered by default. When the given number of lines have been buffered, they are flushed to disk. Default value is 10 lines.
|
|
maxLogFileSize
|
The maximum allowed size, in bytes, of the log files; if a log file exceeds this limit, the filter will truncate it; the default value is 5242880 (5 MB).
|
|
vHostMappingFile
|
This properties file must exist on the Tomcat process classpath. For example, in the ../conf/vhost-mappings.properties. The file contains mappings from the 'incoming' vhost (server name) to the vhost that should be used as the prefix in the response time log file name. If no mapping is present (no file or no entry response times are set), then the incoming vhost (server name) is used. For example:
pickeldi.users.acme.com=pickeldi
pickeldi=
%HOST%=
The first mapping states that if the incoming vhost is 'host1.users.acme.com', then the log file name should get a vhost of 'host1' as prefix, separated by a _ from the context root portion. The second mapping states that if the 'incoming' vhost is 'host1', then no prefix, and no _, should be used. The third mapping uses a special left-hand-side token, '%HOST%'. This mapping states that if the 'incoming' vhost is a representation of localhost then no prefix, and no _ , should be used.
%HOST% will match the host name, or canonical host name or IP address, as returned by the implementation of InetAddress.getLocalHost().
The second and third mappings are examples of empty right hand side, but could just as well have provided a vhost.
This is a one time replacement. There is no recursion in the form that the result of the first line would then be applied to the second one.
|
6.5.2. Enabling the Call-Time Metric
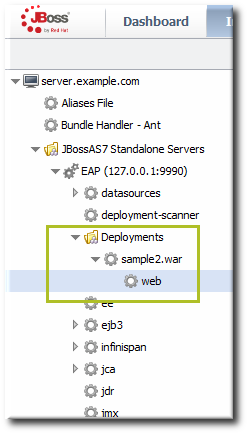
Figure 15. Web Runtime Resource
- Click the Inventory tab in the top menu.
- Click the Servers - Top Level Imports item, and select the JBoss EAP 6 resource.
- Navigate to the deployment resource, and expand the application to the web subsystem.
- Click the Monitoring tab on the web resource entry.
- Click the Schedules subtab.
- Select the Response Time metric. This metric is the calltime type.
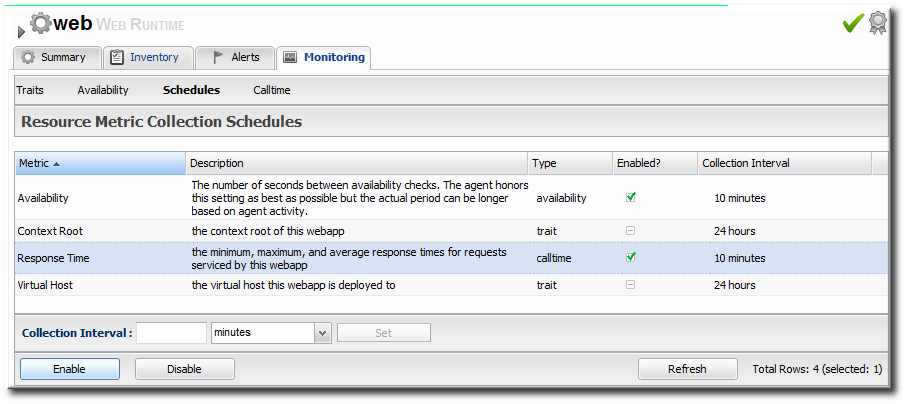
- Click the at the bottom of the list.
- Click the Inventory tab on the web entry.
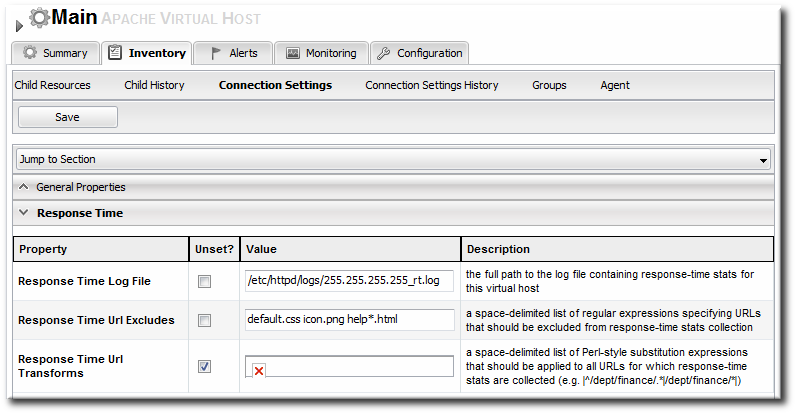
- Select the Connection Settings subtab.
- Unset the check boxes for the response time configuration and fill in the appropriate values for the web application.
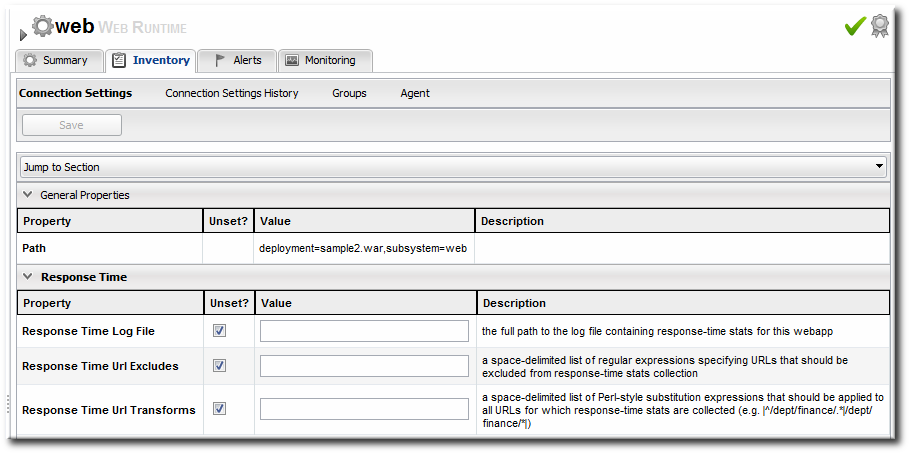
- The response times log which is used by that specific web application. The log file is a required setting for call-time data collection to work..
- Any files, elements, or pages to exclude from response time measurements. The response times log records times for all resources the web server serves, including support files like CSS files and icons or background images.
- The same page can be accessed with different parameters passed along in the URL. The Response Time Url Transforms field provides a regular expression that can be used to strip or substitute the passed parameters.
6.6. Setting up Response Time Monitoring for EWS/Tomcat and JBoss EAP 5
6.6.1. Parameters for User-Defined <filter>s
Table 4. Parameters for User-Defined <filter>s
|
Parameter
|
Description
|
|---|---|
|
chopQueryString
|
Only the URI part of a query will be logged if this parameter is set to true. Otherwise the whole query line will be logged. Default is true.
|
|
logDirectory
|
The directory where the log files will be written to. Default setting is {
jboss.server.log.dir}/rt/ (usually server/xxx/log/rt). If this property is not defined, the fallback is {java.io.tmpdir}/rt/ (/tmp/ on UNIX®, and ~/Application Data/Local Settings/Temp – check the TEMP environment variable) is used. If you specify this init parameter, no directory rt/ will be created, but the directory you have provided will be taken literally.
|
|
logFilePrefix
|
A prefix that is put in front of the log file names. Default is the empty string.
|
|
dontLogRegEx
|
A regular expression that is applied to query strings. See java.util.regex.Pattern. If the parameter is not given or an empty string, no pattern is applied.
|
|
matchOnUriOnly
|
Should the dontLogRegEx be applied to the URI part of the query (true) or to the whole query string (false). Default is true.
|
|
timeBetweenFlushesInSec
|
Log lines are buffered by default. When the given number of seconds have passed and a new request is received, the buffered lines will be flushed to disk even if the number of lines to flush after (see next point) is not yet reached.. Default value is 60 seconds (1 Minute).
|
|
flushAfterLines
|
Log lines are buffered by default. When the given number of lines have been buffered, they are flushed to disk. Default value is 10 lines.
|
|
maxLogFileSize
|
The maximum allowed size, in bytes, of the log files; if a log file exceeds this limit, the filter will truncate it; the default value is 5242880 (5 MB).
|
|
vHostMappingFile
|
This properties file must exist in the Tomcat process classpath. For example, in the
conf/vhost-mappings.properties file. The file contains mappings from the 'incoming' vhost (server name) to the vhost that should be used as the prefix in the response time log file name. If no mapping is present (no file or no entry response times are set), then the incoming vhost (server name) is used. For example:
pickeldi.users.acme.com=pickeldi
pickeldi=
%HOST%=
The first mapping states that if the incoming vhost is 'host1.users.acme.com', then the log file name should get a vhost of 'host1' as prefix, separated by a _ from the context root portion. The second mapping states that if the 'incoming' vhost is 'host1', then no prefix, and no _, should be used. The third mapping uses a special left-hand-side token, '%HOST%'. This mapping states that if the 'incoming' vhost is a representation of localhost then no prefix, and no _ , should be used.
%HOST% will match the host name, or canonical host name or IP address, as returned by the implementation of InetAddress.getLocalHost().
The second and third mappings are examples of empty right hand side, but could just as well have provided a vhost.
This is a one time replacement. There is no recursion in the form that the result of the first line would then be applied to the second one.
|
6.6.2. Configuring Response Time Metrics for JBoss EAP/AS 5
- Download the Response Time packages for JBoss from the JBoss ON UI.
Note
This can also be done from the command line usingwget:[root@server ~]# wget http://server.example.com:7080/downloads/connectors/connector-rtfilter.zip
- Click the Administration tab in the top menu.
- In the Configuration menu box on the left, select the item.
- Click the connector-rtfilter.zip link, and save the file.
- Unzip the connectors.
[root@server ~]# unzip connector-rtfilter.zip
- Copy the
rhq-rtfilter-version.jarfile into thelib/directory for the profile.[root@server ~]# cp connector-rtfilter/rhq-rtfilter-version.jar JbossHomeDir/server/profileName/lib/
JBoss EAP/AS already includes thecommons-logging.jarfile, which is also required for response time filtering. - Then, configure the
web.xmlfor the EAP/AS instance.The response time filter can be deployed globally, for all web applications hosted by the EAP/AS instance or it can be configured for a specific web application.To configure it globally, edit the globalweb.xmlfile:[root@server ~]# vim JbossHomeDir/server/configName/default/deploy/jbossweb.sar/
To configure it for a single web app, edit that one web app'sweb.xmlfile:[root@server ~]# vim WARLocation/WEB-INF/web.xml
- Add the filter and, depending on the configuration, filter mapping elements to the file. This activates the response time filtering.All that is required for response time filtering to work is the default
<filter>element, without any optional parameters. However, the parameters can be uncommented and set as necessary; the different ones are described in Table 4, “Parameters for User-Defined <filter>s”.<filter> <filter-name>RhqRtFilter</filter-name> <filter-class>org.rhq.helpers.rtfilter.filter.RtFilter</filter-class> <!-- Optional parameters. <init-param> <param-name>chopQueryString</param-name> <param-value>true</param-value> </init-param> <init-param> <param-name>logDirectory</param-name> <param-value>/tmp</param-value> </init-param> <init-param> <param-name>logFilePrefix</param-name> <param-value>localhost_7080_</param-value> </init-param> <init-param> <param-name>dontLogRegEx</param-name> <param-value></param-value> </init-param> <init-param> <param-name>matchOnUriOnly</param-name> <param-value>true</param-value> </init-param> <init-param> <param-name>timeBetweenFlushesInSec</param-name> <param-value>73</param-value> </init-param> <init-param> <param-name>flushAfterLines</param-name> <param-value>13</param-value> </init-param> <init-param> <param-name>maxLogFileSize</param-name> <param-value>5242880</param-value> </init-param> --> </filter> <!-- Use this only when also enabling the RhqRtFilter in the filter <filter-mapping> <filter-name>RhqRtFilter</filter-name> <url-pattern>/*</url-pattern> </filter-mapping> --> - Restart the JBoss EAP/AS server to load the new
web.xmlsettings. - Enable the HTTP metrics, as described in Section 6.6.4, “Configuring HTTP Response Time Metrics”, so that JBoss ON checks for the response time metrics on the application server.
6.6.3. Configuring Response Time Filters for Tomcat
- Download the Response Time packages for Tomcat from the JBoss ON UI.
- Click the Administration tab in the top menu.
- In the Configuration menu box on the left, select the item.
- Click the connector-rtfilter.zip link, and save the file.
- Unzip the Response Time connectors.
unzip connector-rtfilter.zip
The package contains two JAR files,commons-logging-version.jarandrhq-rtfilter-version.jar. Tomcat 5 servers use only thecommons-logging-version.jarfile, while Tomcat 6 servers require both files. - Copy the appropriate JAR files into the Tomcat configuration directory. The directory location depends on the Tomcat or JBoss instance (for embedded Tomcat) being modified.For example, on a standalone Tomcat 5.5:
cp commons-logging-version.jar /var/lib/tomcat5/server/lib/
On Tomcat 6:cp rhq-rtfilter-version.jar /var/lib/tomcat6/lib/ cp commons-logging-version.jar /var/lib/tomcat6/lib/
For example, on an embedded Tomcat instance:cp rhq-rtfilter-version.jar JBoss_install_dir/server/default/deploy/jboss-web.deployer/ cp commons-logging-version.jar JBoss_install_dir/server/default/deploy/jboss-web.deployer/
- Open the
web.xmlfile to add the filter definition. The exact location of the file depends on the server instance and whether it is a standalone or embedded server; several common locations are listed in Table 5, “web.xml Configuration File Locations”. - Add either a
<filter>or a<filter-mapping>entry to configuration the Response Time filter in the Tomcat server. Either a<filter>or a<filter-mapping>entry can be used, but not both.The most basic filter definition references simply the Response Time filter name and class in the<filter>element. This loads the response time filter with all of the default settings.<filter> <filter-name>RhqRtFilter </filter-name> <filter-class>org.rhq.helpers.rtfilter.filter.RtFilter </filter-class> </filter>The filter definition can be expanded with user-defined configuration values by adding<init-paramelements. This loads the response time filter with all of the default settings.<filter> <filter-name>RhqRtFilter </filter-name> <filter-class>org.rhq.helpers.rtfilter.filter.RtFilter </filter-class> <init-param> <description>Name of vhost mapping file. This properties file must be in the Tomcat process classpath.</description> <param-name>vHostMappingFile</param-name> <param-value>vhost-mappings.properties</param-value> </init-param> ... </filter>The available parameters are listed in Table 4, “Parameters for User-Defined <filter>s”.Alternatively, set a<filter-map>entry which gives the name of the response time filter and pattern to use to match the URL which will be monitored.<filter-mapping> <filter-name>RhqRtFilter </filter-name> <url-pattern>/* </url-pattern> </filter-mapping>Note
Put the Response Time filter in front of any other configured filter so that the response time metrics will include all of the other response times, total, in the measurement. - Restart the Tomcat instance to load the new configuration.
- Enable the HTTP metrics, as described in Section 6.6.4, “Configuring HTTP Response Time Metrics”, so that JBoss ON checks for the response time metrics on the application server.
Table 5. web.xml Configuration File Locations
| Tomcat Version | Embedded Server Type | File Location |
|---|---|---|
| Tomcat 6 | Standalone Server | /var/lib/tomcat6/webapps/project/WEB-INF/web.xml |
| Tomcat 5 | Standalone Server | /var/lib/tomcat5/webapps/project/WEB-INF/web.xml |
| Tomcat 6 | EAP 5 EAP 5.0.0 | JBOSS_HOME/server/config/deployers/jbossweb.deployer/web.xml |
| Tomcat 6 | JBoss 4.2, JBoss EAP4 | JBOSS_HOME/server/config/deploy/jboss-web.deployer/conf/web.xml |
| Tomcat 5.5 | JBoss 4.0.2 | JBOSS_HOME/server/config/deploy/jbossweb-tomcat55.sar/conf/web.xml |
| Tomcat 5.0 | JBoss 3.2.6 | JBOSS_HOME/server/config/deploy/jbossweb-tomcat50.sar/conf/web.xml |
| Tomcat 4.1 | JBoss 3.2.3 | JBOSS_HOME/server/config/deploy/jbossweb-tomcat41.sar/web.xml |
6.6.4. Configuring HTTP Response Time Metrics
- Install the response time filter for the web server. If necessary, set up the filter entry in the
web.xmlfile. - Click the Inventory tab in the top menu.
- Select the Servers menu table on the left, and then navigate to the web server
- Click the Connection Settings tab on the web server resource entry. and scroll to the Response Time configuration section.
- Configure the response time properties for the web server. The agent has to know what log file the web server uses to record response time data.Optionally, the server can perform certain transformations on the collected data.
- The response times log records times for all resources the web server serves, including support files like CSS files and icons or background images. These resources can be excluded from the response time calculations in the Response Time Url Excludes field.
- The same page can be accessed with different parameters passed along in the URL. The Response Time Url Transforms field provides a regular expression that can be used to strip or substitute the passed parameters.
- Click the button.
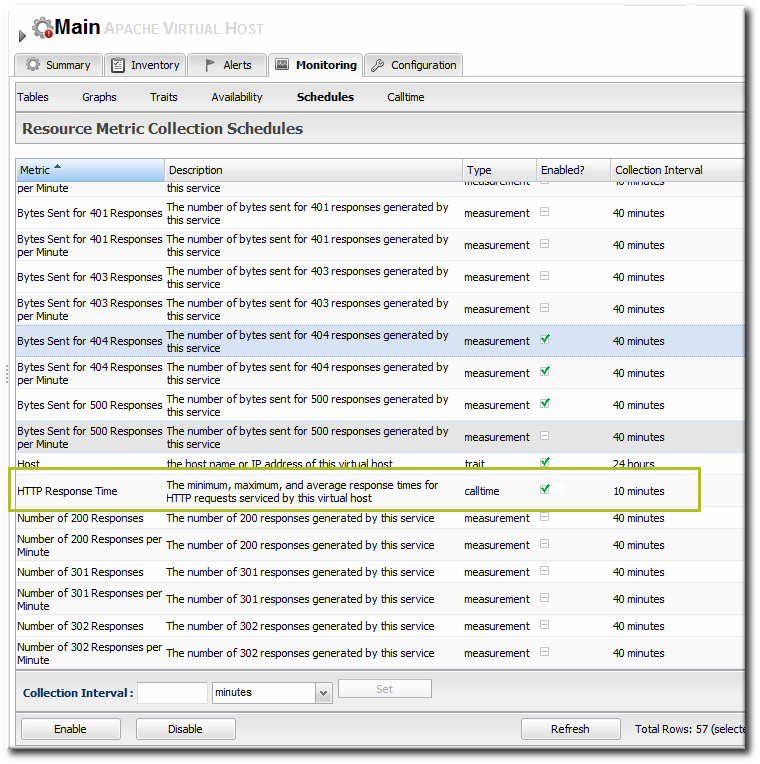
- Click the Monitoring tab on the web server resource entry.
- Click the Schedules subtab.
- Select the HTTP Response Time metric. This metric is the calltime type.
- Click the at the bottom of the list.
7. Resource Traits
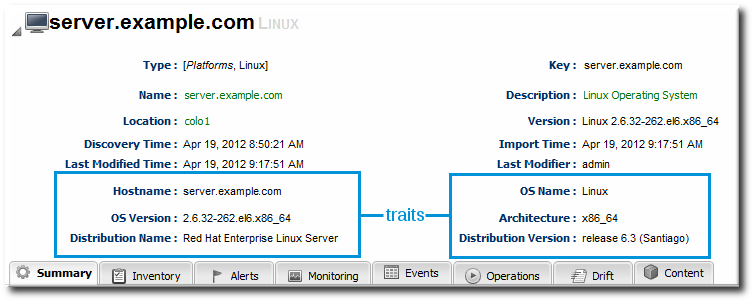
Figure 16. Resource Details
7.1. Collection Interval
7.2. Viewing Traits
- The trait name. The traits which are monitored for a resource are defined with other monitoring settings in the resource type's plug-in descriptor.
- The trait value.
- The time of the last collection where a change in trait information was detected.
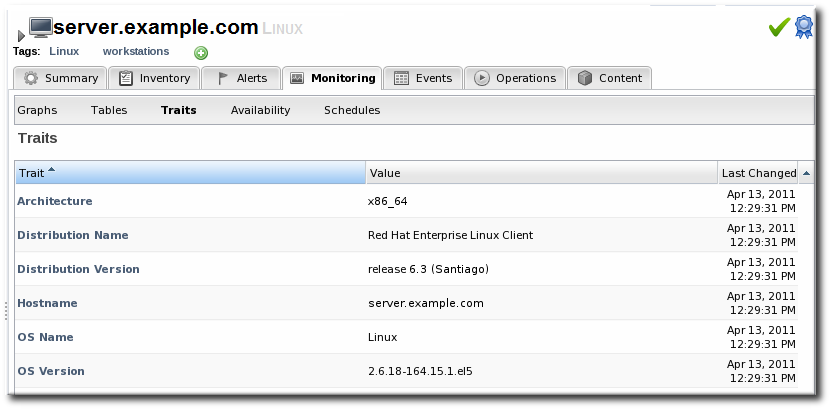
Figure 17. Trait Charts
7.3. Extended Example: Alerting and Traits
Trait information tends to be static. While traits can, and do, change, they do so infrequently. Also, traits convey descriptive information about a resource, not state data or dynamic measurements, so traits are not critical for IT administrators to track closely.
For example, Tim the IT Guy has automatic updates configured for his Red Hat Enterprise Linux development and QA servers. Because his production environment has controlled application and system updates, there are no automatic updates for those servers.

Figure 18. Trait Alert Condition
- He sets two conditions, using an OR operator. The alert triggers when the distribution version changes or when the operating system version changes. This catches both minor and major updates to the operating system or kernel.
- It is set to low priority so it is informative but not critical.
- Tim decides that the alert notification is sent to his JBoss ON user, so he sees notifications when he logs in. He could also configure an email notification for high-priority resources.
8. Resources Which Require Special Configuration for Monitoring
8.1. Configuring Tomcat/EWS Servers for Monitoring
Note
8.2. Configuring the Apache SNMP Module
Important
apachectl -l command to list the compiled modules and look for the mod_so.c module:
[root@server ~]# apachectl -l
Compiled in modules:
  core.c
  prefork.c
  http_core.c
  mod_so.c
--enable-module=so option:
$ ./configure --enable-module=so
$ make install
- Download the Apache binaries from the JBoss ON UI.
- Log into the JBoss ON UI.
https://server.example.com:7080
- Click the Administration tab in the top menu.
- In the Configuration menu box on the left, select the item.
- Scroll to Connector Downloads, and click the
connector-apache.ziplink to download the Apache connectors.
- Unzip the Apache connectors in a directory that is accessible to the JBoss ON agent.
unzip connector-apache.zip
- Each Apache version and platform has its own package that contains the Apache-SNMP connectors. Extract the Apache connectors in a directory that is accessible to the JBoss ON agent. Binaries are available for Red Hat Enterprise Linux 32-bit and 64-bit and Windows 32-bit.For example, on Red Hat Enterprise Linux 32-bit:
[jsmith@server ~]$ cd apacheModuleRoot/apache-snmp/binaries/
[jsmith@server binaries]$ tar xjvf snmp_module-x86-linux-apache#.tar.bz2
# is the Apache server version number.Note
Apache connectors can be compiled for other platforms, like Solaris, from the source files inapacheRoot/apache-snmp/binaries/sources. For example:[jsmith@server ~]$ cd JON_AGENT_INSTALL_DIR/product_connectors/apache-snmp/sources [jsmith@server sources]$ ./build_apache_snmp.sh APACHE_VERSION APACHE_2.x_INSTALL_DIR/bin/apxs
To compile the Apache-SNMP connector,apxs,perl,make, andautomakemust all be installed and in userPATH. - Install the module. For example:
[root@server ~]# cd apacheModuleRoot/apache-snmp/binaries/snmp_module_#

[root@server snmp_module]# cp module/* apache_install_directory/modules

[root@server snmp_module]# cp conf/* apache_install_directory/conf

[root@server snmp_module]# mkdir apache_install_directory/var
On Windows:> xcopy /e JON_AGENT_INSTALL_DIR\product_connectors\apache-snmp\binaries\x86
- Open the
httpd.conffile for editing. For example:[root@server ~]# vim apache_install_directory/conf/httpd.conf
- Enable the module by adding these lines to the
httpd.conffile.LoadModule snmpcommon_module modules/libsnmpcommon.so LoadModule snmpagt_module modules/libsnmpmonagt.so SNMPConf conf SNMPVar var
For Windows:LoadModule snmpcommon_module modules/snmpcommon.so LoadModule snmpagt_module modules/snmpmonagt.so SNMPConf conf SNMPVar var
- Make sure the main Apache configuration section, as well as each
<VirtualHost>configuration block, contains aServerNamedirective with a port. The SNMP module uses this directive to uniquely identify the main server and each virtual host, so eachServerNamedirective must contain a unique value. For example:ServerName main.example.com:80 ... <VirtualHost vhost1.example.com:80> ServerName vhost1.example.com:80 ... </VirtualHost>
- If there is more than one Apache instance on the same machine, it is possible to use different SNMP files for each instance.
- Each Apache instance has its own
httpd.conffile. Set theSNMPConfdirectory in each file to its own SNMP configuration directory. For example, for instance1:vim instance1-httpd.conf SNMPConf /opt/apache-instance1/conf
Then, for instance2:vim instance2-httpd.conf SNMPConf /opt/apache-instance2/conf
Eachsnmpd.conffile should be in the specified directory. - Edit the
agentaddressproperty in apache_install_directory/conf/snmpd.confso that each instance has a different value agent address and port, so there is no conflict between instances.See the snmpd.conf documentation for a description of this property's syntax.
- Restart the Apache server. For example:
apachectl -k restart
- Verify that the SNMP module was properly installed. If the module is loaded, then there will be lines referencing the SNMP module in the errors log:
grep SNMP apache_installation_dir/logs/error_log

[Wed Mar 19 09:54:34 2008] [notice] Apache/2.0.63 (Unix) CovalentSNMP/2.3.0 configured -- resuming normal operations
[Wed Mar 19 09:54:35 2008] [notice] SNMP: CovalentSNMP/2.3.0 started (user '1000' - SNMP address '1610' - pid '26738')
8.3. Metrics Collection Considerations with Apache and SNMP
- Bytes received for GET requests per minute
- Bytes received for POST requests per minute
- Total number of bytes received per minute
9. Reports and Data
- Dashboards with metrics portlets for individual resources, compatible groups, and the main dashboard
- Timelines, which aggregate all collected data, events, configuration, operations, and other changes for a resource
- Resource-level charts and tables for metrics
- A Suspect Metrics report
9.1. Dashboards and Portlets
9.1.1. Resource-Level Dashboards
Figure 19. Resource Summary Tab
9.1.2. Main Dashboard
- Platform Utilization, which shows free memory, CPU usage, and other metrics related to platform performance.
- Alerted or Unavailable Resources, which shows a list of the most recent five resources which have issued an alert or been reported as down
- A graph for a specific metric for a compatible group
- A graph for a specific metric for a resource
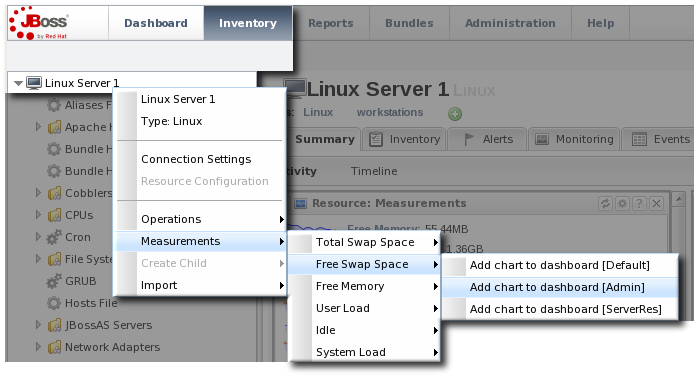
9.1.3. Adding Monitoring Metrics to the Main Dashboard
- Click the Inventory tab in the top menu.
- Select the resource type in the Resources menu table on the left, and then browse or search for the resource.
- In the resource hierarchy on the left, right-click the resource name.
- Scroll down to the menu item, select the metric from the list, and then select the dashboard to add the chart to.
9.2. Summary Timelines
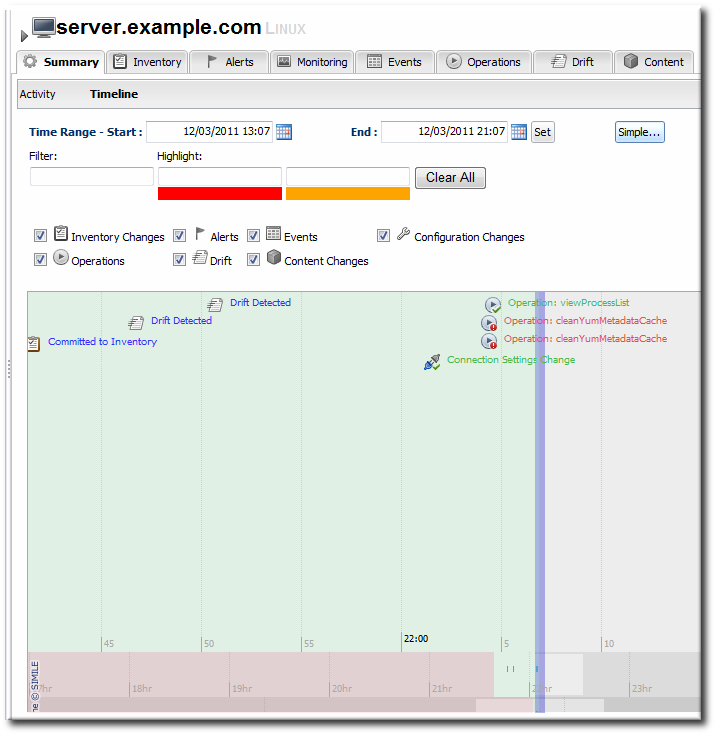
Figure 20. Summary Timeline
9.3. Resource-Level Metrics Charts
- Section 4.2, “Viewing Metrics and Baseline Charts” for graphs and tables of the same metrics information
Figure 21. Metrics Chart
9.4. Creating Custom Metrics Pages
- Open the Monitoring > Charts page.
- In the Action drop-down menu, select Create New View.

- Enter a name in the View field, and click .
- To switch to a view, open the Action drop-down menu, and select the view name.
- Use the arrows by the different metrics charts to change the order the metrics are displayed. To remove a metric from the view, click the X box.
9.5. Suspect Metrics Report
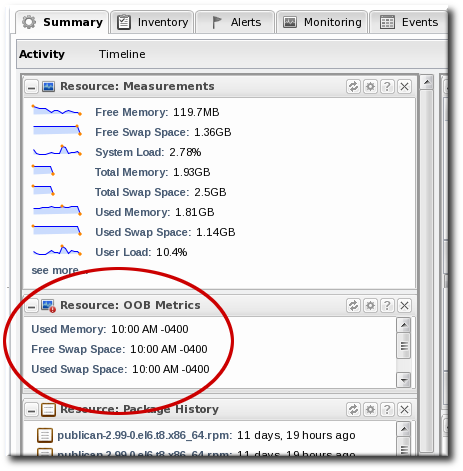
Figure 22. Out of Bounds Portlet
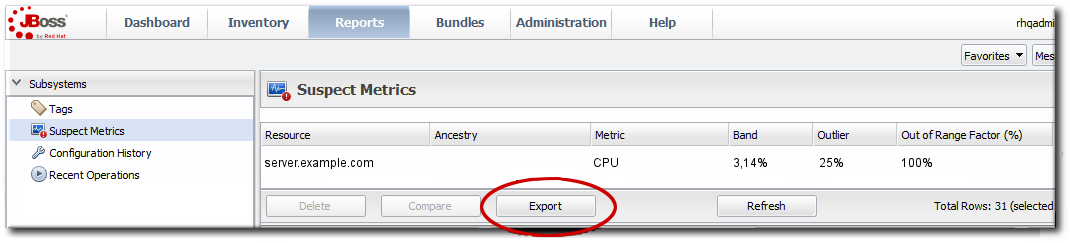
Figure 23. Suspect Metrics Reports
Note
suspectMetrics.csv.
9.6. Platform Utilization Report
- Current CPU percentage
- The actual memory usage, based on the available physical memory, buffer, and cache
- Swap
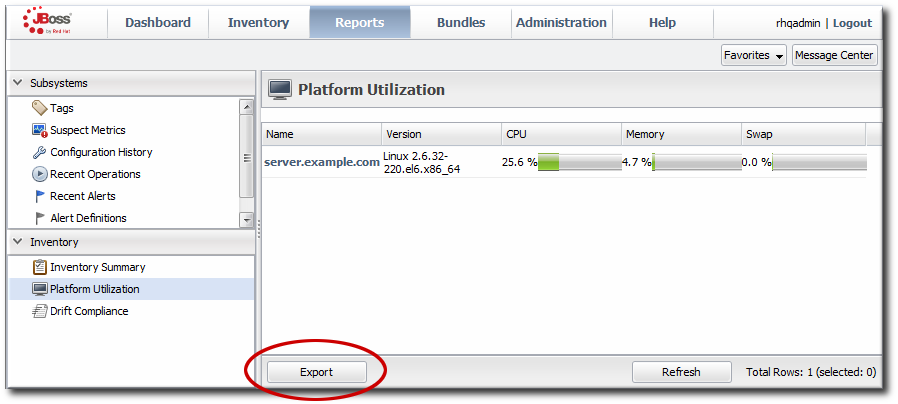
Figure 24. Platform Utilization Report
Note
Note
platformUtilization.csv.
10. Storing Monitoring Data
- Raw metrics are collected every few minutes and are aggregated in a rolling average in one-hour windows to produce minimum, average, and maximum values.
- One-hour values are combined and averaged in six-hour periods.
- Six-hour periods are combined and aggregated into 24-hour (1 day) windows.
10.1. Changing Storage Lengths
Note
- In the System Configuration menu, select the item.
- Scroll to the Data Manager Configuration Properties section.
- Change the storage times for the different types of monitoring data.
 There are four settings that relate directly to storing monitoring data:
- Response time data for web servers and EJB resources. This is kept for one month (31 days) by default.
- Events information, meaning all of the log files generated by the agent for the resource. The default storage time for event logs is two weeks.
- All measurement data, both metrics and traits. The default time is one year (365 days).
- Availability information. The default time is one year (365 days).
10.2. Exporting Raw Data
MeasurementDataManager class has a method to find the metric values for a specific resource within a certain time range:
findDataForResource(resourceId,[metricId],startTime,endTime,numberOfRecords)
exporter.file = '/export/metrics/metrics.csv'
exporter.format = 'csv'
var start = new Date() - 8* 3600 * 1000;
var end = new Date()
var data = MeasurementDataManager.findDataForResource(10003,[10473],start,end,60)
exporter.write(data.get(0))
11. Planning Alerts
- The information that identifies that specific alert definition — the name, priority, and whether it is active (Section 11.2, “Basic Procedure for Setting Alerts for a Resource”)
- The conditions that trigger the alert, which depends on the area of the resource being monitored (Section 12, “Alert Conditions”)
- The method and settings to use to send the alert (Section 13, “Alert Responses”)
11.1. An Alerting Strategy in Four Questions
11.1.1. What's the Condition?
11.1.2. What's the Frequency?
11.1.3. What's the Response to Take?
11.1.4. How Many Resources Does This Affect?
Note
11.2. Basic Procedure for Setting Alerts for a Resource
Note
- Click the Inventory tab in the top menu.
- Select the resource type in the Resources menu table on the left, and then browse or search for the resource.
- Click the resource name in the list.
- Click the Alerts tab for the resource.
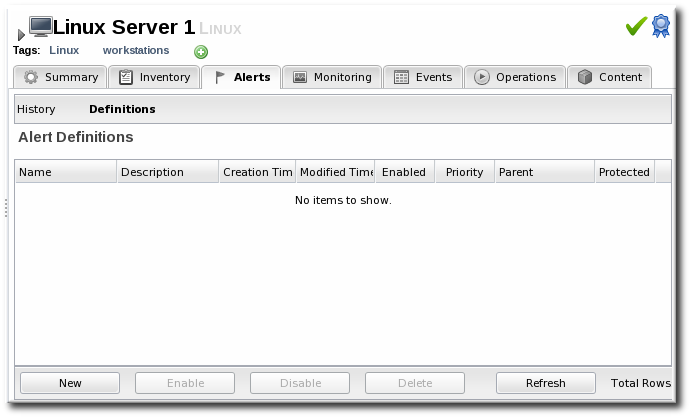
- In the Definitions subtab, click the New button to create the new alert.
- In the General Properties tab, give the basic information about the alert.
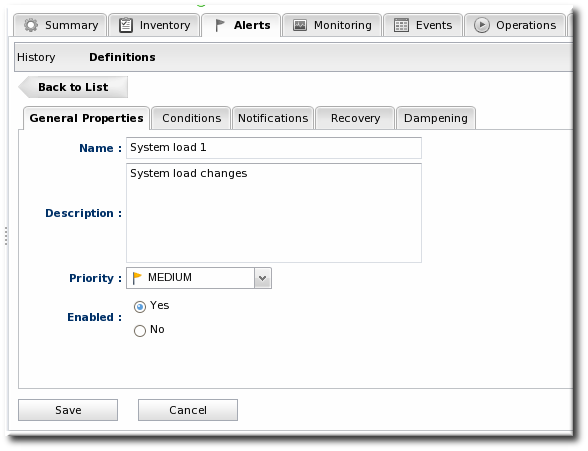
- Name. Gives the name of the specific alert definition. This must be unique for the resource.
- Description. Contains an optional description of the alert; this can be very useful if you want to trigger different kinds of alert responses at different conditions for the same resource.
- Priority. Sets the priority or severity that is given to an alert triggered by this definition.
- Enabled. Sets whether the alert definition is active. Alert definitions can be disabled to prevent unnecessary or spurious alerts if there is, for instance, a network outage or routine maintenance window for the resource.
- In the Conditions tab, set the metric or issue that triggers the alert. Click the Add button to bring up the conditions form.

Note
There can be more than one condition set to trigger an alert. For example, you may only want to receive a notification for a server if its CPU goes above 80% and its available memory drops below 25MB. The ALL setting for the conditions restricts the alert notification to only when both criteria are met. Alternatively, you may want to know when either one occurs so that you can immediately change the load balancing configuration for the network. In that case, the ANY setting fires off a notification as soon as even one condition threshold is met.- Click the Add a new condition button.
- From the initial drop-down menu, select the type of condition. The categories of conditions are described in Table 6, “Types of Alert Conditions”, and the exact conditions available to be set for every resource are listed in the Resource Monitoring Reference.
- Set the values for the condition.
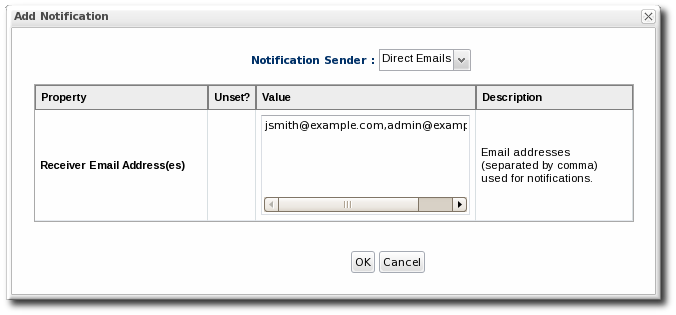
- In the Notifications tab, click Add to set a notification for the alert.
- Select the method to use to send the alert notification in the Sender option.
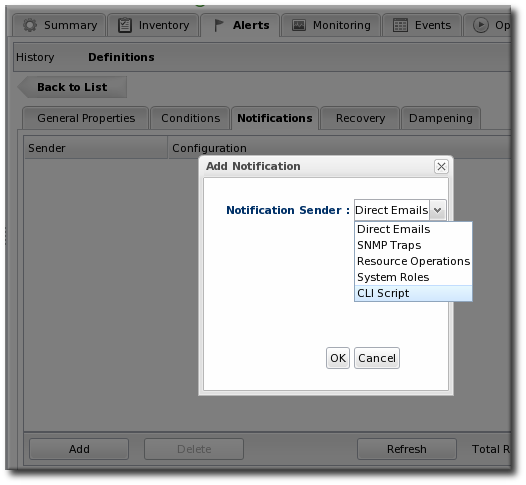 The Sender option first sets the specific type of alert method (such as email or SNMP) and then opens the appropriate form to fill in the details for that specific method.
 - Fill in the required information for the alert sender method. The method may require contact information, SNMP settings, operations, or scripts, depending on what is selected.
- In the Recovery tab, set whether to disable an alert until the resource state is recovered. Optionally, select another alert to enable (or recover) when this alert fires.
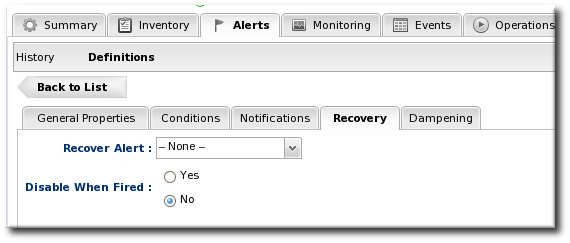 A recover alert takes a disabled alert and re-enables it. This is used for two alerts which show changing states, like a pair of alerts to show when availability goes down and then back up.
 - In the Dampening tab, give the dampening (or frequency) rule on how often to send notifications for the same alert event.
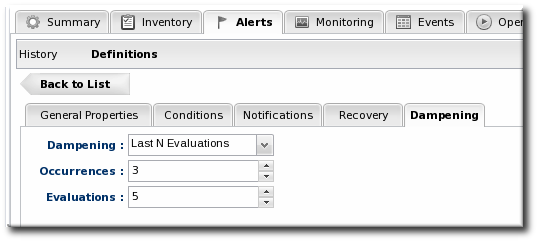 The frequency for sending alerts depends on the expected behavior of the resource. There has to be a balance between sending too many alerts and sending too few. There are several frequency settings:
- Consecutive. Sends an alert if the condition occurs a certain number of times in a row for metric calculations. For example, if this is set to three, then the condition must be detected in three consecutive metric collection periods for the alert to be fired. If this is set to one, then it sends an alert every time the condition occurs.
- Last N evaluations. This sets a number of times that the condition has to occur in a given number of monitoring evaluations cycles before an alert is sent.
- Time period. The other two similar dampening rules set a recurrence based on the JBoss ON monitoring cycles. This sets the alerting rule based on a specific time period.
- Click OK to save the alert definition.
11.3. Enabling and Disabling Alert Definitions
- Click the Inventory tab in the top menu.
- Select the resource type in the Resources menu table on the left, and then browse or search for the resource.
- Click the Alerts tab.
- In the Definitions subtab, select any of the definitions to enable or disable.
- Click the Enable or Disable button.
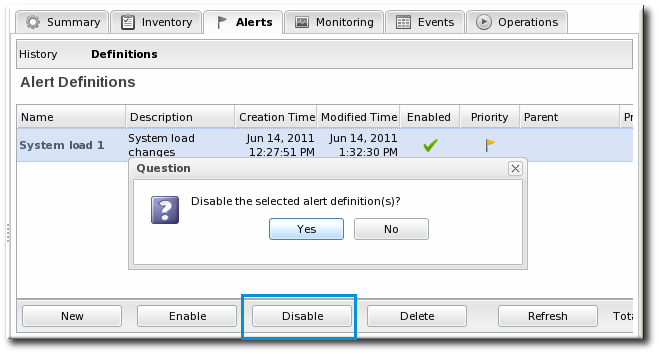
- Confirm the action.
11.4. Group Alerting and Alert Templates
- Alert templates
- Alerts on compatible groups
Note
11.4.1. Creating Alert Definition Templates
Note
- In the top navigation, open the Administration menu, and then the System Configuration menu.
- Select the Alert Templates menu item. This opens a long list of resource types, both for platforms and server types.
- Locate the type of resource for which to create the template definition.

- Click the button to create a global alert definition. Set up the alert exactly the same way as setting an alert for a single resource (as in Section 11.2, “Basic Procedure for Setting Alerts for a Resource”).
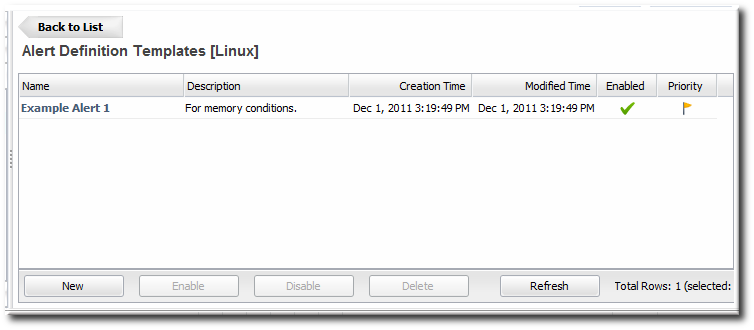
- Save the template.
11.4.2. Configuring Group Alerts
- In the Inventory tab in the top menu, select the Compatible Groups item in the Groups menu on the left.

- In the main window, select the group to add the alert to.
- Click the Alerts tab for the group.
- In the Definitions subtab, click the button.
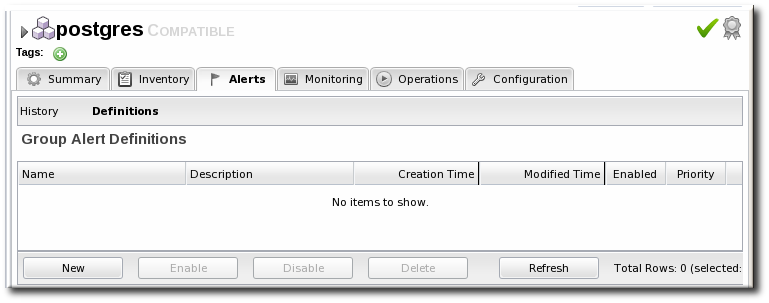
- Configure the basic alert definition and notifications, as in Section 11.2, “Basic Procedure for Setting Alerts for a Resource”.
12. Alert Conditions
Important
12.1. Reasons for Firing an Alert
Table 6. Types of Alert Conditions
| Condition Type | Description |
|---|---|
| Metric | A specific monitoring area that is checked and the thresholds for that area which trigger a response. Metrics are usually numeric responses of some sort (e.g., percent CPU usage, number of requests, or a cache hit ratio). |
| Trait | A change in a value for a specific setting. Traits are usually string values. |
| Availability | A sudden change in whether the resource is available or unavailable. |
| Operation | A specific action or task that is performed on the resource. |
| Events | A certain type of error message, matching a given string, is recorded. Events are filtered from system or application log files, and the types of events recognized in JBoss ON depend on the event configuration for the resource. |
| Drift | A resource has changed from a predefined configuration. |
12.2. Detailed Discussion: Ranges, AND, and OR Operators with Conditions
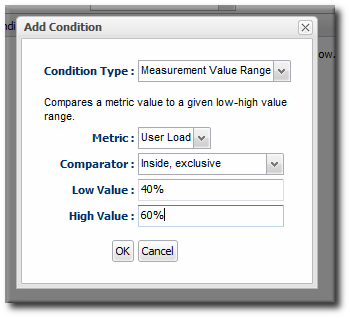
Figure 25. Alert Condition Range
12.3. Detailed Discussion: Conditions Based on Log File Messages
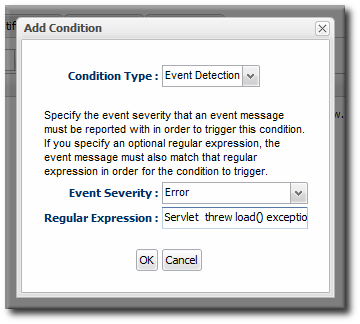
Figure 26. Log File Conditions
Note
12.4. Detailed Discussion: Dampening
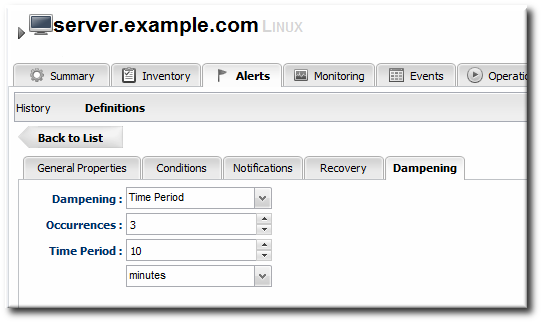
Figure 27. Dampening Filter
- JBoss ON could send an alert every time the condition is encountered. In that case, there would be multiple alerts issued if the CPU percentage bounced around, while only one alert would be sent if it hit it briefly or hit it and stayed there.
- JBoss ON could send an alert only if the condition was encountered a certain number of times consecutively or X number of times out of Y number of polls. In this case, only a recurring or sustained problem would trigger an alert. A momentary spike or trough wouldn't be enough to fire a notification.A condition may need to occur several times over a short period of time for it to be a problem, but once is not a problem. For example, a server may bounce between 78% and 80% CPU over several minutes, it could hit 80% once for only a few seconds, or it could hit 80% and stay there. The condition may only be relevant if the CPU hits 80% and stays, and the other readings can be ignored.
- A notification is sent only if the problem occurs within a set time period. This can be useful to track the frequency of recurring problems or to track how long a condition persisted.
Note
12.5. Detailed Discussion: Automatically Disabling and Recovering Alerts
- A pair of alerts work as mutual toggle switches. When one alert is active, the other is disabled. When Alert A is fired, it can be set to recover a specified Alert B — so Alert B essentially takes its place.
- Alerts work as a kind of cascade. If Alert A is fired, that enables Alert B, which then enables Alert C. In some situations, any one given condition may not be a problem, but it becomes a problem if they occur sequentially in a short amount of time.
Figure 28. Disable and Recover Alerts
Tim the IT Guy has several servers that he uses for email routing and other business operations, and then he has a couple of machines that he holds in reserve as backups.
mail-server-a.example.com has his primary mail server, and he only wants to bring mail-server-b.example.com online if mail-server-a goes offline, and then he wants it to go back in reserve when mail-server-a comes back.
Tim creates a set of alert definitions to help handle the transition between his mail servers.
- The first alert definition fires when the
mail-server-aplatform changes availability state to goes down.The notification does a couple of things:- Deploy a bundle with the latest mail server configuration to another platform,
mail-server-b. - Execute a command-line script on
mail-server-bto start the mail service. - Email Tim the IT Guy to let him know that
mail-server-ais unavailable.
For recovery, the alert does two things:- Disable the current alert. It only needs to fire once, to get the backup server online.
- Recover (or enable) Alert B, so that JBoss ON waits for
mail-server-ato come back up.
- The second alert definition, Alert B, is only in effect while mail-server-a is offline. This alert fires as soon as
mail-server-bchanges availability state to goes up.- This alert definition basically waits around as long as
mail-server-ais down. Whenmail-server-ais back online, Alert B's notification is to execute a command-line script onmail-server-bto stop the mail service. - Alert B also sends a notification email to Tim the IT Guy to let him know that
mail-server-ais available again.
For recovery, the alert does two things:- Disable the current alert. Like with Alert A, Alert B only needs to fire once, to shut off the backup as soon as the primary server is back.
- Recover (or enable) Alert A, so the JBoss ON waits again for
mail-server-ato go down.
13. Alert Responses
Important
13.1. Notifying Administrators and Responding to Alerts
- Email, to one or multiple addresses
- SNMP traps
- Messages to JBoss ON users
- Running a resource operation (on the alerting resource or any other resource in inventory)
- Running a resource script (specific type of resource operation)
- JBoss ON CLI scripts
Note
Note
13.2. Detailed Discussion: Initiating an Operation
- Alert operations are fired responsively to address any alert or event.
- Alert operations can be initiated on any resource in the JBoss ON inventory, not only the resource which sent the alert. That means that an operation can be run for a different application on the same host server or even on an entirely different server.
13.2.1. Using Tokens with Alert Operations
<%space.param_name%>
alert or resource. The param_name gives the entry value that is being supplied. For example, to point to the URL of the specific fired alert, the token would be <%alert.url%>, while to pull in the resource name, the token would be <%resource.name%>.
Table 7. Available Alert Operation Tokens
| Information about ... | Token | Description |
|---|---|---|
| Fired Alert | alert.willBeDisabled | Will the alert definition be disabled after firing? |
| Fired Alert | alert.id | The id of this particular alert |
| Fired Alert | alert.url | Url to the alert details page |
| Fired Alert | alert.name | Name from the defining alert definition |
| Fired Alert | alert.priority | Priority of this alert |
| Fired Alert | alert.description | Description of this alert |
| Fired Alert | alert.firedAt | Time the alert fired |
| Fired Alert | alert.conditions | A text representation of the conditions that led to this alert |
| Alerting Resource | resource.id | ID of the resource |
| Alerting Resource | resource.platformType | Type of the platform the resource is on |
| Alerting Resource | resource.platformName | Name of the platform the resource is on |
| Alerting Resource | resource.typeName | Resource type name |
| Alerting Resource | resource.name | Name of the resource |
| Alerting Resource | resource.platformId | ID of the platform the resource is on |
| Alerting Resource | resource.parentName | Name of the parent resource |
| Alerting Resource | resource.parentId | ID of the parent resource |
| Alerting Resource | resource.typeId | Resource type id |
| Target Resource | targetResource.parentId | ID of the target's parent resource |
| Target Resource | targetResource.platformName | Name of the platform the target resource is on |
| Target Resource | targetResource.platformId | ID of the platform the target resource is on |
| Target Resource | targetResource.parentName | Name of the target's parent resource |
| Target Resource | targetResource.typeId | Resource type of the target resource id |
| Target Resource | targetResource.platformType | Type of the platform the target resource is on |
| Target Resource | targetResource.name | Name of the target resource |
| Target Resource | targetResource.id | ID of the target resource |
| Target Resource | targetResource.typeName | Resource type name of the target resource |
| Operation | operation.id | ID of the operation fired |
| Operation | operation.name | Name of the operation fired |
13.2.2. Setting Alert Operations
Note
Figure 29. Senders
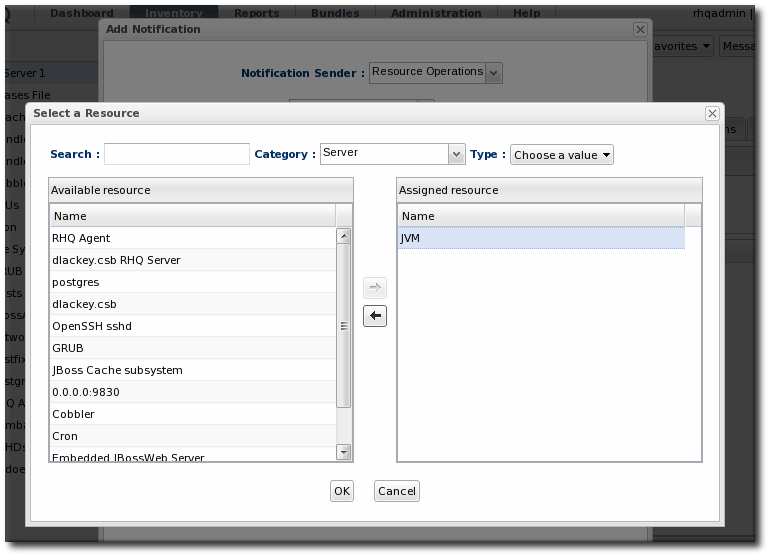
Figure 30. Resource Selection
Important
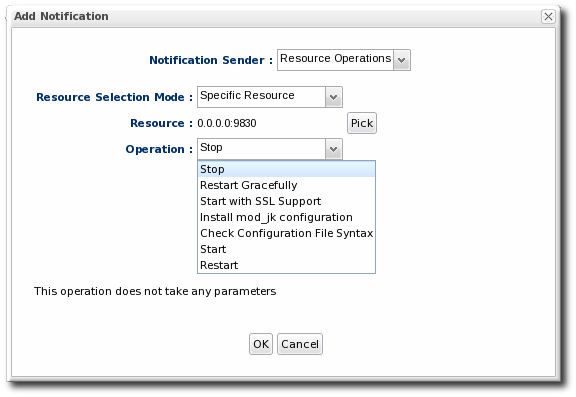
Figure 31. Operation Settings
13.3. Detailed Discussion: Initiating Resource Scripts
Note
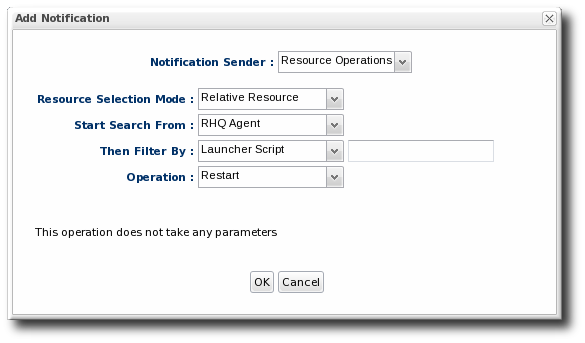
Figure 32. Resource Script Settings
Important
13.4. Detailed Discussion: Launching JBoss ON CLI Scripts from an Alert
Note
Note
alert variable implicitly identifies the alert definition and specific alert instance which has been fired. This allows you to create a proxy resource definition in the script that could be applied to any resource which uses that alert script.
var myResource = ProxyFactory.getResource(alert.alertDefinition.resource.id)
Example 1. Writing Alert-Relevant CLI Scripts
var myResource = ProxyFactory.getResource(alert.alertDefinition.resource.id)

var definitionCriteria = new MeasurementDefinitionCriteria()
definitionCriteria.addFilterDisplayName('Sessions created per Minute')
definitionCriteria.addFilterResourceTypeId(myResource.resourceType.id)

var definitions = MeasumentDefinitionManager.findMeasurementDefinitionsByCriteria(definitionCriteria)

if (definitions.empty) {
   throw new java.lang.Exception("Could not get 'Sessions created per Minute' metric on resource "
      + myResource.id)
}

var definition = definitions.get(0)

var startDate = new Date() - 8 * 3600 * 1000 //8 hrs in milliseconds
var endDate = new Date()

var data = MeasurementDataManager.findDataForResource(myResource.id, [ definition.id ], startDate, endDate, 60)

exporter.setTarget('csv', '/the/output/folder/for/my/metrics/' + endDate + '.csv')

exporter.write(data.get(0))

var dataSource = ProxyFactory.getResource(10411)

connectionTest = dataSource.testConnection()

if (connectionTest == null || connectionTest.get('result').booleanValue == false) {
    //ok, this means we had problems connecting to the database
    //let's suppose there's an executable bash script somewhere on the server that
    //the admins use to restart the database
    java.lang.Runtime.getRuntime().exec('/somewhere/on/the/server/restart-database.sh')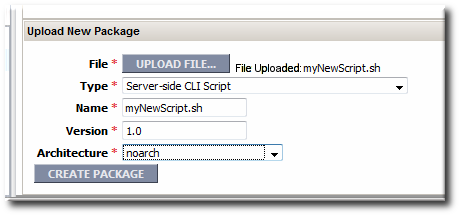
}/alert-scripts/.
- Upload the script to a content repository.
Note
Create a separate repository for alert CLI scripts. - Search for the resource, and configure the basic alert definition, as in Section 11.2, “Basic Procedure for Setting Alerts for a Resource”.
- In the Notifications tab for the alert definition, give the notification method a name, and select the CLI Script method from the drop-down menu.
- First, select the JBoss ON user as whom to run the script. The default is as the user who is creating the notification.

- Select the repository which contains the CLI script. If you are uploading a new script, this is the repository to which the script will be added.
- Select the CLI script to use from the drop-down menu, which lists all of the scripts in the specified repository. Alternatively, click the button to browse to a script on the local machine.
- Click to save the notification. The line in the Notifications tab shows the script, the repository, and the user as whom it will run.

13.5. Configuring SNMP for Notifications
- Configuring the SNMP alert plug-in for the server.
- Configuring the actual alert with an SNMP notification.
13.5.1. JBoss ON SNMP Information
/etc/RHQ-mib.txt. The default configuration for the MIB is shown in Example 2, “Default Alert Object in JBoss ON MIB”. The base OID for the JBoss ON alert is 1.3.6.1.4.1.18016.2.1 (org.dod.internet.private.enterprise.jboss.rhq.alert).
Example 2. Default Alert Object in JBoss ON MIB
alertGroup OBJECT-GROUP
    OBJECTS {   alertName,
                alertResourceName,
                alertPlatformName,
                alertCondition,
                alertSeverity,
                alertUrl }
    STATUS  current
DESCRIPTION "A collection of objects providing information about an alert"13.5.2. Configuring the SNMP Alert Plug-in
- In the top menu, select the Administration tab.
- In the System Configuration menu, select the ServerPlugins item.

- Click the name of the SNMP plug-in in the list.
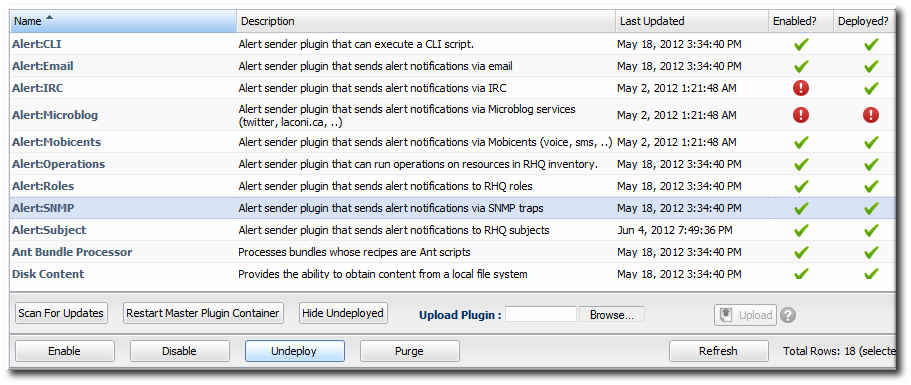
- In the plug-in details page, expand the Plugin Configuration section.

- All SNMP versions require information about the JBoss ON MIB OID and selected version. Fill in the appropriate values.
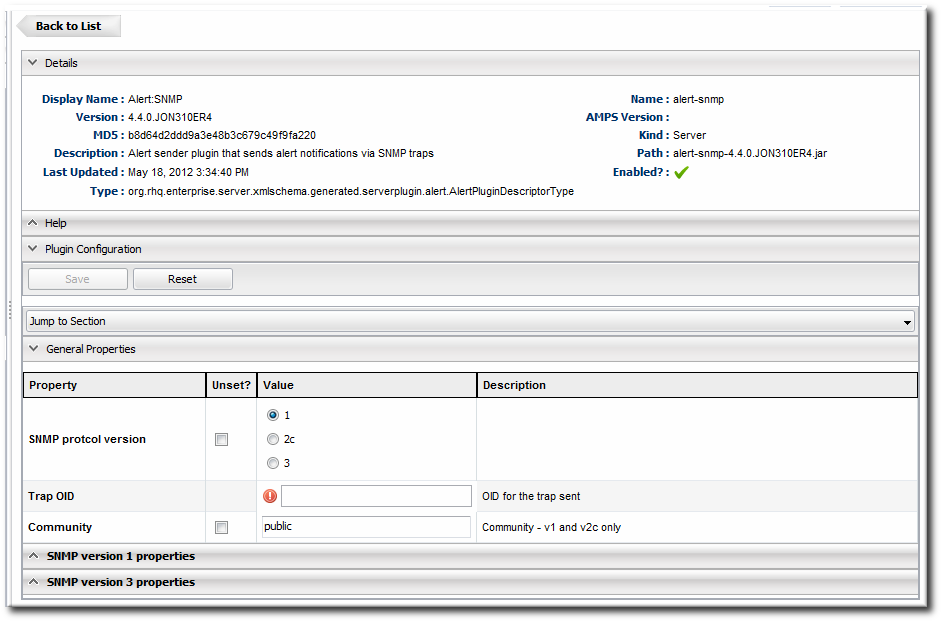
- SNMP version 1 and version 3 both require additional configuration. Expand the version-specific configuration section and fill in the information about the SNMP agent.
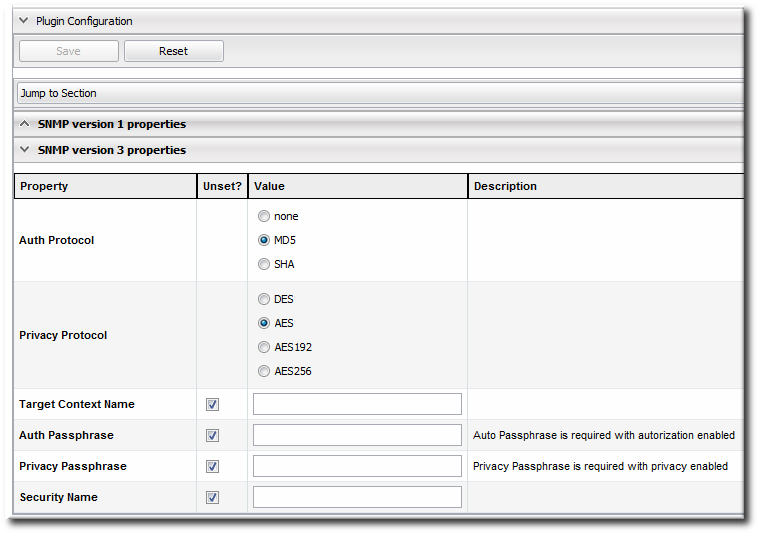 It may be necessary to unselect the Unset checkbox to allow the fields to be edited.
13.5.3. Configuring the SNMP Alert Notification
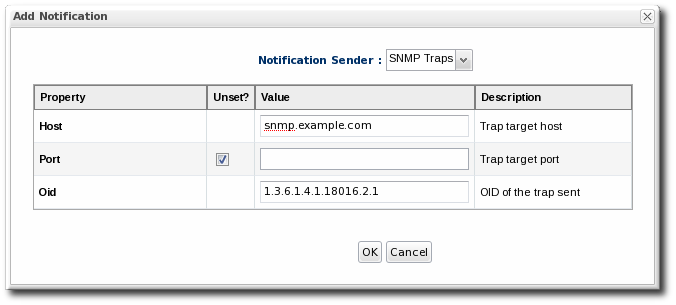
Figure 33. JBoss ON SNMP Trap Information
- The hostname for the SNMP manager.
- The port number for the SNMP manager. JBoss ON supports UDP, so this must be the UDP port.
- The JBoss ON OID. This is
1.3.6.1.4.1.18016.2.1.
14. Viewing Alert Data
14.1. Viewing the Alert Definitions Report
- Select the Reports tab in the top navigation bar.
- In the Subsystems menu box on the left, select Alert Definitions.
- The definitions report shows a list of all configured definitions, for all resources in the inventory.
 The results table provide the most basic information for the definitions:
- The resource (Name).
- The parent or ancestry. Since resources are arranged hierarchically, sorting by the parent is very useful for finding all alert definitions for all services and applications that relate to a high-level resource like a server.
- The description of the alert.
- Whether it is active (enabled).
Note
Note
alertDefinitions.csv.
14.2. Viewing Alerts
14.2.1. Viewing Alert Details for a Specific Resource
Note
- Click the Inventory tab in the top menu.
- Select the resource type in the Resources menu table on the left, and then browse or search for the resource.
- Click the resource in the list.
- Click the Alerts tab, and make sure that the History subtab is selected.
- In the list, click the timestamp or alert definition name for the fired alert.

- The alert page has tabs for each detail for the alert, including which alert definition was triggered, the conditions that triggered, and any operations that were launched as a result.

14.2.2. Viewing the Fired Alerts Report
- Select the Reports tab in the top navigation bar.
- In the Subsystems menu box on the left, select Recent Alerts.

- The resource (Name)
- The parent (ancestor)
- The name of the definition which triggered the alert
- The condition which triggered the alert
- The value of the resource at the time the alert was sent
- The date, which is very useful for correlating the alert notification to an external event
Note
Note
recentAlerts.csv.
14.2.3. Viewing Alerts in the Dashboard
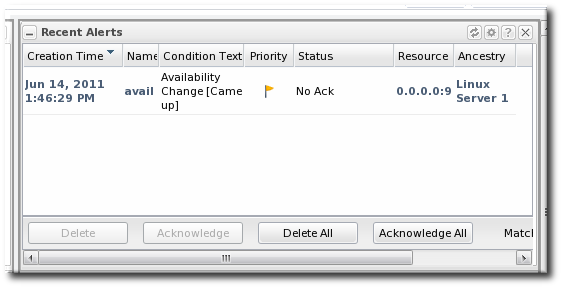
Figure 34. Recent Alerts Portlet
- A time range for when the alert was fired
- The alert priority (which is initially configured in the alert definition)
- In the top menu, click Dashboard.
- In the Recent Alerts portlet, click the gear icon to open the portlet configuration page.

- Change the display criteria as desired.
14.3. Acknowledging an Alert
- Through the Recent Alerts Report
- Through a group
- Through the resource entry
- Select the Reports tab in the top navigation bar.
- In the Subsystems menu box on the left, select Recent Alerts.
- Select the alert to acknowledge.
- Click the Acknowledge button, and, when prompted, confirm the action.

Note
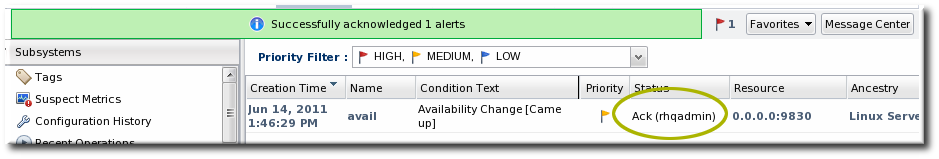
Figure 35. Alert Acknowledgment
14.4. Troubleshooting Alerts
- Q: I just created an alert definition, and I know that my agent reported data that should have fired an alert immediately. But I don't see an alert. Why not?
- Q: Why do I see alerts triggered on different metric values on different alert definition conditions when they are using the same metric?
INFO  [CacheConsistencyManagerBean] localhost took [51]ms to reload global cache
INFO  [CacheConsistencyManagerBean] localhost took [49]ms to reload cache for 1 agents
15. Operations: An Introduction
15.1. A Summary of Operation Benefits
- They allow additional parameters (depending on how the operation is defined in the plug-in), such as command arguments and environment variables.
- They validate any operation parameters, command-line arguments, or environment variables much as JBoss ON validates resource configuration changes.
- They can be run on group of resources as long as they are all of the same type.
- Operations can be ordered to run on group resources in a certain order.
- They can be run on a recurrently schedule or one specific time.
- Operations keep a history of both successes and failures, so that it is possible to audit the operations executed on a resource both for operations run for that specific resource and done on that resources as part of a group.
15.2. About Scheduling Operations
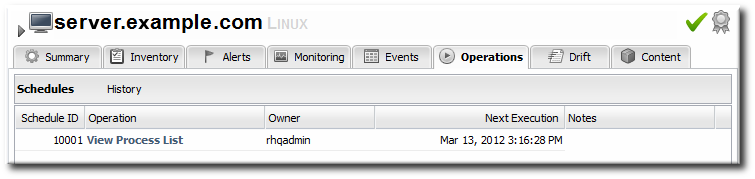
Figure 36. A Scheduled Operation
Note
16. Managing Operations: Procedures
16.1. Scheduling Operations
- Click the Inventory tab in the top menu.
- Select the resource type in the Resources menu table on the left, and then browse or search for the resource.
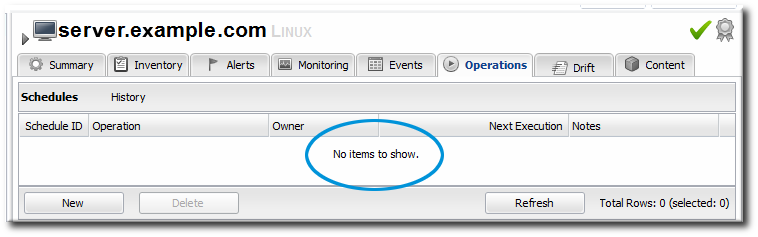
- Click the Operations tab.
- In the Schedules tab, click the New button.
 The types of operations that are available vary, depending on the specific type of resource.
Note
The Schedules tab shows a list of scheduled operations, meaning operations which are configured but have not yet been run. If there are no scheduled operations, then the tab has a description that reads No items to show. That does not mean that there are no operations available for the resource; it only means that no operations have been scheduled. - Fill in all of the required information about the operation, such as port numbers, file locations, or command arguments.
- In the Schedule area, set when to run the operation. The operation can run immediately, at a specified time, or on a repeatable schedule.

- Set other rules for the operations, like a timeout period and notes on the operation itself.
- Click the button to set up the operation.

16.2. Viewing the Operation History
Note
- Click the Inventory tab in the top menu.
- Select the resource type in the Resources menu table on the left, and then browse or search for the resource.
- Click the Operations tab.
- Click the History subtab.
 Every completed or in progress operation is listed, with an icon indicating its current status.
 - Click the name of the operation to view further details. The history details page shows the start and end times of the operation, the stdout output of the operation or other operation messages, as well as the name of the user who scheduled the operation.

16.3. Canceling Pending Operations
- Click the Inventory tab in the top menu.
- Select the resource type in the Resources menu table on the left, and then browse or search for the resource.
- Click the Operations tab.
- In the Schedules tab, click the line of the operation to cancel.
- Click Delete, and confirm the action.
Note
16.4. Ordering Group Operations
Note
- In the Inventory tab in the top menu, select the Compatible Groups item in the Groups menu on the left.
- Click the name of the group to run the operation on.
- Configure the operation, as in Section 16.1, “Scheduling Operations”.
- In the Resource Operation Order area, set the operation to execute on all resources at the same time (in parallel) or in a specified order. If the operation must occur in resources in a certain order, then all of the group members are listed in the Member Resources box, and they can be rearranged by dragging and dropping them into the desired order.Optionally, select the Halt on failure checkbox to stop the group queue for the operation if it fails on any resource.

16.5. Running Scripts as Operations for JBoss Servers
.batfor Windows.shfor Unix and Linux.plscripts for Unix and Linux
Note
- Click the Inventory tab in the top menu.
- Select the resource type in the Resources menu table on the left, and then browse or search for the resource.
- Click the Operations tab.
- In the Schedules tab, click the New button.
- Select Execute script as the operation type from the Operation drop-down menu.

Note
The Execute script option is only available for JBoss AS and JBoss AS 5 resources, by default, and only if a script is available to execute. - Enter any command-line arguments in the Parameters text box.Each new argument has the format name=value; and is added on a new line. If the variable's value contains properties with the syntax
%propertyName%, then JBoss ON interprets the value as the current values of the corresponding properties from the script's parent resource's connection properties. - Finish configuring the operation, as in Section 16.1, “Scheduling Operations”.
16.6. Setting an Operation Timeout Default
Note
- Open the
rhq-server.propertiesfile.vim serverRoot/jon-server-3.1.2.GA1/bin/rhq-server.properties
- Change or add the value of the
rhq.server.operation-timeoutparameter to the amount of time, in seconds, for the server to wait before an operation times out.rhq.server.operation-timeout=60
16.7. Operation History Report
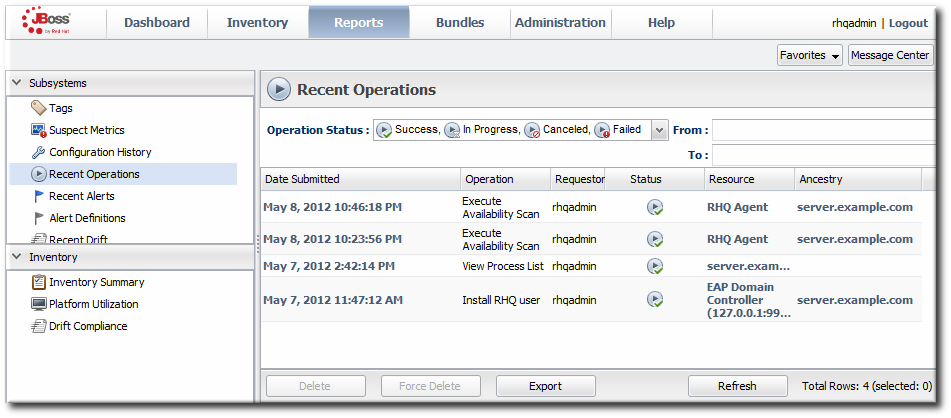
Figure 37. Operation History Report
Note
configurationHistory.csv.
Index
A
- alerts
- acknowledging, Acknowledging an Alert
- assigning operations, Detailed Discussion: Initiating an Operation
- available operation tokens, Using Tokens with Alert Operations
- conditions, Reasons for Firing an Alert
- configuring, Planning Alerts
- configuring and managing, Alert Conditions, Alert Responses
- configuring for groups, Configuring Group Alerts
- creating definition templates, Creating Alert Definition Templates
- definitions report, Viewing the Alert Definitions Report
- enabling and disabling definitions, Enabling and Disabling Alert Definitions
- fired alerts report, Viewing the Fired Alerts Report
- groups and templates, Group Alerting and Alert Templates
- histories and acknowledgments, Viewing Alert Data
- initiating CLI scripts, Detailed Discussion: Launching JBoss ON CLI Scripts from an Alert
- initiating resource scripts, Detailed Discussion: Initiating Resource Scripts
- notification methods, Notifying Administrators and Responding to Alerts
- operations, Detailed Discussion: Initiating an Operation, Setting Alert Operations
- setting, Basic Procedure for Setting Alerts for a Resource
- setting dashboard display, Viewing Alerts in the Dashboard
- SNMP, Configuring SNMP for Notifications, Configuring the SNMP Alert Plug-in
- SNMP notifications, Configuring the SNMP Alert Notification
- tokens and operations, Using Tokens with Alert Operations
- using templates and group alerts, Group Alerting and Alert Templates
- viewing, Viewing Alerts
- viewing alerts for specific resource, Viewing Alert Details for a Specific Resource
- Apache
- configuring the SNMP module, Configuring the Apache SNMP Module
- auto discovery
- availability, Availability
- charts, Viewing a Resource's Availability Charts
- troubleshooting, Core "Up and Down" Monitoring
- uptime percentage, Core "Up and Down" Monitoring
B
- baselines
- recalculating, Recalculating Baseline Values
C
- call-time data, URL Response Time Monitoring
- CLI
- running for alerts, Detailed Discussion: Launching JBoss ON CLI Scripts from an Alert
- configuration
- alerts, Alert Conditions, Alert Responses
- Apache SNMP module, Configuring the Apache SNMP Module
- response time filters for Tomcat, Configuring Response Time Filters for Tomcat
D
- dashboard
- alerts settings, Viewing Alerts in the Dashboard
- data storage
- monitoring, Storing Monitoring Data
E
- events
- defining new events, Defining a New Event
- overview, Events
- viewing, Viewing Events
G
- groups
- alerts and templates, Group Alerting and Alert Templates
- configuring alerts, Configuring Group Alerts
J
- JBoss EAP 6/AS 7
- configuring response time metrics, Configuring Response Time Metrics for JBoss EAP 6/AS 7
- JBoss EAP/AS 5
- configuring response time metrics, Configuring Response Time Metrics for JBoss EAP/AS 5
- JBoss ON
- and SNMP, JBoss ON SNMP Information
M
- metrics, Metrics and Measurements
- baselines, Baselines and Out-of-Bounds Metrics
- monitoring
- call-time data, URL Response Time Monitoring
- changing defaults, Changing Metrics Templates
- changing the resource availability scan period, Changing the Agent's Availability Scan Period
- collection schedules, Collection Schedules
- configuring response time filters for JBoss EAP 6/AS 7 servers, Configuring Response Time Metrics for JBoss EAP 6/AS 7
- configuring response time filters for JBoss EAP/AS 5 servers, Configuring Response Time Metrics for JBoss EAP/AS 5
- configuring Tomcat, Configuring Tomcat/EWS Servers for Monitoring
- enabling and disabling metrics, Enabling and Disabling Metrics for a Specific Resource
- operations, Reports and Data
- out of bounds (OOB), Baselines and Out-of-Bounds Metrics
- problem metrics, Baselines and Out-of-Bounds Metrics
- recalculating baselines, Recalculating Baseline Values
- resources with special configuration, Resources Which Require Special Configuration for Monitoring
- response time filters, URL Response Time Monitoring
- setting collection intervals, Setting Collection Intervals for a Specific Resource
- storage limits for data, Storing Monitoring Data
- traits, Resource Traits
N
- notifications
- SNMP and alerts, Configuring the SNMP Alert Notification
O
- operations, Operations: An Introduction
- alerts, Detailed Discussion: Initiating an Operation
- alerts and tokens, Using Tokens with Alert Operations
- canceling, Canceling Pending Operations
- executing scripts, Running Scripts as Operations for JBoss Servers
- ordering group, Ordering Group Operations
- scheduling, About Scheduling Operations, Scheduling Operations
- scripts, Running Scripts as Operations for JBoss Servers
- setting alert operations, Setting Alert Operations
- timeout defaults, Setting an Operation Timeout Default
- timeouts, About Scheduling Operations
- viewing history, Viewing the Operation History
R
- reports
- alert definitions, Viewing the Alert Definitions Report
- resources
- enabling and disabling metric collection, Enabling and Disabling Metrics for a Specific Resource
- monitoring, Reports and Data
- monitoring and recalculating baselines, Recalculating Baseline Values
- monitoring collection intervals, Setting Collection Intervals for a Specific Resource
- setting alerts, Basic Procedure for Setting Alerts for a Resource
- viewing alerts for specific resources, Viewing Alert Details for a Specific Resource
- response time filters
- configuring JBoss EAP 6/AS 7, Configuring Response Time Metrics for JBoss EAP 6/AS 7
- configuring JBoss EAP/AS 5, Configuring Response Time Metrics for JBoss EAP/AS 5
- configuring Tomcat, Configuring Response Time Filters for Tomcat
- response-time filters, URL Response Time Monitoring
S
- scripts
- as operations, Running Scripts as Operations for JBoss Servers
- from alerts, Detailed Discussion: Initiating Resource Scripts
- initiating from alerts
- SNMP
- alert notification, Configuring the SNMP Alert Notification
- and JBoss ON, JBoss ON SNMP Information
- configuring alerts, Configuring the SNMP Alert Plug-in
- configuring for alerts, Configuring SNMP for Notifications
- configuring the Apache module, Configuring the Apache SNMP Module
T
- tokens
- alerts and operations, Using Tokens with Alert Operations
- Tomcat
- configuring response time filters, Configuring Response Time Filters for Tomcat
- monitoring configuration, Configuring Tomcat/EWS Servers for Monitoring
- traits, Resource Traits
U
- uptime percentage, Core "Up and Down" Monitoring