
Red Hat Training
A Red Hat training course is available for Red Hat JBoss Operations Network
Setting up Monitoring, Alerts, and Operations
JBoss Operations Network 3.0.1
for monitoring resources and responding to incidents
December 7, 2011, updated March 18, 2012
Abstract
The primary function of JBoss Operations Network is monitoring the status of your resources. The core of monitoring includes critical availability monitoring, collecting metrics on platform and server performance, and tracking events. JBoss ON also provides a way to define alerts and then notify administrators whenever a resource is performing poorly.
This guide provides GUI-based procedures to view monitoring information, to track events, to define alerts and notifications, and to initiate operations.
1. Summary: Monitoring and Responding to Resource Activity
One of the core functions of JBoss Operations Network is that it lets administrators stay aware of the state of their JBoss servers, platforms, and overall IT environment.
The current state of individual servers and applications provides critical information to IT staff about traffic and usage, equipment failures, and server performance. JBoss Operations Network can supply a clearer picture of these critical data by automatically monitoring resources in its inventory.
JBoss ON builds on historical monitoring data by establishing trends, baselines, and maximum and minimum boundaries for each individual resource. JBoss ON handles two different types of monitoring data:
- Metrics, which are regularly-scheduled polls of the current values of different logging or performance areas.
- Events, which are actions or situations on a resource which happen randomly (such as shutting down) and are reported immediately when they occur.
Once there is a clear and running method to identify the current state of the infrastructure, then it is possible to react to changing states. JBoss ON has an alert framework which can take two actions based on monitoring and event data:
- Notifications which warn and inform administrators of unexpected or undesirable changes in the IT environment.
- Resource actions which take automatic, specific action. This can be launching a JBoss ON CLI script to deploy an application bundle or new configuration, a resource script to act on the local system, a resource operation, or other action.
The most powerful aspect of management is the ability to know, accurately, where your resources are and to respond to that ever-changing situation reliably.
2. Monitoring Resources: An Introduction
Metric data is the information JBoss ON collects from individual platforms, servers, and services. The data JBoss ON collects depend on what type of server or service is being monitored. For example, Linux platforms can be monitored for free memory, system load, used memory, and used swap space, among other metrics.
2.1. About Metrics
JBoss ON supports three different kinds of metrics:
- Numeric metrics. Numerical values such as milliseconds passed, kilobytes transferred or rows in a database table
- Traits. Descriptive information about a resource.
- Response times. The time it takes for a resource to respond to a request.
Note
Supported resources are defined in JBoss ON through agent plug-ins. This means that it is possible to write custom plug-ins to add resource types and to determine which metrics should be collected and how the agent should process the collected data.
When defining metrics in the plug-in descriptor values that form part of a larger data structure, such as an array of values, need to be deconstructed into individual values before they can be monitored.
Metrics are collected from the managed resources at regular intervals, with the interval defined in the resource type's plug-in descriptor. The intervals can be changed for all metrics of that type or for a single resource.
2.2. About Baseline Metrics
After metrics have been collected for a reliable amount of time, JBoss ON automatically calculates a baseline for the metric, which represents the norm for that metric on that resource. Once every hour, a job is run that compresses these metric values into one hour aggregates. These aggregates contain the minimum, maximum, and average value of the measured data.
When there is sufficient data in the system, baselines are computed for metrics that are not increasing or decreasing.
The expected mean and high and low range values can be charted as part of viewing the monitoring history for a resource.
Baseline metrics compare changes in actual data against a baseline value. Baselines allow effective trending analysis, SLAs management, and overall application health assessments as a form of fault management.
Alerts (Section 6, “Configuring and Managing Alerts: Procedures”) can be defined that refer to baselines or expected values.
Along with baselines, JBoss ON automatically tracks metric values collected that fall outside (out-of-bounds) of the high and low ranges and baselines. Out-of-bounds metrics are reported as problem metrics.
Note
If there are no baselines present, because they have not yet been computed or because the metric is a trends-up or trends-down metric, no out-of-bounds factors will be calculated.
Note
When an alert is triggered in response to a metric value, the alerting event is tracked as a problem metric.
A baseline has a bandwidth that is the difference between its minimum and maximum values. The out-of-bounds job checks for the aggregate if the low or high value lies outside the band and is computing the difference.
To be able to compare out-of-bound values, an out-of-bounds-factor is computed by dividing the difference by the bandwidth.
Note
Calculating baselines can sometimes output non-intuitive results, as a band of (1,2) and an outlier value of 3 seems to be less than a band of (100, 200 MB) and an outlier value of 250 MB. The former is actually 100% outside the expected band, while the latter is only 50% outside.
Figure 1, “Out-of-Bound Factors” shows a simplified baseline and out-of-bounds chart.
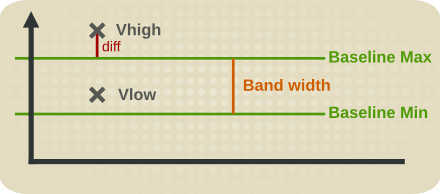
Figure 1. Out-of-Bound Factors
Out-of-bounds-factors are recalculated each hour during a calculation job. The job assesses the aggregate and determines if there is a more severe outlier than before. The chart always displays the most sever outlier.
When the baselines for a metric change, all recorded out-of-bounds values become invalid and are removed because the out-of-bounds measurement was computed against an old baseline.
Out-of-bound factors are also cleaned out for a metric if the chart page of a metric is edited when the baseline settings are changed. The out-of-bounds factors are recalculated on the next hourly run of the computation job.
2.3. Storing Metric Data
Metric data is stored in the JBoss ON backend database. Numerical data is compressed and purged at regular intervals.
Detailed data is compressed into tables for 1, 6 and 24 hour values. For each interval the minimum, maximum and average values are kept. Data are stored for up to one year by default, but alternative time frames can be defined.
3. Monitoring Resources: Procedures
3.1. Viewing Monitoring Information
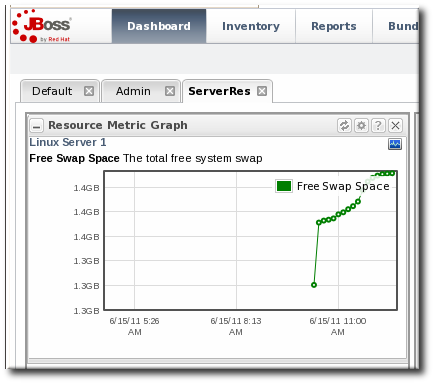
Every resource has a Monitoring tab which displays different charts, each displaying different information collected about the resource.
3.1.1. Metrics and Baseline Charts
The core of monitoring is the metric information that is collected for a resource. Each resource has different metrics (and these are listed in the Resource Reference: Monitoring, Operation, and Configuration Options). Three monitoring charts show the same information, but in different perspectives and different levels of detail:
- The resource-level Summary
- Graphs
- Tables
The Summary tab for resources, much like the Dashboard for the entire JBoss ON inventory, has portlets that show different resource information. Most resources have three portlets for measurements, events, and out-of-bound metrics. The Measurements portlet has small thumbnail charts that show the trend for the metric, along with the current reading.

Clicking any of the metrics will open the baseline chart for that metric. As is described in Section 2.2, “About Baseline Metrics”, baselines calculate an average reading for a given period of time, with the high and low measurements in that period creating upper and lower bounds. Baselines, by default, are calculated every three days using the data from the previous seven days for the calculation. Baseline measurements are essential for establishing operating norms so that administrators can effectively set alerts for resources.

The Graphs area in the Monitoring tab shows all of the metrics on line graphs, giving the trend for the past eight hours, and the time span is dynamically configurable. This provides more granular detail than the summary or baselines charts, showing the readings for each collection period and the precise readings.

The Tables chart has the same information as the metrics graphs, only it is displayed in text, with columns for the high, low, and current readings. There is also a column which shows the number of active alerts for each metric.

3.1.2. Trait Charts
The Traits tab simply shows a list of traits and values that have been detected for the resource. Traits are static, usually information like the software version number, the installation date, or the architecture or hardware settings. The traits that are collected are defined in the resource plug-in itself, so this information is viewable but not configurable through the UI. The list of traits for each resource type is covered in the Resource Reference: Monitoring, Operation, and Configuration Options.
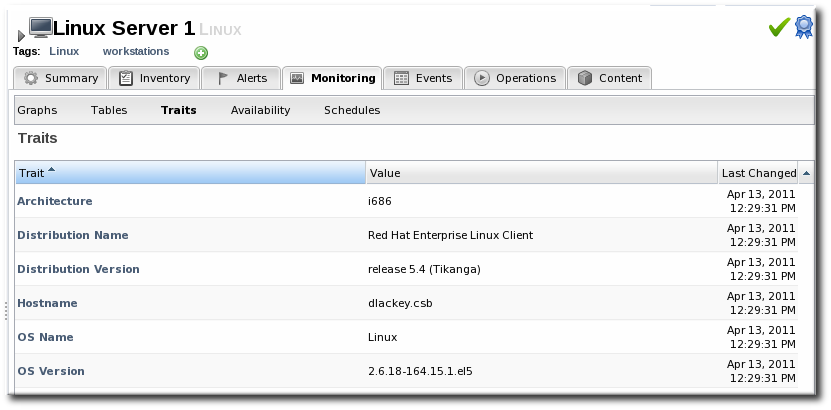
Figure 2. Trait Charts
3.1.3. Availability Charts
The Availability chart for a resource simply shows when that resource goes up and down. This includes timestamps of whenever the availability changes and total counts of how much time the resource spends in the up and down states.
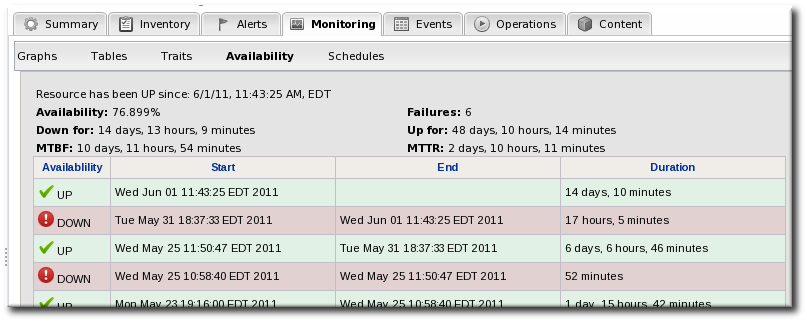
Figure 3. Availability Charts
3.1.4. Summary Timeline
The Timeline subtab in the Summary tab shows a line chart of all of the activity for the resource (with the exception of metrics collection, which is all under the Monitoring tab and charts). The Timeline aggregates all configuration changes, inventory changes, drift, events, content and bundle changes, operations, and alerts. Clicking any given point opens up the details for that specific action.
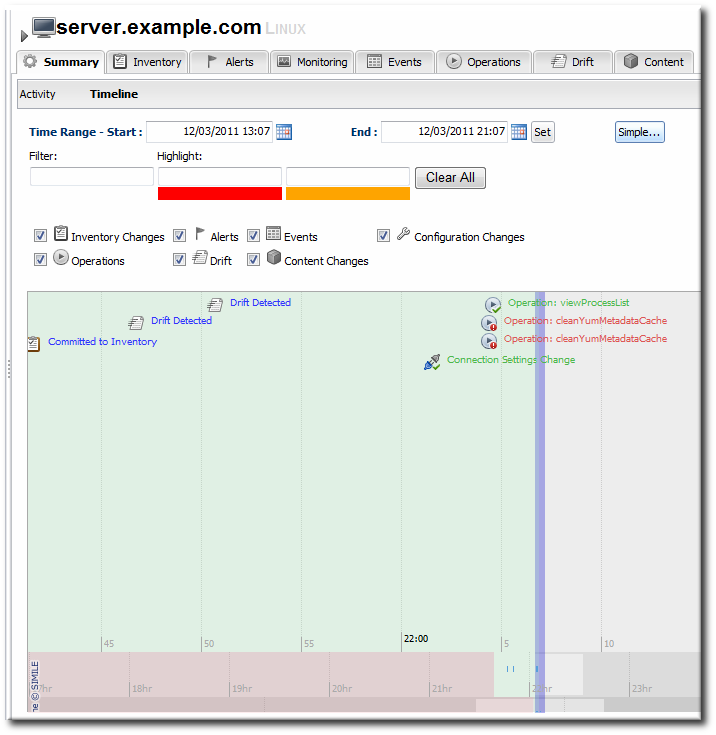
Figure 4. Summary Timeline
Because all information is on a single timeline, it becomes must easier to correlate incidents and events and to get a better understanding of the overall activity on that resource.
3.2. Adding Monitoring Metrics to the Dashboard
Charts for a specific metric for a resource can be added to the Dashboard. This makes it easier to see the current state of important readings for common or critical resources immediately, without having to configure alerts or check resource entries.
- Click the Inventory tab in the top menu.
- Select the resource type in the Resources menu table on the left, and then browse or search for the resource.

- In the resource hierarchy on the left, right-click the resource name.
- Scroll down to the menu item, select the metric from the list, and then select the dashboard to add the chart to.

A chart for that specific metric on that specific resource is automatically added to the Dashboard that was selected.
3.3. Configuring Monitoring Settings
3.3.1. Setting Baseline Calculation Properties
The monitoring baselines have two configuration properties that define how the automatic metric baselines are calculated. These properties don't set the value; they set the window of time used for the baseline averages.
- In the System Configuration menu, select the item.

- Scroll to the Automatic Baseline Configuration Properties section.
- Change the settings to define the window used for calculation.

- Baseline Frequency sets the interval, in days, for how often baselines are recalculated. The default is three days.
- Baseline Dataset sets the time interval, in days, used to calculate the baseline. The default is seven days.
3.3.2. Recalculating Baseline Values
Baselines measure the average operating value of metrics. JBoss ON also collects the highest and lowest recorded readings to set a normal operating range. Comparing live metrics with pre-calculated baselines makes it possible to detect when resources are running outside of expected ranges. JBoss ON automatically calculates baselines; however, they can be recalculated for specific time periods or simply if the load has changed and new baselines are required.
- Click the Inventory tab in the top menu.
- Select the resource type in the Resources menu table on the left, and then browse or search for the resource.
- In the summary tab, click the name of the metric to recalculate.
- Scroll to the bottom of the baseline chart, to the Metric Baseline & Expected Range area.
- Click the Change Value link next to the baseline figure.

- A new baseline is calculated using the baseline dataset property from the configuration properties, starting from the current time. Accept the new baseline value by clicking Save Value.

3.3.3. Setting Collection Intervals for a Specific Resource
Metrics are collected at the intervals specified by the collection schedule. Because not all metrics are mission critical or even likely to change, JBoss ON has different collection schedules for different metrics, with critical metrics collected more frequently.
For most environments, setting a daily collection schedule (once every 24 hours) is sufficient.
To change the collection interval for a specific metric:
- Click the Inventory tab in the top menu.
- Select the resource type in the Resources menu table on the left, and then browse or search for the resource.
- Click the Monitoring tab on the resource entry.
- Click the Schedules subtab.
- Select the the metric for which to change the monitoring frequency. Multiple metrics can be selected, if they will all be changed to the same frequency.

- Enter the desired collection period in the Collection Interval field, with the appropriate time unit (seconds, minutes, or hours).
- Click Set.
3.3.4. Enabling and Disabling Metrics for a Specific Resource
- Click the Inventory tab in the top menu.
- Select the resource type in the Resources menu table on the left, and then browse or search for the resource.
- Click the Monitoring tab on the resource entry.
- Click the Schedules sub tab.
- Select the metrics to enable or disable.

- Click the Enable or Disable button.
3.3.5. Changing Monitoring Default Templates
The metrics which are collected for a resource type are defined in the monitoring template for the resource type. Each resource type has some metrics disabled by default, and these must be manually enabled. Likewise, metrics which are enabled by default can be disabled.
- In the top navigation, open the Administration menu, and then the System Configuration menu.

- Select the Metric Collection Templates menu item. This opens a long list of resource types, both for platforms and server types.
- Locate the type of resource for which to create the template definition.

- Click the pencil icon to edit the metric collection schedule templates.
- Select the required metrics to enable or disable, and click the or button.
- To edit the frequency that a metric is collected, select the Update schedules for existing resources of marked type checkbox, and then enter the desired time frame into the Collection Interval for Selected: field.

3.3.6. Changing the Resource Availability Scan Period
JBoss ON periodically checks each resource's availability, which simply means whether the resource is available and running. After this scan by the agent, it sends the result to the server.
Note
The default scan interval is five minutes (300 seconds).
Since availability is processed on the server, large environments with hundreds of agents and tens of thousands of resources can stress the server and hurt performance. In that case, the default scan interval may be too short, and setting a longer scan interval will improve server performance. For smaller environments, this scan period can be too long.
The interval is configurable in the agent settings file.
- Open the agent configuration file.
vim agentRoot/rhq-agent/conf/agent-configuration.xml
- Uncomment the lines in the XML file, and set the new scan time (in seconds). Do not enter a value lower than 60 seconds or the load on the agent, server, and resource will be too high and will hurt performance.
<entry key="rhq.agent.plugins.availability-scan.period-secs" value="120"/>
- Restart the agent to load the new value. Use the
--cleanconfigoption to force the agent to read the new configuration from the configuration file.
3.4. Resources Which Require Special Configuration for Monitoring
Some resources have to have specific configuration to be detected by JBoss ON discovery or to allow JBoss ON enough access to perform the full range of management.
3.4.1. Configuring Tomcat/EWS Servers for Monitoring
For instructions on setting up Tomcat or Red Hat JBoss Web Server (JWS) for monitoring with JBoss Operations Network, see the JBoss Web Server Installation Guide chapter on Monitoring Red Hat JBoss Web Server with JBoss ON
Note
For more information on configuring Tomcat, see the Tomcat documentation.
3.4.2. Configuring the Apache SNMP Module
To discover an Apache server's virtual hosts and collect metrics for them, the SNMP module must be configured on that Apache server.
Apache 2.0 and 2.2 are supported on Red Hat Enterprise Linux. Only Apache 2.0 is supported on Windows.
Important
To use the Response Time module, the Apache server needs to have been compiled with shared object support. For Red Hat Enterprise Linux systems and EWS servers, this is enabled by default.
To verify that the Apache server was compiled with shared object support, use the
apachectl -l command to list the compiled modules and look for the mod_so.c module:
[root@server ~]# apachectl -l
Compiled in modules:
  core.c
  prefork.c
  http_core.c
  mod_so.c
When compiling Apache from source, on 2.0.x versions, use the
--enable-so option:
$ ./configure --enable-so
$ make install
For Apache 2.2.x versions, use the
--enable-module=so option:
$ ./configure --enable-module=so
$ make install
- Download the Apache binaries from the JBoss ON UI.
- Log into the JBoss ON UI.
https://server.example.com:7080
- Click the Administration tab in the top menu.
- In the Configuration menu box on the left, select the item.
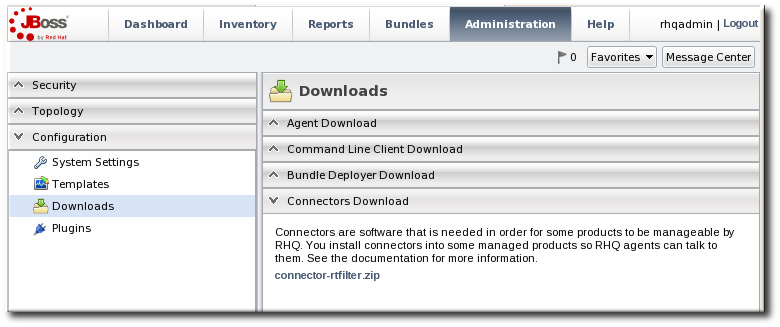
- Scroll to Connector Downloads, and click the
connector-apache.ziplink to download the Apache connectors.
- Unzip the Apache connectors in a directory that is accessible to the JBoss ON agent.
unzip connector-apache.zip
- Each Apache version and platform has its own package that contains the Apache-SNMP connectors. Unzip the Apache connectors in a directory that is accessible to the JBoss ON agent. Binaries are available for Red Hat Enterprise Linux 32-bit and 64-bit and Windows.For example, on Red Hat Enterprise Linux 32-bit:
cd apacheModuleRoot/apache-snmp/binaries/
tar xjvf snmp_module-x86-linux-apache#.tar.bz2
# is the Apache server version number.Note
Apache connectors can be compiled for other platforms, like Solaris, from the source files inapacheRoot/apache-snmp/binaries/sources. For example:cd JON_AGENT_INSTALL_DIR/product_connectors/apache-snmp/sources ./build_apache_snmp.sh APACHE_VERSION APACHE_2.x_INSTALL_DIR/bin/apxs
(To compile the Apache-SNMP connector,apxs,perl,make, andautomakemust all be installed and in userPATH.) - Install the module.For example, on Red Hat Enterprise Linux:
# cd apacheModuleRoot/apache-snmp/binaries/snmp_module_#

# cp module/* apache_install_directory/modules

# cp conf/* apache_install_directory/conf

# mkdir apache_install_directory/var
On Windows:> xcopy /e JON_AGENT_INSTALL_DIR\product_connectors\apache-snmp\binaries\x86-winnt-apache2.0\* APACHE_2.0_INSTALL_DIR
- Open the
httpd.conffile for editing. For example, on Red Hat Enterprise Linux:vim apache_install_directory/conf/httpd.conf
- Enable the module by adding these lines to the
httpd.confon both Red Hat Enterprise Linux and Windows:LoadModule snmpcommon_module modules/snmpcommon.so LoadModule snmpagt_module modules/snmpmonagt.so SNMPConf conf SNMPVar var
- Make sure the main Apache configuration section, as well as each
<VirtualHost>configuration block, contains aServerNamedirective with a port. The SNMP module uses this directive to uniquely identify the main server and each virtual host, so eachServerNamedirective must contain a unique value. For example:ServerName main.example.com:80 ... <VirtualHost vhost1.example.com:80> ServerName vhost1.example.com:80 ... </VirtualHost>
- If there is more than one Apache instance on the same machine, it is possible to use different SNMP files for each instance.
- Each Apache instance has its own
httpd.conffile. Set theSNMPConfdirectory in each file to its own SNMP configuration directory. For example, for instance1:vim instance1-httpd.conf SNMPConf /opt/apache-instance1/conf
Then, for instance2:vim instance2-httpd.conf SNMPConf /opt/apache-instance2/conf
Eachsnmpd.conffile should be in the specified directory. - Edit the
agentaddressproperty in apache_install_directory/conf/snmpd.confso that each instance has a different value agent address and port, so there is no conflict between instances.See the snmpd.conf documentation for a description of this property's syntax.
- Restart the Apache server. For example:
apache_installation_dir/bin/Apache -k restart
- Verify that the SNMP module was properly installed. If the module is loaded, then there will be lines referencing the SNMP module in the errors log:
grep SNMP apache_installation_dir/logs/error_log

[Wed Mar 19 09:54:34 2008] [notice] Apache/2.0.63 (Unix) CovalentSNMP/2.3.0 configured -- resuming normal operations
[Wed Mar 19 09:54:35 2008] [notice] SNMP: CovalentSNMP/2.3.0 started (user '1000' - SNMP address '1610' - pid '26738')
3.4.3. Metrics Collection Considerations with Apache and SNMP
Three metrics show values of zero when monitoring an Apache instance with the SNMP module:
- Bytes received for GET requests per minute
- Bytes received for POST requests per minute
- Total number of bytes received per minute
This is because of how SNMP interprets information from the request body. First, SNMP provides various length values for the request body and a GET request does not have a body, so GET responses are not calculated and, therefore, have a value of zero. Second, Apache does not calculate a request body size if there is request chunking.
3.5. Configuring Response Time Filters for Monitoring Web Servers
JBoss Operations Network supplies an extra, optional monitoring setting called response time filters which measures the performance of web servers by measuring the amount of time it takes for a URL to respond to a request. JBoss ON supports monitoring for Apache web servers and Tomcat servers (both standalone and embedded in applications like JBoss AS).
3.5.1. Configuring Apache Servers for Response Time Metrics
- To use the Response Time module, the Apache server needs to have been compiled with shared object support. For Red Hat Enterprise Linux systems and EWS servers, this is enabled by default.To verify that the Apache server was compiled with shared object support, use the
apachectl -lcommand to list the compiled modules and look for themod_so.cmodule:[root@server ~]# apachectl -l Compiled in modules: core.c prefork.c http_core.c mod_so.c
When compiling Apache from source, on 2.0.x versions, use the--enable-sooption:$ ./configure --enable-so $ make install
For Apache 2.2.x versions, use the--enable-module=sooption:$ ./configure --enable-module=so $ make install
- Download the Apache binaries from the JBoss ON UI.
- Log into the JBoss ON UI.
https://server.example.com:7080
- Click the Administration tab in the top menu.
- In the Configuration menu box on the left, select the item.
- Unzip the Apache connectors.
unzip connector-apache.zip
- Compile the Response Time module.
Note
apxsmust be installed, andmakemust be installed and in the user PATH.cd apacheMOduleRoot/apache-rt/sources chmod +x build_apache_module.sh ./build_apache_module.sh 2.x apache_install_directory/bin/apxs
- Then, install the Response Time module on the Apache server. On Red Hat Enterprise Linux:
cp apache2.x/.libs/mod_rt.so apache_install_directory/modules
For Solaris:cp apache2.x/.libs/mod_rt.so APACHE_2.x_INSTALL_DIR/modules
For Windows:xcopy /e JON_AGENT_INSTALL_DIR\product_connectors\apache-rt\binaries \x86-winnt-apache2.0\* apache_install_directory
- Open the
httpd.conffile. For example, on Red Hat Enterprise Linux:vim apache_install_directory/conf/httpd.conf
- Enable the module in the Apache's
httpd.conffile by appending this line to the end of the file:LoadModule rt_module modules/mod_rt.so LogFormat "%S" rt_log
When setting the log format, the variable%Shas a capital S. - To configure response time logging for the main Apache server, add the following line at the top level of the file:
CustomLog logs/myhost.com80_rt.log rt_log
To configure response time logging for a virtual host, add the following line somewhere within the<VirtualHost>block:CustomLog logs/myhost.com8080_rt.log rt_log
Make sure the response time log file name is different for the main server and each virtual host. Consider using the the host and port from theServerNamedirective be used to form the file name, such as host_port_rt.log. - Restart the Apache server:
apache_install_directory/bin/apachectl restart
- To confirm that the Response Time module was installed successfully, check that the response time log files configured via the CustomLog directive now exist.
- Restart the Apache server.
3.5.2. Configuring Response Time Filters for Tomcat
- Download the Response Time packages for Tomcat from the JBoss ON UI.
- Click the Administration tab in the top menu.
- In the Configuration menu box on the left, select the item.
- Unzip the Response Time connectors.
unzip connector-rtfilter.zip
The package contains two JAR files,commons-logging-version.jarandrhq-rtfilter-version.jar. Tomcat 5 servers use only thecommons-logging-version.jarfile, while Tomcat 6 servers require both files. - Copy the appropriate JAR files into the Tomcat configuration directory. The directory location depends on the Tomcat or JBoss instance (for embedded Tomcat) being modified.For example, on a standalone Tomcat 5.5:
cp commons-logging-version.jar /var/lib/tomcat5/server/lib/
On Tomcat 6:cp rhq-rtfilter-version.jar /var/lib/tomcat6/lib/ cp commons-logging-version.jar /var/lib/tomcat6/lib/
For example, on an embedded Tomcat instance:cp rhq-rtfilter-version.jar JBoss_install_dir/server/default/deploy/jboss-web.deployer/ cp commons-logging-version.jar JBoss_install_dir/server/default/deploy/jboss-web.deployer/
- Open the
web.xmlfile to add the filter definition. The exact location of the file depends on the server instance and whether it is a standalone or embedded server; several common locations are listed in Table 1, “web.xml Configuration File Locations”. - Add either a
<filter>or a<filter-mapping>entry to configuration the Response Time filter in the Tomcat server. Either a<filter>or a<filter-mapping>entry can be used, but not both.The most basic filter definition references simply the Response Time filter name and class in the<filter>element. This loads the response time filter with all of the default settings.<filter> <filter-name>RhqRtFilter </filter-name> <filter-class>org.rhq.helpers.rtfilter.filter.RtFilter </filter-class> </filter>The filter definition can be expanded with user-defined configuration values by adding<init-paramelements. This loads the response time filter with all of the default settings.<filter> <filter-name>RhqRtFilter </filter-name> <filter-class>org.rhq.helpers.rtfilter.filter.RtFilter </filter-class> <init-param> <description>Name of vhost mapping file. This properties file must be in the Tomcat process classpath.</description> <param-name>vHostMappingFile</param-name> <param-value>vhost-mappings.properties</param-value> </init-param> ... </filter>The available parameters are listed in Table 2, “Parameters Available for User-Defined <filter> Settings”.Alternatively, set a<filter-map>entry which gives the name of the response time filter and pattern to use to match the URL which will be monitored.<filter-mapping> <filter-name>RhqRtFilter </filter-name> <url-pattern>/* </url-pattern> </filter-mapping>Note
Put the Response Time filter in front of any other configured filter so that the response time metrics will include all of the other response times, total, in the measurement. - Restart the Tomcat instance to load the new configuration.
Table 1. web.xml Configuration File Locations
| Tomcat Version | Embedded Server Type | File Location |
|---|---|---|
| Tomcat 6 | Standalone Server | /var/lib/tomcat6/webapps/project/WEB-INF/web.xml |
| Tomcat 5 | Standalone Server | /var/lib/tomcat5/webapps/project/WEB-INF/web.xml |
| Tomcat 6 | EAP 5 EAP 5.0.0 | JBOSS_HOME/server/config/deployers/jbossweb.deployer/web.xml |
| Tomcat 6 | JBoss 4.2, JBoss EAP4 | JBOSS_HOME/server/config/deploy/jboss-web.deployer/conf/web.xml |
| Tomcat 5.5 | JBoss 4.0.2 | JBOSS_HOME/server/config/deploy/jbossweb-tomcat55.sar/conf/web.xml |
| Tomcat 5.0 | JBoss 3.2.6 | JBOSS_HOME/server/config/deploy/jbossweb-tomcat50.sar/conf/web.xml |
| Tomcat 4.1 | JBoss 3.2.3 | JBOSS_HOME/server/config/deploy/jbossweb-tomcat41.sar/web.xml |
Table 2. Parameters Available for User-Defined <filter> Settings
|
Parameter
|
Description
|
|---|---|
|
chopQueryString
|
Only the URI part of a query will be logged if this parameter is set to true. Otherwise the whole query line will be logged. Default is true.
|
|
logDirectory
|
The directory where the log files will be written to. Default setting is {
jboss.server.log.dir}/rt/ (usually server/xxx/log/rt). If this property is not defined, the fallback is {java.io.tmpdir}/rt/ (/tmp/ on UNIX®, and ~/Application Data/Local Settings/Temp – check the TEMP environment variable) is used. If you specify this init parameter, no directory rt/ will be created, but the directory you have provided will be taken literally.
|
|
logFilePrefix
|
A prefix that is put in front of the log file names. Default is the empty string.
|
|
dontLogRegEx
|
A regular expression that is applied to query strings. See java.util.regex.Pattern. If the parameter is not given or an empty string, no pattern is applied.
|
|
matchOnUriOnly
|
Should the dontLogRegEx be applied to the URI part of the query (true) or to the whole query string (false). Default is true.
|
|
timeBetweenFlushesInSec
|
Log lines are buffered by default. When the given number of seconds have passed and a new request is received, the buffered lines will be flushed to disk even if the number of lines to flush after (see next point) is not yet reached.. Default value is 60 seconds (1 Minute).
|
|
flushAfterLines
|
Log lines are buffered by default. When the given number of lines have been buffered, they are flushed to disk. Default value is 10 lines.
|
|
maxLogFileSize
|
The maximum allowed size, in bytes, of the log files; if a log file exceeds this limit, the filter will truncate it; the default value is 5242880 (5 MB).
|
|
vHostMappingFile
|
This properties file must exist on the Tomcat process classpath. For example, in the ../conf/vhost-mappings.properties. The file contains mappings from the 'incoming' vhost (server name) to the vhost that should be used as the prefix in the response time log file name. If no mapping is present (no file or no entry response times are set), then the incoming vhost (server name) is used. For example:
pickeldi.users.acme.com=pickeldi
pickeldi=
%HOST%=
The first mapping states that if the incoming vhost is 'host1.users.acme.com', then the log file name should get a vhost of 'host1' as prefix, separated by a _ from the context root portion. The second mapping states that if the 'incoming' vhost is 'host1', then no prefix, and no _, should be used. The third mapping uses a special left-hand-side token, '%HOST%'. This mapping states that if the 'incoming' vhost is a representation of localhost then no prefix, and no _ , should be used.
%HOST% will match the host name, or canonical host name or IP address, as returned by the implementation of InetAddress.getLocalHost().
The second and third mappings are examples of empty right hand side, but could just as well have provided a vhost.
This is a one time replacement. There is no recursion in the form that the result of the first line would then be applied to the second one.
|
3.6. Configuring How Long Monitoring Data Are Stored
JBoss ON monitoring information reveals both current measurements and historical trends and averages. JBoss ON stores data in a kind of cascade, where raw data are aggregated and compressed on a schedule. This preserves the trends of data without inflating the size of the monitoring data. Raw monitoring data are handled like this:
- Raw metrics are collected every few minutes and are aggregated in a rolling average in one-hour windows to produce minimum, average and maximum values.
- One-hour values are combined and averaged in six-hour periods.
- Six-hour periods are combined and aggregated into 24-hour (1 day) windows.
The raw measurements, six-hour periods, and 24-hour periods are preserved in the JBoss ON database for a configurable amount of time, ranging from one week for raw measurements to one year for 24-hour aggregates.
To change the amount of time that monitoring data are stored:
- In the System Configuration menu, select the item.
- Scroll to the Data Manager Configuration Properties section.
- Change the storage times for the different types of monitoring data.
 There are four settings that relate directly to storing monitoring data:
- Response time data for web servers and EJB resources. This is kept for one month (31 days) by default.
- Events information, meaning all of the log files generated by the agent for the resource. The default storage time for event logs is two weeks.
- All measurement data, both metrics and traits. The default time is one year (365 days).
- Availability information. The default time is one year (365 days).
4. Tracking Events: Procedures
Metric data are collected according to a schedule. However, some actions occur on a resource sporadically, such as sudden system shutdowns. These are events. Since event data can be generated randomly, events are sent to agents immediately when they are detected.
Typically, JBoss ON events are used to monitor log file messages. Events can also be created from asynchronous messaging systems such as a JMX notification or a JMS messaging system.
Each time an events occurs, it is reported and triggers any associated alerts. Events can be filtered by severity (debug, info, warn, error, and fatal).
Not every resource type supports event monitoring. There are three major resources which use events:
- Windows (Windows event logs)
- Apache server (log files)
- JBoss AS server (log files)
Note
Some managed resources may have predefined events for standard log files found in the default location. These events must be enabled before they become active.
4.1. Defining a New Event
Events are only recognized by the monitoring service if events logging is properly enabled for the specific service being logged. This requires creating a log event for the log or system service, specifying a log path on the resource, and setting a date format which matches the format for the log.
- Click the Inventory tab in the top menu.
- Select the resource type in the Resources menu table on the left, and then browse or search for the resource.
- Click the Inventory tab on the resource entry.
- Select the Connection Settings subtab.
- Click green plus icon under the Events Log section.
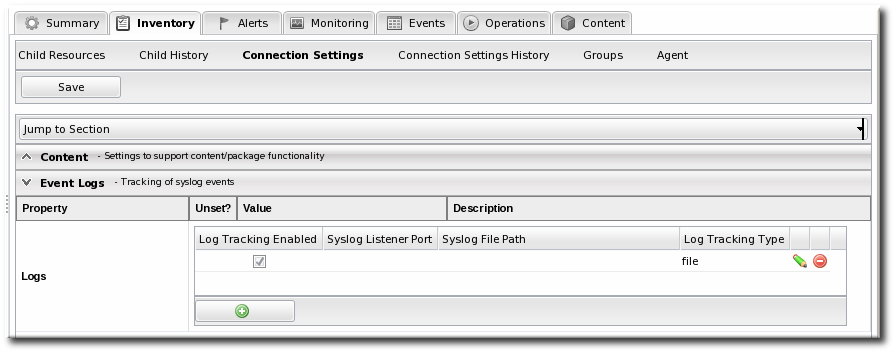
- Set the path to the log file, enable the event entry, and set the date format. Other properties about the log file, such as whether it is a file or listener and a message parser, can also be configured.


5. Alerts and Notifications: An Introduction
An alert is a configuration setting that lets an administrator know that something has happened to a resource. Conditions and notifications are configured together in an alert definition for a resource.
There are three major components to an alert definition:
- The information that identifies that specific alert definition (the name, priority, and whether it is active)
- The conditions that trigger the alert, which depends on the area of the resource being monitored
- The method and settings to use to send the alert
5.1. Alert Conditions
The condition is any situation, event, or level on a resource that crosses a certain threshold. Basically, a condition sets parameters on what is "normal" behavior or performance for a resource. Once it crosses that boundary, JBoss ON issues an alert. This can be a metric value that has changed to an undesirable level, an event, or a recurring metric reading.
Alerts through alert definitions against are defined for individual resources or for compatible groups of resources. An alert definition specifies the conditions that trigger the alert and the type and settings of any notification that should be triggered.
When an alert is registered, the alert identifies the alert definition which was triggered (which identifies the alert condition) and the metric or event value which precipitated the alert.
An alert can be issued every single time a condition is met, or an alert can be issued and then disabled until an administrator acknowledges it. Depending on the condition, it can be useful to prevent multiple alerts and notifications from being sent for a single ongoing set of circumstances.
Resources may have multiple alert definitions or no alert definitions.
Alerts can be disabled and enabled manually by administrators. Disabling alerts avoids unnecessary alerts being recorded when a resource is taken offline or when it is expected to be in a condition that will trigger alerts.
An alert conditions answers four questions: what, when, who, and where. The what is the threshold or condition that triggers the alert (such as the free memory drops below a certain point). The when sets the frequency or timing for sending an alert using a defined dampening rule. And the who and where controls how administrators are notified of the alert.
A single condition can be enough to issue an alert, or an alert definition can require that an alert is issued only if multiple conditions are met simultaneously. This provides very granular control over when an alert is issued, which makes alerting information more valuable and relevant.
A condition can be any of five different metrics, listed in Table 3, “Types of Alert Conditions”. These alert conditions correspond directly to the monitoring metrics available for that type of resource. All of the possible metrics for each resource type are listed in the Resource Monitoring Reference.
Table 3. Types of Alert Conditions
| Condition Type | Description |
|---|---|
| Metric | A specific monitoring area that is checked and the thresholds for that area which trigger a response. Metrics are usually numeric responses of some sort (e.g., percent CPU usage, number of requests, or a cache hit ratio). |
| Trait | A change in a value for a specific setting. Traits are usually string values. |
| Availability | A sudden change in whether the resource is available or unavailable. |
| Operation | A specific action or task that is performed on the resource. |
| Severity | A certain type of error message, matching a given string, is recorded. |
Along with setting the threshold, the condition sets how JBoss ON counts events for it to trigger alerts. A condition may need to occur several times over a short period of time for it to be a problem, but if it occurs once, it is not a problem. Dampening prevents an alert from being sent until the condition occurs with enough frequency to indicate a true problem. For example, a condition may be set to alert if the CPU hits 80% usage. In real life, a server may bounce between 78% and 80% CPU over several minutes, it could hit 80% once for only a few seconds, or it could hit 80% and stay there.
The condition dampening setting tells JBoss ON how to interpret those monitoring data.
- JBoss ON could send an alert every time the condition is encountered. In that case, there would be multiple alerts issued if the CPU percentage bounced around, while only one alert would be sent if it hit it briefly or hit it and stayed there.
- JBoss ON could send an alert only if the condition was encountered a certain number of times consecutively or X number of times out of Y number of polls. In this case, only a recurring or sustained problem would trigger an alert. A momentary spike or trough wouldn't be enough to fire a notification.
- The other option is that a notification is sent only if the problem occurs within a set time period. This can be useful to track the frequency of recurring problems or to track how long a condition persisted.
5.2. Notification Methods
Every alert is recorded and viewable in the JBoss ON GUI. Alerts have an optional configuration, though, of sending an external notification whenever the alert is issued.
Once an incident occurs, there has to be a way to let a systems administrator know what is going on, so they can respond to an issue. This is done by configuring a notification.
JBoss ON has several different methods of sending a notification:
- Email
- SNMP traps
- Resource operations
- JBoss ON users and roles
- Resource scripts (as operations)
- JBoss ON CLI scripts
It is also possible to write custom alert methods, which are implemented as server-side plug-ins. Creating custom plug-ins is described in the JBoss Operations Network Plug-ins Writing Guide.
Because alerts and notifications are configured through server-side plug-ins, custom notification senders can be written; writing server-side plug-ins is covered in more detail in the JBoss Operations Network Plug-ins Writing Guide.
These alert methods can be configured individually for a specific alert definition.
Note
You can "cluster" alert notifications.
Alert notifications can be broadcast through several different methods at the same time. For example, if a public website goes down, then a company may want notifications to be sent to their head web administrator and their company's external microblog feed at the same time.
5.3. Alert Operations
A parallel response to an alert is to launch an operation. Resource operations (which, like metrics, are defined in the resource type agent plug-in) are launched, like a notification, in response to a triggered alert. Alert operations can be run on the resource that issued the alert or on any other resource in the inventory, which allows immediate and automatic responses to alert conditions. For instance, a JBoss server may begin performing badly because its JVM is out of memory. The JVM is the resource which issues its alert, but the response by the agent is to restart the JBoss server.
When a certain alert condition occurs, the JBoss ON agent can respond by initiating an operation on a resource. This is part of the alert definition configuration, but it's worth calling out because it is such a useful tool for managing responses to alerts. Whenever an alert is fired, the agent can perform some kind of action, like restarting a server. This can be done either on the resource which issued the alert or on another resource.
Remote operations can be exceedingly useful (and versatile). For example, a JBoss server may begin performing badly because its JVM is out of memory. The JVM is the resource which issues its alert, but the response by the agent is to restart the JBoss server.
Regular operations are either initiated immediately or run on defined schedules for a specific configured resource. Alert operations are even more flexible than regular operations for two reasons:
- Alert operations are fired responsively to address any alert or event.
- Alert operations can be initiated on any resource in the JBoss ON inventory, not only the resource which sent the alert. That means that an operation can be run for a different application on the same host server or even on an entirely different server.
Note
The operations performed in response to an alert are the same as the operations which can be scheduled to run on a resource. The operations available for an alert depend on the target resource on which the operation will run — not the resource where the alert is set.
The type of operation which is available to be run for an alert depends on the type of resource that is the target of the operation. (This may not be the same as the resource which has the alert configured.) There are two types of alert operations:
- Operations that are the same as regular operations.
- JavaScripts that can be run on any platform as an operation for script resources.
Note
Alert operations senders can be used to run scripts on remote resources. For example, if a resource goes down, a diagnostic script can be run on its parent platform or another resource can be brought online and properly configured to take its place.
Note
A single alert can initiate multiple operations. All alert operations, as with all alert notifications, are run in the order they are listed in the alert definition.
Alert operations can accept tokens to fill in certain values automatically. These have the following form:
<%space.param_name%>
The space gives the JBoss ON configuration area where the value is derived; this will commonly be either
alert or resource. The param_name gives the entry value that is being supplied. For example, to point to the URL of the specific fired alert, the token would be <%alert.url%>, while to pull in the resource name, the token would be <%resource.name%>. The possible tokens are listed in Table 4, “Available Alert Operation Tokens”.
5.4. Alert Histories and Acknowledgments
Having a record of alert incidents can help improve performance, incident analysis, and other admin tasks.
Every time an alert is sent, JBoss ON makes a record of it. Each alert notification and the conditions that triggered it are stored in the alert history for the resource.
JBoss ON also enables users to acknowledge alerts. An administrator who takes or verifies an action after an alert can mark that alert as acknowledged to indicate that the issue is closed. The name of the user and the time of the acknowledgment are recorded with the alert details.
The alert history and acknowledgment history are both valuable for auditing and assessing infrastructure performance.
5.5. Group Alerting and Alert Templates
Most alerts can be defined consistently for multiple resources of the same type. JBoss ON has two ways to accomplish this:
- Alert templates
- Alerts on compatible groups
An alert template is a configuration setting for the JBoss ON server. An alert is configured for a specific resource type (even if no resource of that type exists in the inventory yet). Whenever a resource is added, any alert templates in the JBoss ON configuration are automatically applied to that resource. Alert templates can be configured to allow local changes (for example, Resource A may have different baselines or expected behavior, so the alert conditions can be altered). Templates can also be strictly enforced, so that every resource of that type has exactly the same settings.
Alerts can be configured on compatible groups. As with alert templates, the compatible group's alert definitions trickle down to the rest of the group members. When a resource is added to a group, the alerts are automatically added to the resource. When the resource is removed from the group, the alert is automatically deleted. Group alerting works for both manual groups and dynamic groups. As with alert templates, group alerts can allow local changes or enforce the group alert settings.
6. Configuring and Managing Alerts: Procedures
Monitoring (Section 2, “Monitoring Resources: An Introduction”) is the first step in a larger work flow that has the sole intent of keeping administrators aware of what is happening in their network. The next two steps involve:
- Setting parameters for JBoss ON to trigger a warning (alerts)
- Notifying administrators when an alert is tripped (notifications)
6.1. Setting Alerts for a Resource
Note
It is not possible to edit an alert condition or an alert notification after they are set. To change the conditions or notifications for an alert definition, delete the condition or notification and create a new one.
- Click the Inventory tab in the top menu.
- Select the resource type in the Resources menu table on the left, and then browse or search for the resource.
- Click the resource name in the list.
- Click the Alerts tab for the resource.

- In the Definitions subtab, click the New button to create the new alert.
- In the General Properties tab, give the basic information about the alert.

- Name. Gives the name of the specific alert definition. This must be unique for the resource.
- Description. Contains an optional description of the alert; this can be very useful if you want to trigger different kinds of alert responses at different conditions for the same resource.
- Priority. Sets the priority or severity that is given to an alert triggered by this definition.
- Enabled. Sets whether the alert definition is active. Alert definitions can be disabled to prevent unnecessary or spurious alerts if there is, for instance, a network outage or routine maintenance window for the resource.
- In the Conditions tab, set the metric or issue that triggers the alert. Click the Add button to bring up the conditions form.

Note
There can be more than one condition set to trigger an alert. For example, you may only want to receive a notification for a server if its CPU goes above 80% and its available memory drops below 25MB. The ALL setting for the conditions restricts the alert notification to only when both criteria are met. Alternatively, you may want to know when either one occurs so that you can immediately change the load balancing configuration for the network. In that case, the ANY setting fires off a notification as soon as even one condition threshold is met.- Click the Add a new condition button.
- From the initial drop-down menu, select the type of condition. The categories of conditions are described in Table 3, “Types of Alert Conditions”, and the exact conditions available to be set for every resource are listed in the Resource Monitoring Reference.
- Set the values for the condition.
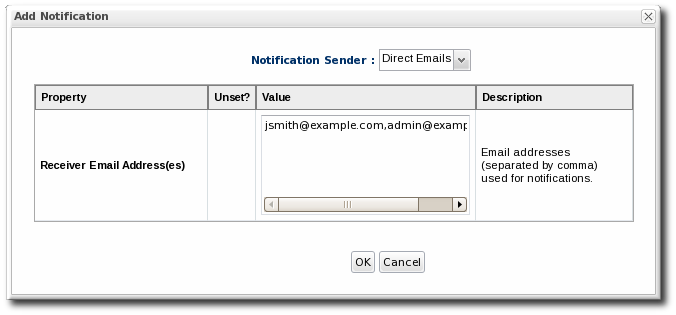
- In the Notifications tab, click Add to set a notification for the alert.
- Select the method to use to send the alert notification in the Sender option.
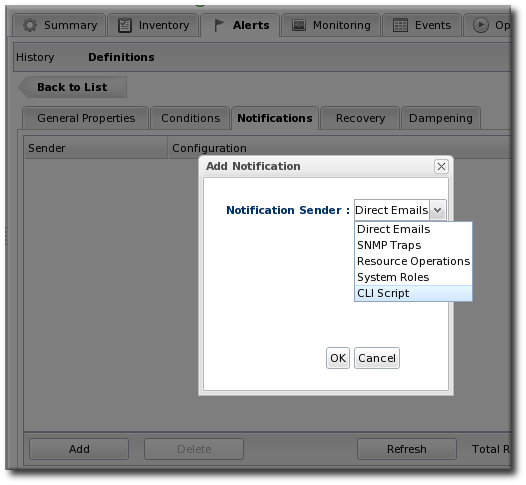 The Sender option first sets the specific type of alert method (such as email or SNMP) and then opens the appropriate form to fill in the details for that specific method.
 - Fill in the required information for the alert sender method. The method may require contact information, SNMP settings, operations, or scripts, depending on what is selected.
- In the Recovery tab, set whether to send a recovery alert and whether the alert is disabled until the resource state is recovered.

- In the Dampening tab, give the dampening (or frequency) rule on how often to send notifications for the same alert event.
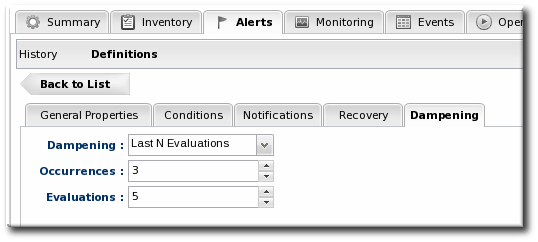 The frequency for sending alerts depends on the expected behavior of the resource. There has to be a balance between sending too many alerts and sending too few. There are several frequency settings:
- Consecutive. Sends an alert if the condition occurs a certain number of times in a row for metric calculations. For example, if this is set to three, then the condition must be detected in three consecutive metric collection periods for the alert to be fired. If this is set to one, then it sends an alert every time the condition occurs.
- Last N evaluations. This sets a number of times that the condition has to occur in a given number of monitoring evaluations cycles before an alert is sent.
- Time period. The other two similar dampening rules set a recurrence based on the JBoss ON monitoring cycles. This sets the alerting rule based on a specific time period.
- Click OK to save the alert definition.
6.2. Extended Example: Ranges, AND, and OR Operators with Conditions
Alerting is based on monitoring information. It is an extension that allows an administrator to receive a notification or define an action to take if a certain event or metrics value occurs.
The monitoring point that triggers an alert is the alert condition. At its most simplistic, an alert condition is a single event or reading. If X occurs, then that triggers an alert.
In real life, X may not be enough to warrant an alert or to adequately describe the state of a resource. Different conditions may require the same response or a situation may only be critical if multiple conditions are true. Alerting is very flexible because it allows multiple conditions to be defined with established relationships between those conditions.
The next level of complexity is to send an alert if either X or Y is true. In the alert definition, this is the ANY option, which is a logical OR. The alert definition checks for any of those conditions, but those conditions are still unrelated to each other.
The last level of complexity is when the conditions have to relate to each other for an alert to be issued. This is the ALL option, which is a logical AND. Both X and Y must occur for the alert to be issued. In this case, when one condition occurs, the server puts a lock on that definition and begins waiting for the second condition to occur. When the second condition occurs, then the alert is issued.
An AND operator is very effective on different metrics, but because the conditions do not have to occur simultaneously, using a simple AND operator does not make sense for the same metric. For example, Tim the IT Guy only wants an alert to be issued when the user load is between 40% to 60%, indicating slightly increased loads on his platform. Attempting to use an AND operator returns strange values when the load spikes over 70% (which trips the above 40% condition) and then falls back to 15% (which triggers the below 60% condition).
In this case, Tim uses a range condition. A range requires two values from the same metric that are within the given boundaries. A range can be inside values (40-60%) or it can be an outside range (below 40% and above 60%).
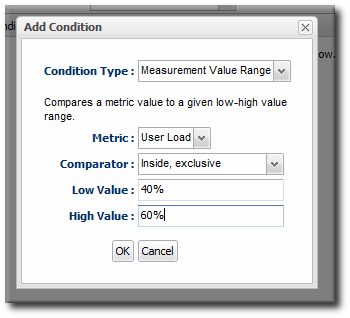
Figure 5. Alert Condition Range
6.3. Assigning an Operation to an Alert
To set an alert operation, select the Operations alert method when configuring notifications. Operations can perform tasks or run scripts on a target resource; this is detailed in Section 5.3, “Alert Operations” and correlates to using resource operations, as described in Section 7, “Operations: An Introduction”.
6.3.1. Using Tokens with Alert Operations
Alert operations can use tokens to either send information or supply information about the event. For example, tokens can be used to supply resource information in a command-line script.
Alert operations can accept tokens to fill in certain values automatically. These tokens have the following form:
<%space.param_name%>
The space gives the JBoss ON configuration area where the value is derived; this will commonly be either
alert or resource. The param_name gives the entry value that is being supplied. For example, to point to the URL of the specific fired alert, the token would be <%alert.url%>, while to pull in the resource name, the token would be <%resource.name%>.
JBoss ON has pre-defined token values that relate to the fired alert, the resource which issued the alert, the resource which is the target of the operation, and the operation that was initiated. These are listed in Table 4, “Available Alert Operation Tokens”. All of these potential token values are Java properties the belong to the operation's parent JBoss ON server.
The alert operations plug-in resolves the token value itself when the alert operation is processed to find the value. The realized value is sent to the script service, which ultimately plugs the value into the command-line argument or script which referenced the token.
Table 4. Available Alert Operation Tokens
| Information about ... | Token | Description |
|---|---|---|
| Fired Alert | alert.willBeDisabled | Will the alert definition be disabled after firing? |
| Fired Alert | alert.id | The id of this particular alert |
| Fired Alert | alert.url | Url to the alert details page |
| Fired Alert | alert.name | Name from the defining alert definition |
| Fired Alert | alert.priority | Priority of this alert |
| Fired Alert | alert.description | Description of this alert |
| Fired Alert | alert.firedAt | Time the alert fired |
| Fired Alert | alert.conditions | A text representation of the conditions that led to this alert |
| Alerting Resource | resource.id | ID of the resource |
| Alerting Resource | resource.platformType | Type of the platform the resource is on |
| Alerting Resource | resource.platformName | Name of the platform the resource is on |
| Alerting Resource | resource.typeName | Resource type name |
| Alerting Resource | resource.name | Name of the resource |
| Alerting Resource | resource.platformId | ID of the platform the resource is on |
| Alerting Resource | resource.parentName | Name of the parent resource |
| Alerting Resource | resource.parentId | ID of the parent resource |
| Alerting Resource | resource.typeId | Resource type id |
| Target Resource | targetResource.parentId | ID of the target's parent resource |
| Target Resource | targetResource.platformName | Name of the platform the target resource is on |
| Target Resource | targetResource.platformId | ID of the platform the target resource is on |
| Target Resource | targetResource.parentName | Name of the target's parent resource |
| Target Resource | targetResource.typeId | Resource type of the target resource id |
| Target Resource | targetResource.platformType | Type of the platform the target resource is on |
| Target Resource | targetResource.name | Name of the target resource |
| Target Resource | targetResource.id | ID of the target resource |
| Target Resource | targetResource.typeName | Resource type name of the target resource |
| Operation | operation.id | ID of the operation fired |
| Operation | operation.name | Name of the operation fired |
6.3.2. Setting Alert Operations
- Configure the basic alert definition, as in Section 6.1, “Setting Alerts for a Resource”.
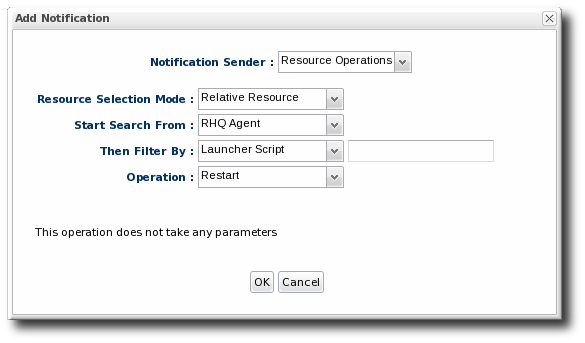
- In the Notifications tab for the alert definition, give the notification method a name, and select the Resource Operations method from the drop-down menu.
- First, set the resource that the operation will run on. The default is the resource that the alert is set for; it is also possible to set it on another specific resource or on the results of a search.

Important
If you select a relative resource and do not enter a specific resource name, then the operation will run on every resource which matches that resource type in the relative path. If no resource matches, then it is logged into the audit trail and the alert process proceeds.For a relative resource, the resource name is not required. For a specific resource, it is. - Select the operation type. The available operations and their configuration parameters depend on the type of resource selected as the target of the operation.
 The Resource Monitoring Reference lists the available operations per resource type. Section 7, “Operations: An Introduction” has more information on setting operations in general.
 - Configure the parameters of the operation. The available settings depend on the type of operation selected.
6.4. Initiating Resource Scripts from an Alert
To set an alert operation, select the Resource Operations alert method when configuring notifications, with any required environment variables or arguments. This is the same as using an operation to execute a script, as described in Section 8.5, “Running Scripts as Operations for JBoss Servers”.
Note
The script must be uploaded to the resource and added into the JBoss ON inventory before it can be used in an alert operation.
- Import the script into the resource inventory where it should run in response to the alert. If necessary, run manual discovery to detect and add the script.
- Configure the basic alert definition, as in Section 6.1, “Setting Alerts for a Resource”.
- In the Notifications tab for the alert definition, give the notification method a name, and select the Resource Operations method from the drop-down menu.
- Select the script resource that will be run in response to the alert.
Important
If you select a relative resource and do not enter a specific script name in the name filter field, then the operation will run on every script resource that is in the relative path with the command arguments that are given. If no script matches, then it is logged into the audit trail and the alert process proceeds.For a relative resource, the resource name is not required. For a specific resource, it is. To limit script execution to a single specific script, select the specific resource option and select the precise script from the list. - Set what operation to perform with the script and, optionally, any command-line arguments to pass to the script.
6.5. Launching JBoss ON CLI Scripts from an Alert
JBoss ON has its own command-line client that can be used to manage server instances in the same way that the web UI manages servers. Much like running a script resource or launching an operation in response to an alert condition, a server CLI script can be run in response to an alert condition.
Note
For server CLI scripts, the scripts must be uploaded to the server as content within a repository before it can be run.
The CLI script must use the proper API to perform the operation on the server. JBoss ON has several different API sets, depending on the task being performed. To connect to a server and run a script requires the remoting API, which allows commands to be executed on the server remotely. Writing CLI scripts is covered more in Running JBoss ON Command-Line Scripts.
- Create a script which is relevant to the alert. Commands, options, and variables for the JBoss ON CLI are listed in Running JBoss ON Command-Line Scripts.An example alert script is included in the server files, in serverInstallDir
/alert-scripts/.Note
The CLI script can actually reference an alert object for the alert which triggers the script by using a pre-defined alert variable.For example, this script checks the recent monitoring statistics for a web application and restarts the web server database if there are connection problems:var myResource = ProxyFactory.getResource(alert.alertDefinition.resource.id) var definitionCriteria = new MeasurementDefinitionCriteria() definitionCriteria.addFilterDisplayName('Sessions created per Minute') definitionCriteria.addFilterResourceTypeId(myResource.resourceType.id) var definitions = MeasumentDefinitionManager.findMeasurementDefinitionsByCriteria(definitionCriteria) if (definitions.empty) { throw new java.lang.Exception("Could not get 'Sessions created per Minute' metric on resource " + myResource.id) } var definition = definitions.get(0) var startDate = new Date() - 8 * 3600 * 1000 //8 hrs in milliseconds var endDate = new Date() var data = MeasurementDataManager.findDataForResource(myResource.id, [ definition.id ], startDate, endDate, 60) exporter.setTarget('csv', '/the/output/folder/for/my/metrics/' + endDate + '.csv') exporter.write(data.get(0)) var dataSource = ProxyFactory.getResource(10411) connectionTest = dataSource.testConnection() if (connectionTest == null || connectionTest.get('result').booleanValue == false) { //ok, this means we had problems connecting to the database //let's suppose there's an executable bash script somewhere on the server that //the admins use to restart the database java.lang.Runtime.getRuntime().exec('/somewhere/on/the/server/restart-database.sh') } - Upload the script to a content repository.

Note
Create a separate repository for alert CLI scripts. - Search for the resource, and configure the basic alert definition, as in Section 6.1, “Setting Alerts for a Resource”.
- In the Notifications tab for the alert definition, give the notification method a name, and select the CLI Script method from the drop-down menu.
- First, select the JBoss ON user as whom to run the script. The default is as the user who is creating the notification.

- Select the repository which contains the CLI script. If you are uploading a new script, this is the repository to which the script will be added.
- Select the CLI script to use from the drop-down menu, which lists all of the scripts in the specified repository. Alternatively, click the button to browse to a script on the local machine.
- Click to save the notification. The line in the Notifications tab shows the script, the repository, and the user as whom it will run.

6.6. Configuring SNMP for Notifications
Configuring JBoss ON to send SNMP alerts has two parts:
- Configuring the SNMP alert plug-in for the server.
- Configuring the actual alert with an SNMP notification.
6.6.1. JBoss ON SNMP Information
JBoss ON can send SNMP traps to other management stations and systems as part of alerting notifications. The data transmitted contain details about the alert, such as the name of the alert that was triggered and the resource name.
The data to include in the traps, as with other SNMP notifications, are defined in the JBoss ON MIB file, in serverRoot
/etc/RHQ-mib.txt. The default configuration for the MIB is shown in Example 1, “Default Alert Object in JBoss ON MIB”. The base OID for the JBoss ON alert is 1.3.6.1.4.1.18016.2.1 (org.dod.internet.private.enterprise.jboss.rhq.alert).
Example 1. Default Alert Object in JBoss ON MIB
alertGroup OBJECT-GROUP
    OBJECTS {   alertName,
                alertResourceName,
                alertPlatformName,
                alertCondition,
                alertSeverity,
                alertUrl }
    STATUS  current
    DESCRIPTION "A collection of objects providing information about an alert"
With the default MIB file, each trap sends the alert definition name, resource name, platform, alert conditions, severity, and a URL to the alert details page.
6.6.2. Configuring the SNMP Alert Plug-in
The SNMP alert sender plug-in is the only alert notification plug-in that requires additional configuration before the notification method can be used. The SNMP plug-in has to be configured with the appropriate SNMP version and SNMP agent information.
- In the top menu, select the Administration tab.
- In the menu, select the item.

- Open the Server Plugins tab, and click the name of the SNMP plug-in in the list.

- In the plug-in details page, click the Configure 'Alert:SNMP' link to open the configuration page for the plug-in.

- Click the button at the bottom of the configuration screen to make the fields active.
- All SNMP versions require information about the JBoss ON MIB OID and selected version. Fill in the appropriate values.

- SNMP version 1 and version 3 both require additional configuration. Expand the version-specific configuration section and fill in the information about the SNMP agent.
 It may be necessary to unselect the Unset checkbox to allow the fields to be edited.
6.6.3. Configuring the SNMP Alert Notification
Before JBoss ON can send any SNMP notifications, SNMP traps have to be configured for the server.
- Configure the basic alert conditions and information for the resource, as described in Section 6.1, “Setting Alerts for a Resource”. Click to go to the next page to configure notifications.
- In the Notifications tab for the alert definition, give the notification method a name, and select the SNMP Trap method from the drop-down menu.
- Fill in the information for the SNMP trap.

- The hostname for the SNMP manager.
- The port number for the SNMP manager. JBoss ON supports UDP, so this must be the UDP port.
- The JBoss ON OID. This is
1.3.6.1.4.1.18016.2.1.
6.7. Sending Alerts Based on Call-Time Data
Certain resource types deliver call time or response time data. This information contains pre-aggregated measurements for the maximum, minimum, or average results for the responses. Resources which collect call time data can use that pre-processed information as the basis for alert notifications, the same as other monitoring data.
Two types of resources support call-time data:
- Session bean methods
- Web servers with response time monitoring configured
To configure call-time data alerts:
- Configure the basic alert definition, as in Section 6.1, “Setting Alerts for a Resource”.
- In the Conditions tab for the alert definition, click to add a monitoring condition.
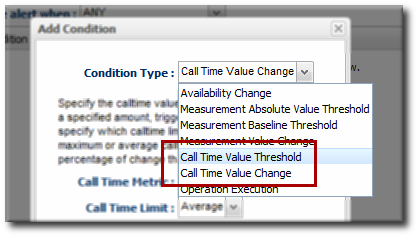
- Select one of the call-time data options from the Condition Type list. Call-time changes will trigger an alert for any change from the established baseline. Call-time thresholds trigger an alert if the call-time data moves past the given level or hits a certain value, regardless of what kind of that change is.
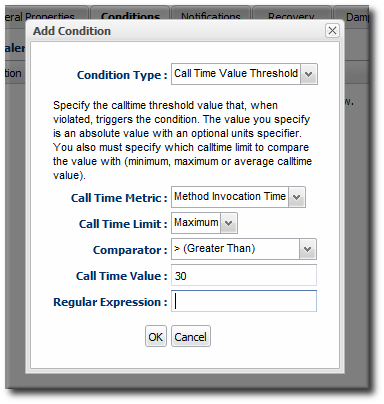
- Fill in the information about the call-time data to alert on. Call-time data are pre-aggregated (processed) in one of three ways: maximum, minimum, and average measurements. The Call Time Limit value sets which of the pre-aggregated measurements is being monitored for the alert.
- Complete the alert configuration by setting notification methods, recovery, and dampening settings.
6.8. Enabling and Disabling Alert Definitions
When an alert definition is disabled, no alert notifications are triggered for that set of conditions. Disabling definitions is very useful when resources are being taken offline for a know reason (such as upgrades or maintenance) and any alerts triggered during that time would be wrong. Alert definitions can be re-enabled later just as easily.
- Click the Inventory tab in the top menu.
- Select the resource type in the Resources menu table on the left, and then browse or search for the resource.
- Click the Alerts tab.
- In the Definitions subtab, select any of the definitions to enable or disable.
- Click the Enable or Disable button.

- Confirm the action.
6.9. Viewing the Alert Definitions Report
While the alert definitions for a specific resource are always available by viewing that resource entry, it is also possible to view all of the alert definitions configured in JBoss ON in the Alert Definitions Report.
- Select the Reports tab in the top navigation bar.
- In the Subsystems menu box on the left, select Alert Definitions.
- The definitions report shows a list of all configured definitions, for all resources in the inventory.
 The results table provide the most basic information for the definitions:
- The resource (Name).
- The parent or ancestry. Since resources are arranged hierarchically, sorting by the parent is very useful for finding all alert definitions for all services and applications that relate to a high-level resource like a server.
- The description of the alert.
- Whether it is active (enabled).
Note
A user may have the write to create and edit an alert definition, but that does not mean that the user has the right to delete an item from the alert history.
Deleting elements in the history requires the manage inventory permission.
6.10. Using Alerting Templates and Group Alerts
Templates make configuration really easy to apply consistently and often, and JBoss ON allows templates to be set for alerts based on their general resource type.
Group alerts, like alert templates, apply equally to every member of a compatible group. Group alerts offer more control over which resources have the alert definition, however, since resources can be manually added to the group or selected based on a search filter. When a resource joins or leaves a group, its alert definitions are automatically updated.
6.10.1. Creating Alert Definition Templates
Alert templates are fully defined alert definitions — from conditions to notification methods — that are created for any of the managed resource types in JBoss ON. Servers or applications of the same type will probably have the same set of alert conditions that apply, such as free memory or CPU usage. An alert definition template creates an alert based on the general type of resource. So, there can be alert templates for Windows, Linux, and Solaris servers, Tomcat and Apache servers, and services like sshd and cron. Every time a resource of that type is added, then the alert definition is automatically added to the resource with the predefined settings. Any alert assigned to a resource through a template can be edited locally for that resource, so these alert definitions are still flexible and customizable.
To create an alert definition template:
- In the top navigation, open the Administration menu, and then the System Configuration menu.
- Select the Alert Templates menu item. This opens a long list of resource types, both for platforms and server types.
- Locate the type of resource for which to create the template definition.

- Click the button to create a global alert definition. Set up the alert exactly the same way as setting an alert for a single resource (as in Section 6.1, “Setting Alerts for a Resource”).

- Save the template.
The template definition is then applied to all current and new resources of that type.
6.10.2. Configuring Group Alerts
Group alerts can only be set on compatible groups.
- In the Inventory tab in the top menu, select the Compatible Groups item in the Groups menu on the left.

- In the main window, select the group to add the alert to.
- Click the Alerts tab for the group.
- In the Definitions subtab, click the button.

- Configure the basic alert definition and notifications, as in Section 6.1, “Setting Alerts for a Resource”.
6.11. Viewing Alerts
The alert history can be reviewed for a resource, a group of resources, a parent, or the whole JBoss ON server.
6.11.1. Viewing Alert Details for a Specific Resource
Note
A user may have the write to create and edit an alert definition, but that does not mean that the user has the right to delete an item from the alert history.
Deleting elements in the history requires the manage inventory permission.
- Click the Inventory tab in the top menu.
- Select the resource type in the Resources menu table on the left, and then browse or search for the resource.
- Click the resource in the list.
- Click the Alerts tab, and make sure that the History subtab is selected.
- In the list, click the timestamp or alert definition name for the fired alert.

- The alert page has tabs for each detail for the alert, including which alert definition was triggered, the conditions that triggered, and any operations that were launched as a result.

6.11.2. Viewing the Fired Alerts Report
- Select the Reports tab in the top navigation bar.
- In the Subsystems menu box on the left, select Recent Alerts.

All of the alerts for all resources in JBoss ON are listed in the results table. Several results elements are useful for analysis:
- The resource (Name)
- The parent (ancestor)
- The name of the definition which triggered the alert
- The condition which triggered the alert
- The value of the resource at the time the alert was sent
- The date, which is very useful for correlating the alert notification to an external event
Note
A user may have the write to create and edit an alert definition, but that does not mean that the user has the right to delete an item from the alert history.
Deleting elements in the history requires the manage inventory permission.
6.11.3. Viewing Alerts in the Dashboard
All of the recently-fired alerts, by default, are listed on the Dashboard page of JBoss ON in the recent alerts portlet.
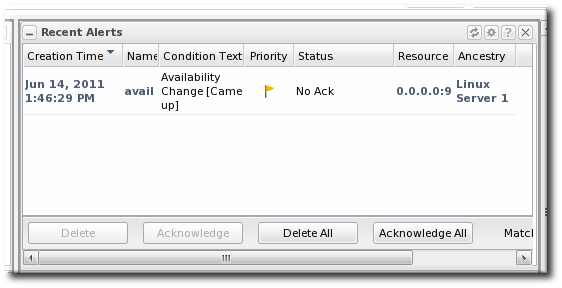
Figure 6. Recent Alerts Portlet
The alerts displayed in the portlet can be filtered for three conditions:
- A time range for when the alert was fired
- The alert priority (which is initially configured in the alert definition)
These conditions are evaluated in order, meaning that alerts are filtered first based on time, then priority.
To set the conditions for the alerts portlet in the Dashboard page:
- In the top menu, click Dashboard.
- In the Recent Alerts portlet, click the gear icon to open the portlet configuration page.

- Change the display criteria as desired.
6.12. Acknowledging an Alert
Acknowledging an alert is a way of identifying that the condition which triggered the alert has been addressed in some way. When an alert is acknowledged, the name of the user who acknowledged the alert is recorded. Recording the acknowledger's name allows the action to be audited later if necessary.
There are several different ways to acknowledge an alert:
- Through the Recent Alerts Report
- Through a group
- Through the resource entry
Using the Recent Alerts Report is useful because you can acknowledge multiple alerts at the same time and for multiple resource types, which could be simpler if a known outage triggered many alerts. Acknowledging an alert is not a requirement to close the alert, but it can be useful as part of auditing an incident response or making sure that issues have been addressed.
- Select the Reports tab in the top navigation bar.
- In the Subsystems menu box on the left, select Recent Alerts.
- Select the alert to acknowledge.
- Click the Acknowledge button, and, when prompted, confirm the action.

Note
It is also possible to acknowledge a single alert through the alert details page.
When the alert is acknowledged, the Status shows the name of the user who acknowledged (and presumably resolved) the alert.

7. Operations: An Introduction
JBoss Operations Network provides a way to manage resources by scheduling and launching operations. Operations are basic management tasks. The available tasks differ for every different type of resource.
The Resource Reference: Monitoring, Operation, and Configuration Options contains a complete reference for all of the operations that can be scheduled for each resource type, as well as configurable parameters for the operations. Regardless of the type of operation or resource, the process for scheduling operations is similar for both resources and compatible groups in JBoss ON.
JBoss Operations Network allows administrators to manage resources by scheduling and launching operations. Operations manage resources by initiating or even scheduling some basic, specified tasks, such as restarting a server or running a script. Operations can be carried out on any resource in the inventory, and even on the JBoss ON agent themselves. The types of operations that are available for each resource depends on the type of resource being managed. For example, a JBoss AS server has different available operations than a cron service. The supported operations for a resource are defined by its agent plug-in, and the default operations are listed for each resource type in the Resource Reference: Monitoring, Operation, and Configuration Options.
7.1. A Summary of Operation Benefits
Operations provide a way to perform tasks in a consistent way, with a defined order both on resources and in task queuing, and in a way that can be tracked. Because operations are defined by plug-ins, they are extensible. The versatility of running specific tasks through JBoss ON provides several benefits to administrators:
- They allow additional parameters (depending on how the operation is defined in the plug-in), such as command arguments and environment variables.
- They validate any operation parameters, command-line arguments, or environment variables much as JBoss ON validates resource configuration changes.
- They can be run on group of resources as long as they are all of the same type.
- Operations can be ordered to run on group resources in a certain order.
- They can be run on a recurrently schedule or one specific time.
- Operations keep a history of both successes and failures, so that it is possible to audit the operations executed on a resource both for operations run for that specific resource and done on that resources as part of a group.
7.2. About Scheduling Operations
Operations can be executed immediately or scheduled for later execution. Deferred operations can be scheduled for once only execution at a specific time, or operations can be scheduled to occur on a recurring basis starting at a specific time. Recurring operations can continue with no end date or time specified, or they can include a termination date and time.

Figure 7. A Scheduled Operation
Note
The Schedules tab shows a list of scheduled operations, meaning operations which are configured but have not yet been run. If there are no scheduled operations, then the tab has a description that reads No items to show. That does not mean that there are no operations available for the resource; it only means that no operations have been scheduled.

When an operation is scheduled, a new operation is added to the history record for the resource, and its state is set to in progress. A message is sent to the agent telling it to invoke a specific operation on a particular resource with the arguments that were specified when the schedule was created. The agent queues operations so that only one operation is executed on the resource at a time.
When an operation completes, its raw output is sent back to the agent's resource plug-in, which ultimately parses the output and then generates an appropriate response message. This response message is then sent to the server.
If one operation ever hangs on a resource, then it blocks any other operations from being initiated because only one operation can be run on a resource at a time. Using a timeout setting for the operation enables the agent to kill the hung operation and run other queued operations.
8. Managing Operations: Procedures
8.1. Scheduling Operations
- Click the Inventory tab in the top menu.
- Select the resource type in the Resources menu table on the left, and then browse or search for the resource.
- Click the Operations tab.
- In the Schedules tab, click the New button.
 The types of operations that are available vary, depending on the specific type of resource.
Note
The Schedules tab shows a list of scheduled operations, meaning operations which are configured but have not yet been run. If there are no scheduled operations, then the tab has a description that reads No items to show. That does not mean that there are no operations available for the resource; it only means that no operations have been scheduled. - Fill in all of the required information about the operation, such as port numbers, file locations, or command arguments.
- In the Schedule area, set when to run the operation. The operation can run immediately, at a specified time, or on a repeatable schedule.

- Set other rules for the operations, like a timeout period and notes on the operation itself.
- Click the button to set up the operation.

If the operation is scheduled to run immediately, the results are available in the History subtab as the operation is in progress and then completes. If it was scheduled on a later date or with a recurring schedule, then the operation is listed in the Schedules subtab.
8.2. Viewing the Operation History
Note
A user may have the write to schedule and edit an operation, but that does not mean that the user has the right to delete an item from the operation history.
Deleting elements in the history requires the manage inventory permission.
- Click the Inventory tab in the top menu.
- Select the resource type in the Resources menu table on the left, and then browse or search for the resource.
- Click the Operations tab.
- Click the History subtab.
 Every completed or in progress operation is listed, with an icon indicating its current status.
 - Click the name of the operation to view further details. The history details page shows the start and end times of the operation, the stdout output of the operation or other operation messages, as well as the name of the user who scheduled the operation.

8.3. Canceling Pending Operations
- Click the Inventory tab in the top menu.
- Select the resource type in the Resources menu table on the left, and then browse or search for the resource.
- Click the Operations tab.
- In the Schedules tab, click the line of the operation to cancel.
- Click Delete, and confirm the action.
Note
Once the agent has started an operation it cannot be canceled. If the user attempts to cancel an operation currently in progress, the request will be ignored.
8.4. Ordering Group Operations
Group operations can be scheduled. This is useful when operations need to be performed in a particular order.
Note
This procedure assumes groups are already set up.
- In the Inventory tab in the top menu, select the Compatible Groups item in the Groups menu on the left.
- Click the name of the group to run the operation on.
- Configure the operation, as in Section 8.1, “Scheduling Operations”.
- In the Resource Operation Order area, set the operation to execute on all resources at the same time (in parallel) or in a specified order. If the operation must occur in resources in a certain order, then all of the group members are listed in the Member Resources box, and they can be rearranged by dragging and dropping them into the desired order.Optionally, select the Halt on failure checkbox to stop the group queue for the operation if it fails on any resource.

8.5. Running Scripts as Operations for JBoss Servers
JBoss ON auto-discovers resource scripts when the resource is discovered. Scripts can be managed just like any other resource to perform operations. There are three types of scripts that JBoss ON discovers, depending on the operating system:
.batfor Windows.shfor Unix and Linux.plscripts for Unix and Linux
Note
Scripts on Linux and Unix systems need to have the x-bit set to be detected.
Connection properties and environment variables can be added to a script.
To execute a script as an operation:
- Click the Inventory tab in the top menu.
- Select the resource type in the Resources menu table on the left, and then browse or search for the resource.
- Click the Operations tab.
- In the Schedules tab, click the New button.
- Select Execute script as the operation type from the Operation drop-down menu.

Note
The Execute script option is only available for JBoss AS and JBoss AS 5 resources, by default, and only if a script is available to execute. - Enter any command-line arguments in the Parameters text box.Each new argument has the format name=value; and is added on a new line. If the variable's value contains properties with the syntax
%propertyName%, then JBoss ON interprets the value as the current values of the corresponding properties from the script's parent resource's connection properties. - Finish configuring the operation, as in Section 8.1, “Scheduling Operations”.
8.6. Setting an Operation Timeout Default
Only one operation can run on a resource at one time. An optional timeout setting prevents an operation from hanging indefinitely and blocking other operations from running. A global default timeout can be set in the JBoss ON server configuration to prevent operations from being blocked on a resource, even if a timeout period isn't set on a specific operation.
Note
This server setting is a fallback value. Operation plug-ins can define their own timeouts in the plug-in descriptor or individual operations can specify a timeout. Both of those settings override the server default.
- Open the
rhq-server.propertiesfile.vim serverRoot/jon-server-3.0.0.GA1/bin/rhq-server.properties
- Change or add the value of the
rhq.server.operation-timeoutparameter to the amount of time, in seconds, for the server to wait before an operation times out.rhq.server.operation-timeout=60
9. Document Information
This guide is part of the overall set of guides for users and administrators of JBoss ON. Our goal is clarity, completeness, and ease of use.
9.1. Document History
| Revision History | |||
|---|---|---|---|
| Revision 3.0.1-5 | 2013-10-31 | ||
| |||
| Revision 3.0.1-0 | March 18, 2012 | ||
| |||
| Revision 3.0-0 | December 7, 2011 | ||
| |||
Index
A
- alerts
- acknowledging, Acknowledging an Alert
- assigning operations, Assigning an Operation to an Alert
- available operation tokens, Using Tokens with Alert Operations
- conditions, Alert Conditions
- configuring, Alerts and Notifications: An Introduction
- configuring and managing, Configuring and Managing Alerts: Procedures
- configuring for groups, Configuring Group Alerts
- creating definition templates, Creating Alert Definition Templates
- definitions report, Viewing the Alert Definitions Report
- enabling and disabling definitions, Enabling and Disabling Alert Definitions
- fired alerts report, Viewing the Fired Alerts Report
- groups and templates, Group Alerting and Alert Templates
- histories and acknowledgments, Alert Histories and Acknowledgments
- initiating CLI scripts, Launching JBoss ON CLI Scripts from an Alert
- notification methods, Notification Methods
- operations, Alert Operations, Setting Alert Operations
- setting, Setting Alerts for a Resource
- setting dashboard display, Viewing Alerts in the Dashboard
- SNMP, Configuring SNMP for Notifications, Configuring the SNMP Alert Plug-in
- SNMP notifications, Configuring the SNMP Alert Notification
- to initiating resource scripts, Initiating Resource Scripts from an Alert
- tokens and operations, Using Tokens with Alert Operations
- using templates and group alerts, Using Alerting Templates and Group Alerts
- viewing, Viewing Alerts
- viewing alerts for specific resource, Viewing Alert Details for a Specific Resource
- Apache
- configuring response time metrics, Configuring Apache Servers for Response Time Metrics
- configuring the SNMP module, Configuring the Apache SNMP Module
- auto discovery
B
- baselines
- recalculating, Recalculating Baseline Values
C
- CLI
- running for alerts, Launching JBoss ON CLI Scripts from an Alert
- configuration
- alerts, Configuring and Managing Alerts: Procedures
- Apache servers for response time filters, Configuring Apache Servers for Response Time Metrics
- Apache SNMP module, Configuring the Apache SNMP Module
- monitoring response time filters, Configuring Response Time Filters for Monitoring Web Servers
- response time filters for Tomcat, Configuring Response Time Filters for Tomcat
D
- dashboard
- alerts settings, Viewing Alerts in the Dashboard
- data storage
- monitoring, Configuring How Long Monitoring Data Are Stored
E
- events
- defining new events, Defining a New Event
- overview, Tracking Events: Procedures
- viewing, Viewing Events
G
- groups
- alerts and templates, Group Alerting and Alert Templates, Using Alerting Templates and Group Alerts
- configuring alerts, Configuring Group Alerts
J
- JBoss ON
- and SNMP, JBoss ON SNMP Information
M
- monitoring
- baselines, About Baseline Metrics
- changing defaults, Changing Monitoring Default Templates
- changing the resource availability scan period, Changing the Resource Availability Scan Period
- collection schedules, About Metrics
- configuring response time filters, Configuring Response Time Filters for Monitoring Web Servers
- configuring Tomcat, Configuring Tomcat/EWS Servers for Monitoring
- data storage, Storing Metric Data
- enabling and disabling metrics, Enabling and Disabling Metrics for a Specific Resource
- operations, Monitoring Resources: An Introduction
- out of bounds (OOB), About Baseline Metrics
- problem metrics, About Baseline Metrics
- recalculating baselines, Recalculating Baseline Values
- resources with special configuration, Resources Which Require Special Configuration for Monitoring
- server, About Baseline Metrics
- setting collection intervals, Setting Collection Intervals for a Specific Resource
- storage limits for data, Configuring How Long Monitoring Data Are Stored
N
- notifications
- SNMP and alerts, Configuring the SNMP Alert Notification
O
- operations, Operations: An Introduction
- alerts, Alert Operations, Assigning an Operation to an Alert
- alerts and tokens, Using Tokens with Alert Operations
- canceling, Canceling Pending Operations
- executing scripts, Running Scripts as Operations for JBoss Servers
- ordering group, Ordering Group Operations
- scheduling, About Scheduling Operations, Scheduling Operations
- scripts, Running Scripts as Operations for JBoss Servers
- setting alert operations, Setting Alert Operations
- timeout defaults, Setting an Operation Timeout Default
- timeouts, About Scheduling Operations
- viewing history, Viewing the Operation History
R
- reports
- alert definitions, Viewing the Alert Definitions Report
- resources
- enabling and disabling metric collection, Enabling and Disabling Metrics for a Specific Resource
- monitoring, Monitoring Resources: An Introduction
- monitoring and recalculating baselines, Recalculating Baseline Values
- monitoring collection intervals, Setting Collection Intervals for a Specific Resource
- setting alerts, Setting Alerts for a Resource
- viewing alerts for specific resources, Viewing Alert Details for a Specific Resource
- response time filters
- configuring Apache, Configuring Apache Servers for Response Time Metrics
- configuring for monitoring, Configuring Response Time Filters for Monitoring Web Servers
- configuring Tomcat, Configuring Response Time Filters for Tomcat
S
- scripts
- as operations, Running Scripts as Operations for JBoss Servers
- initiating from alerts
- SNMP
- alert notification, Configuring the SNMP Alert Notification
- and JBoss ON, JBoss ON SNMP Information
- configuring alerts, Configuring the SNMP Alert Plug-in
- configuring for alerts, Configuring SNMP for Notifications
- configuring the Apache module, Configuring the Apache SNMP Module
T
- tokens
- alerts and operations, Using Tokens with Alert Operations
- Tomcat
- configuring response time filters, Configuring Response Time Filters for Tomcat
- monitoring configuration, Configuring Tomcat/EWS Servers for Monitoring
Legal Notice
Copyright © 2011 Red Hat, Inc..
This document is licensed by Red Hat under the Creative Commons Attribution-ShareAlike 3.0 Unported License. If you distribute this document, or a modified version of it, you must provide attribution to Red Hat, Inc. and provide a link to the original. If the document is modified, all Red Hat trademarks must be removed.
Red Hat, as the licensor of this document, waives the right to enforce, and agrees not to assert, Section 4d of CC-BY-SA to the fullest extent permitted by applicable law.
Red Hat, Red Hat Enterprise Linux, the Shadowman logo, JBoss, OpenShift, Fedora, the Infinity logo, and RHCE are trademarks of Red Hat, Inc., registered in the United States and other countries.
Linux® is the registered trademark of Linus Torvalds in the United States and other countries.
Java® is a registered trademark of Oracle and/or its affiliates.
XFS® is a trademark of Silicon Graphics International Corp. or its subsidiaries in the United States and/or other countries.
MySQL® is a registered trademark of MySQL AB in the United States, the European Union and other countries.
Node.js® is an official trademark of Joyent. Red Hat Software Collections is not formally related to or endorsed by the official Joyent Node.js open source or commercial project.
The OpenStack® Word Mark and OpenStack logo are either registered trademarks/service marks or trademarks/service marks of the OpenStack Foundation, in the United States and other countries and are used with the OpenStack Foundation's permission. We are not affiliated with, endorsed or sponsored by the OpenStack Foundation, or the OpenStack community.
All other trademarks are the property of their respective owners.