
Chapter 7. Web Administration Interface Navigation
7.1. Web Administration Default Landing Interface
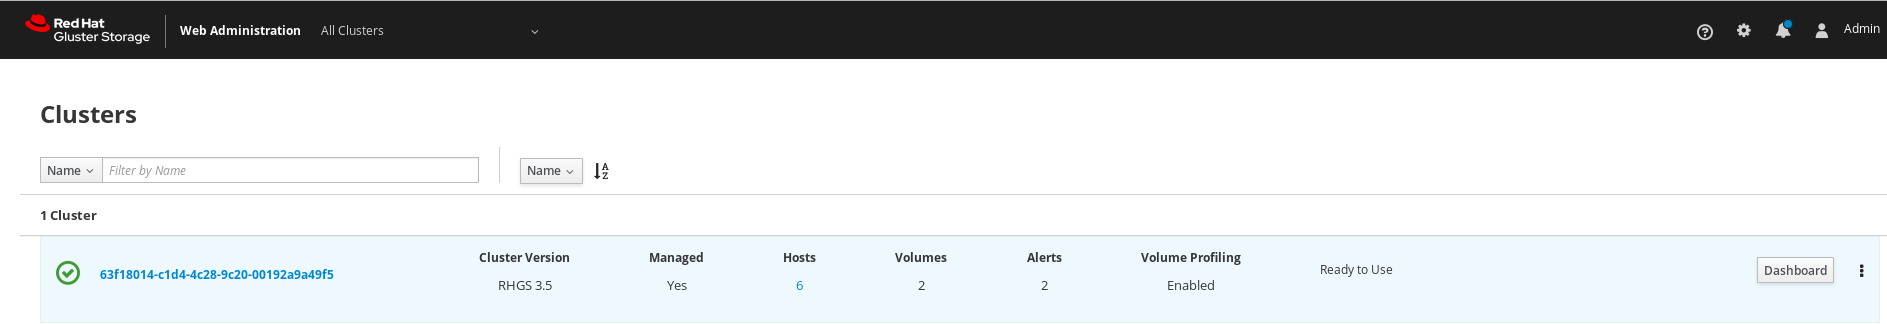
After logging in to the Web Administration interface, all the managed and unmanaged clusters are displayed in a rows format with the corresponding cluster attributes.
To identify the version of Red Hat Gluster Storage installed, see the Cluster Version attribute.
Managed cluster are the clusters that are successfully imported by Web administration for monitoring purposes. Unmanaged clusters are the clusters that are ready to be imported by Web Administration.
Cluster Attributes

The following are the cluster attributes that are displayed in the cluster row:
- Cluster name: the name of the cluster
- Cluster Version: the version of Red Hat Gluster Storage installed
- Managed: whether the cluster is imported or ready to be imported
- Hosts: the number of hosts or nodes part of the cluster
- Volumes: the number of volumes part of the hosts
- Alerts: the number of alerts generated by the system for different tasks
Volume Profiling: whether Enabled, Disabled or Mixed
NoteMixed cluster attribute signifies a cluster containing at least one volume with profiling enabled and at least one with profiling disabled.
Cluster Status: whether the cluster is ready for use or ready to be imported. The cluster state from the following:
- Ready for Use
- Ready to be Imported
- Ready for expansion
- Tasks in progress
Actionable Buttons: the Import button, monitoring Dashboard button and an inline menu for the following administrative operations:
- Enable and disable volume profiling
- Unmanage Cluster
- Expand Cluster
To identify managed and unmanaged clusters, view the cluster attributes.
Unmanaged Cluster: An unmanaged cluster displays the Managed attribute as No.
Managed Cluster: A managed cluster displays the Managed attribute as Yes.
Accessing Monitoring Dashboard
The Clusters tab provides a shortcut button to access the Grafana Monitoring Dashboard. At the right hand side of a cluster row, click on Dashboard and you will be redirected to the Grafana Monitoring dashboard.
7.2. Web Administration Interface Switcher
The Web Administration interface provides a menu to select and switch interface views displaying a common clusters interface and a cluster-specific interface.

Accessing Interface Switcher
At the top left of the default landing page, next to the label Red Hat Gluster Storage Web Administration, a drop-down menu is available.
The drop-down menu provides:
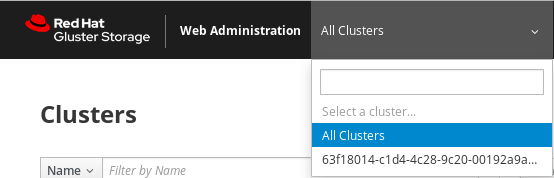
- All Clusters view: the default selection after logging in that displays all managed and unmanaged clusters.
- Cluster-specific view: option to select a specific managed cluster.
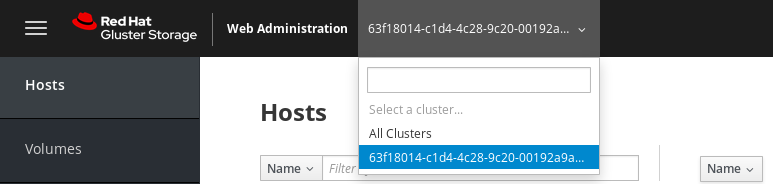
To select a cluster-specific Interface, click on the down-down menu and select the specific managed cluster.
Only managed clusters are available to select in the drop-down menu
The cluster-specific interface is displayed with a left navigation pane for Hosts, Volumes, Tasks, and Events associated with the selected cluster.
To switch back to the default landing interface view displaying all clusters, select All Clusters from the drop-down menu.
7.3. Web Administration Cluster-specific Interface Navigation
The cluster-specific interface provides a vertical navigation pane available at the left hand side of the interface to conveniently access the different elements of the clusters.
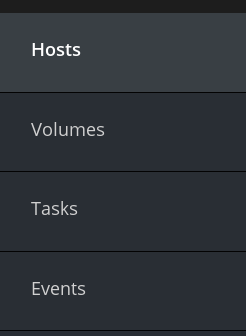
The navigation pane provides access to the following menus:
- Hosts: hosts view and monitoring dashboard shortcut
- Volumes: Volumes view and monitoring dashboard shortcut
- Tasks: view completed and failed system tasks
- Events: view all the system-wide events
7.3.1. Clusters View and Monitoring Dashboard Shortcut
The Clusters tab in the navigation pane lists all the imported clusters in a rows format. Each row shows the individual cluster attributes such as the version of the cluster, whether managed or unmanaged and the status of Volume Profiling whether enabled or disabled.
Figure 7.1. Clusters View
Accessing Monitoring Dashboard
The Clusters tab provides a shortcut button to access the Grafana Monitoring Dashboard. At the right hand side of a cluster row, click on Dashboard and you will be redirected to the Grafana Monitoring dashboard.
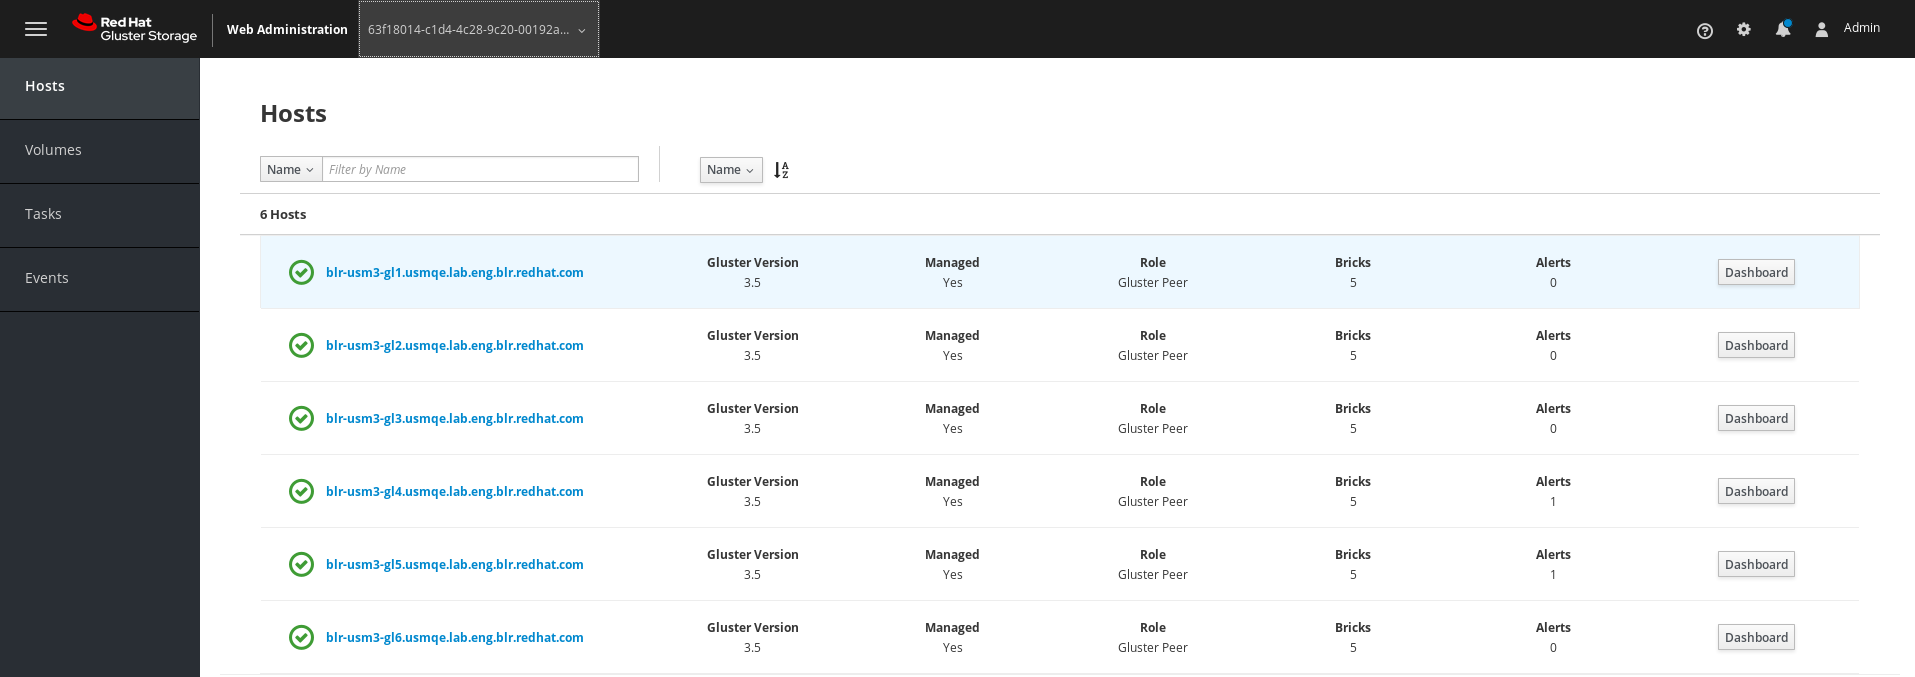
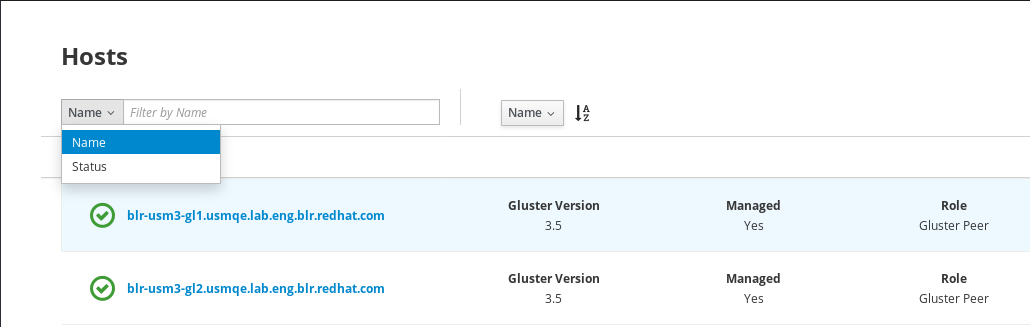
7.3.2. Hosts View and Monitoring Dashboard Shortcut
The Hosts tab in the navigation pane lists all the accepted hosts assigned to different clusters. The Hosts can be filtered by the Host Name or Status.
Figure 7.2. Hosts View
Accessing Monitoring Dashboard
The Hosts tab provides a shortcut button to access the Grafana Monitoring Dashboard. At the right hand side of a Host row, click on Dashboard, and you will be redirected to the Grafana Monitoring dashboard.
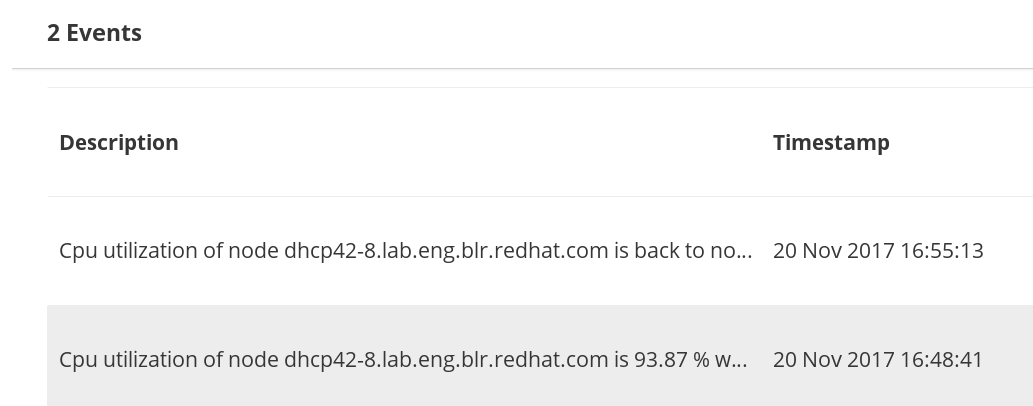
7.3.3. Events View
The Events view lists all the events occurred in the system. To view more detail of a specific event: copy the task ID or the job ID if available in the event listing to the task ID filter of the Tasks view interface.
Figure 7.3. Events View
7.3.4. Tasks View
The Web Administration consists of a sizeable number of user-initiated actions to accomplish operations such as importing clusters. It is crucial for Web Administration users to monitor and view the status of the actions they initiated.
A user can view the following task information:
- The status of an initiated task whether completed or failed
- The details of all past and present cluster-wide initiated actions
- The timestamp of the initiated task
- Retrieve a specific task by using the available filters
Figure 7.4. Tasks View
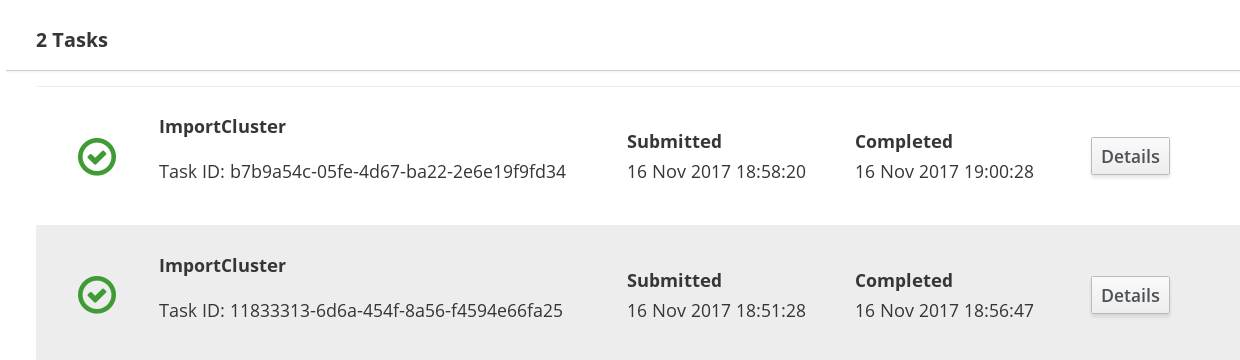
Tasks can filtered by Task ID, Task name, the status of the task and the time interval.
The Task details will remain in the Web Administration interface for not more than the default Time to live (TTL) of 2 days. Once the timespan has elapsed, the task details will be discarded from the system.
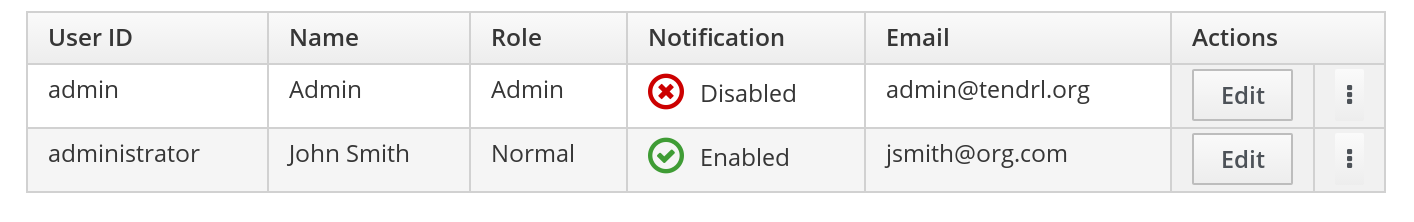
7.3.5. Admin and Users
The Users tab lists all the users created to access the Web Administration interface. The interface provides user tasks such as adding, editing and deleting a user. For more user administration actions, see the Users and Roles Administration chapter of the Red Hat Gluster Storage Web Administration Monitoring Guide.
7.3.6. Alerts and User Settings
To view system-wide notifications and to change the user password, a menubar is available at the top right corner of the interface.
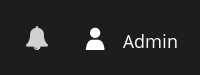
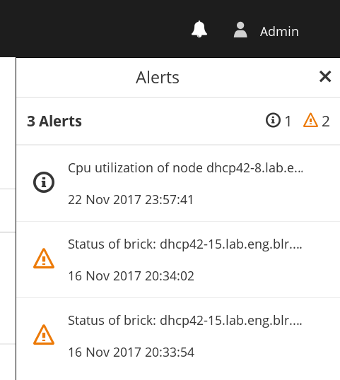
To view system-wide alerts, click on the bell icon at the top right menubar of the interface.
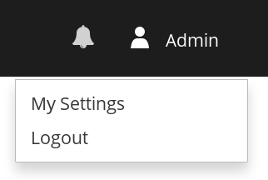
Changing User Password
To change the user password:
Click on the user icon from the menu bar.
Click My Settings.
- A dialog window is opened. Enter the new password twice and click Save.

Email notifications are disabled by default. To enable, check the Email Notifications box. For email notifications configuration instructions, see the SMTP Notifications Configuration section of the Red Hat Gluster Storage Web Administration Monitoring Guide.
Logging out from the interface
To log out from the interface:
- Click on the user icon from the menu bar.
- Click Logout.