Chapter 9. Monitoring Dashboard Navigation
To access the Monitoring Dashboard, follow these steps:
- Log in to the Web Administration interface at http://web-admin-server.example.com.
- In the default Cluster view, locate the cluster and click Launch Dashboard.
- The Cluster dashboard showing the aggregated metrics view is opened in a new window.
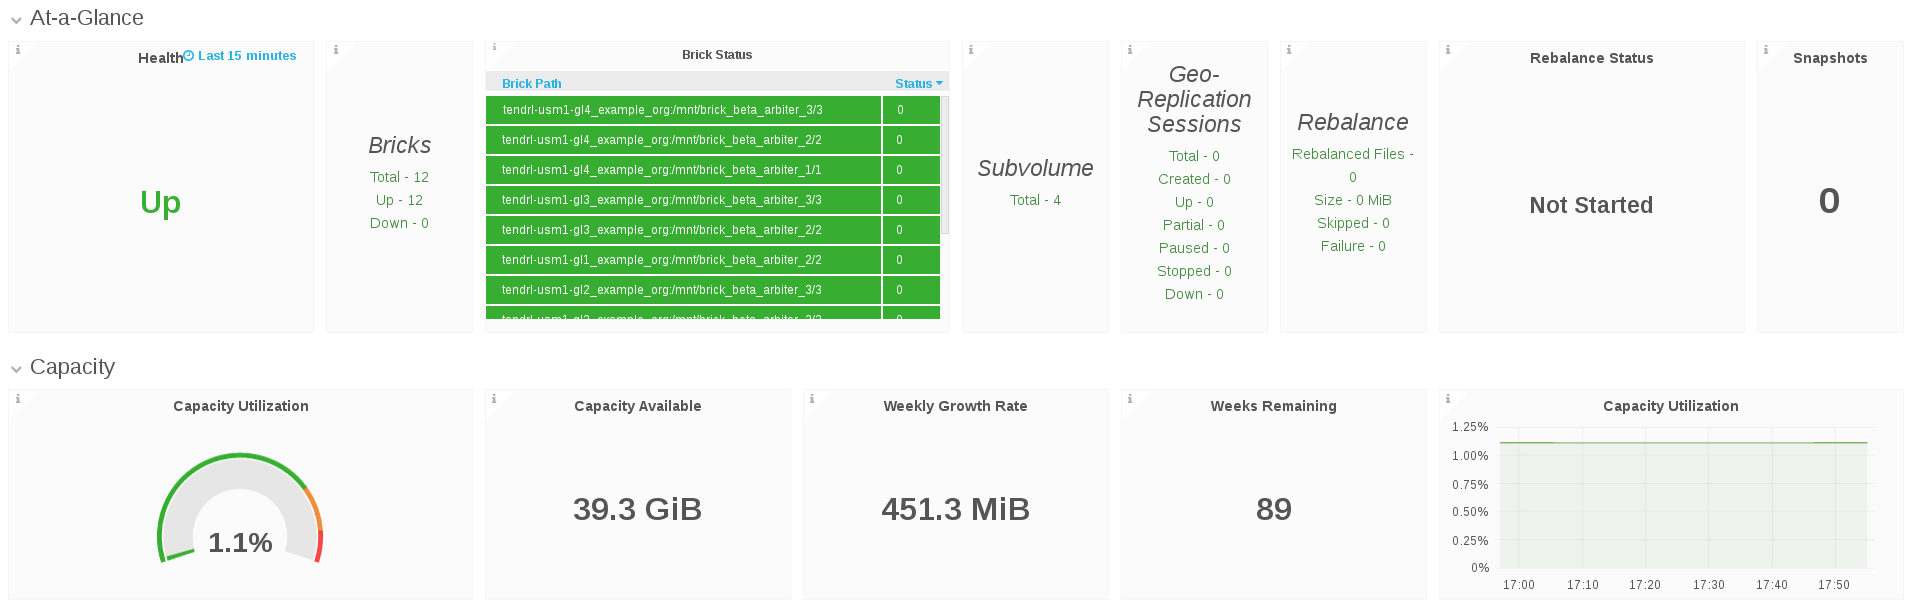
9.1. Cluster View Dashboard
The Cluster view dashboard allows the Gluster Administrator to:
- View at-a-glance information about the Gluster cluster that includes health and status information, key performance indicators such as IOPS, throughput, etc, and alerts that can highlight attention to potential issues in the cluster, host, volume, and brick.
- Compare a metric such as IOPS, CPU, Memory, Network Load across hosts within the cluster.
- Compare utilization across bricks within a volume, for example, IOPS, capacity, etc.
Figure 9.1. Cluster View Dashboard

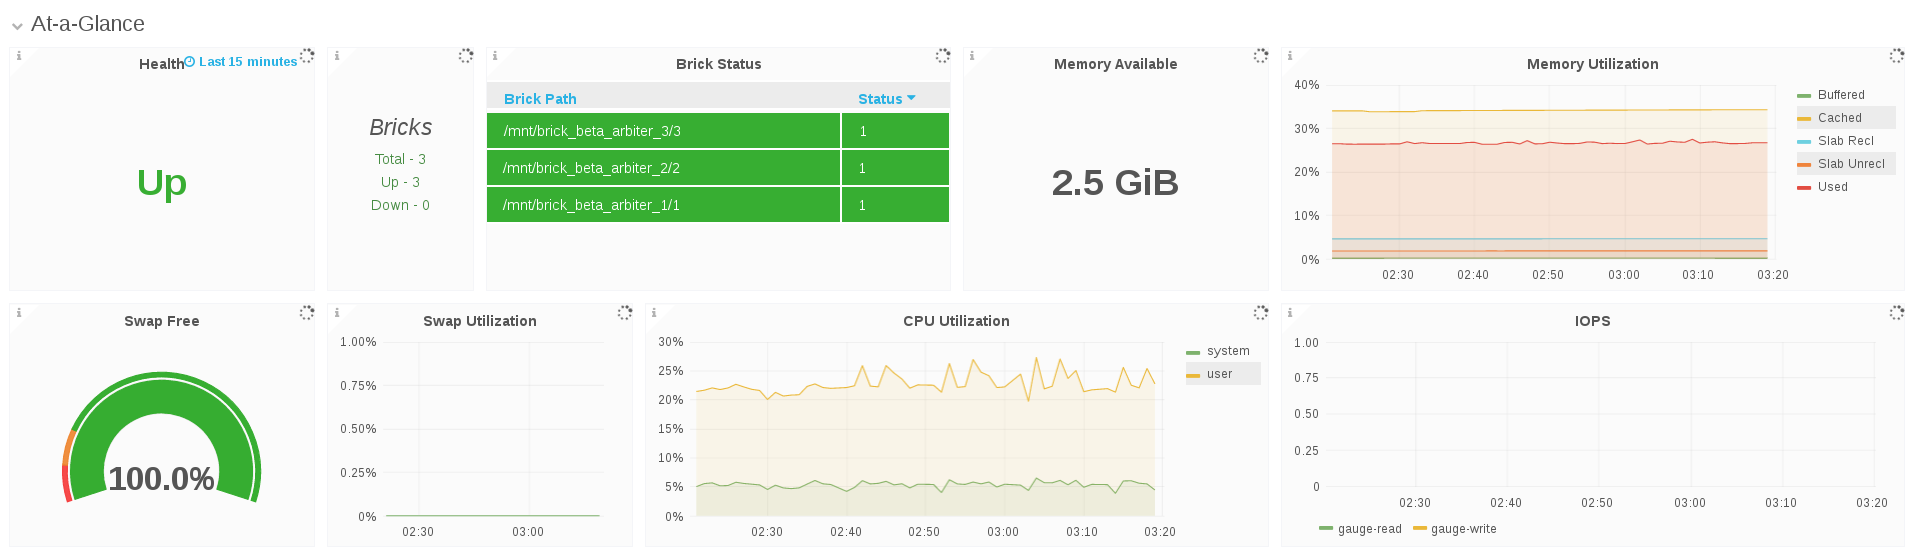
9.2. Hosts View Dashboard
The Host view Dashboard allows the Gluster Administrator to:
- View at-a-glance information about the Gluster host that includes health and status information, key performance indicators such as IOPS, throughput, etc and alerts that highlights attention to potential issues in the host, volume, brick, and disk.
- Compare one or more metrics such as IOPS, CPU, Memory, Network Load across bricks within the host.
- Compare utilization such as IOPS, capacity, etc across bricks within a host.
9.3. Volume View Dashboard
The Volume view Dashboard allows the Gluster Administrator to:
- View at-a-glance information about the Gluster Volume that includes health and status information, key performance indicators that highlights attention to potential issues in the volume, brick, and disk.
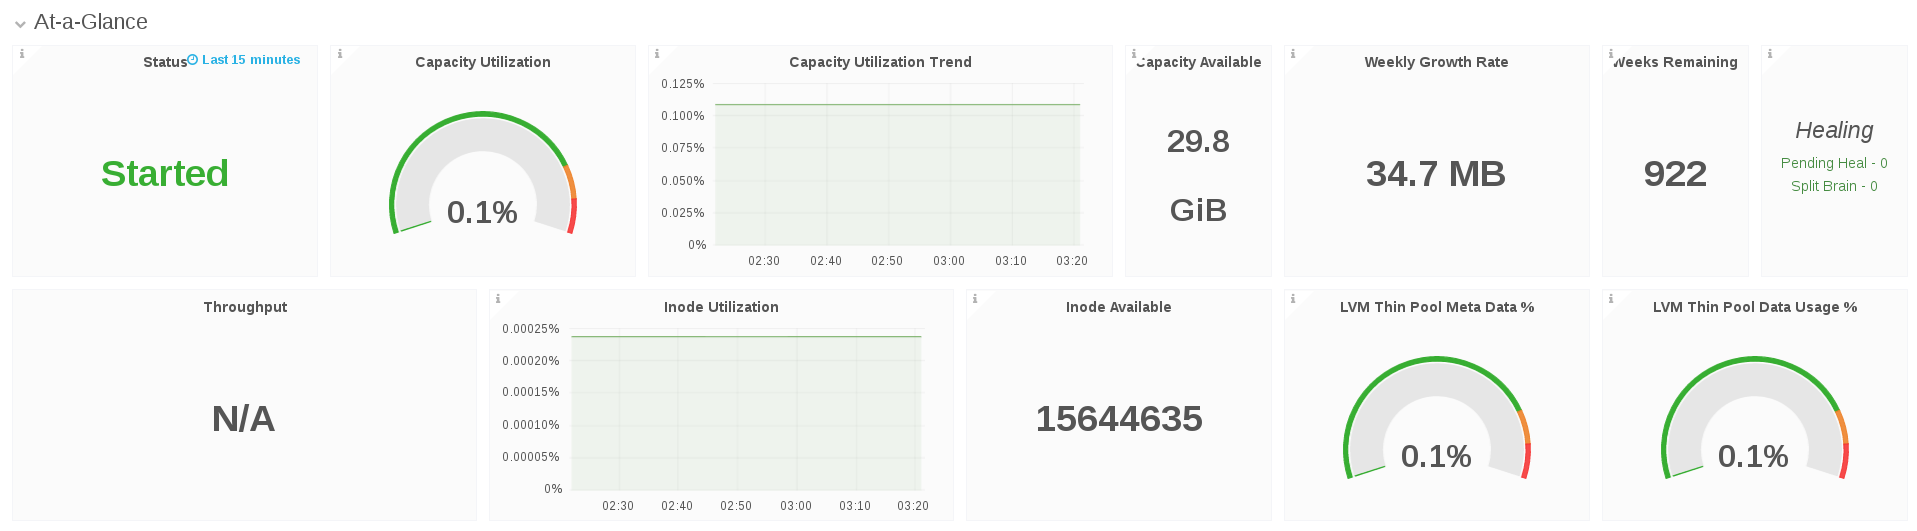
9.4. Brick View Dashboard
The Brick view dashboard allows the Gluster Administrator to:
- View at-a-glance information about the Gluster brick that includes health and status information, key performance indicators such as IOPS, throughput, latency, etc and alerts that can highlight attention to potential issues in the brick and underlying disks.
- Look at performance by brick to address diagnosing of RAID 6 disk failure/rebuild/degradation poor performance on one brick.