
Chapter 2. Import Cluster
You can import and start managing a cluster once Web Administration is installed and ready. For installation instructions, see the Installing Web Administration chapter of the Red Hat Gluster Storage Web Administration Quick Start Guide.
2.1. Importing Cluster
The following procedure outlines the steps to import a Gluster cluster.
Procedure. Importing Cluster
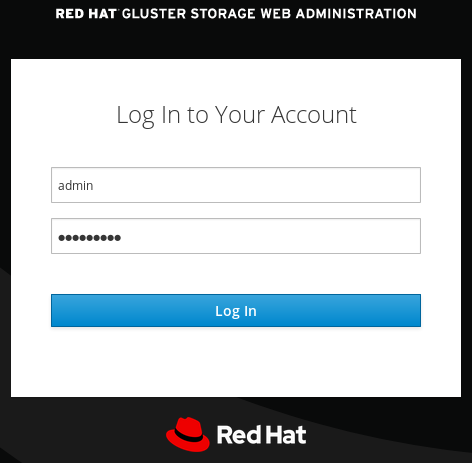
Log in to the Web Administration interface. Enter the username and password, and click Log In.
NoteThe default username is admin and the default password is adminuser.
Figure 2.1. Login Page
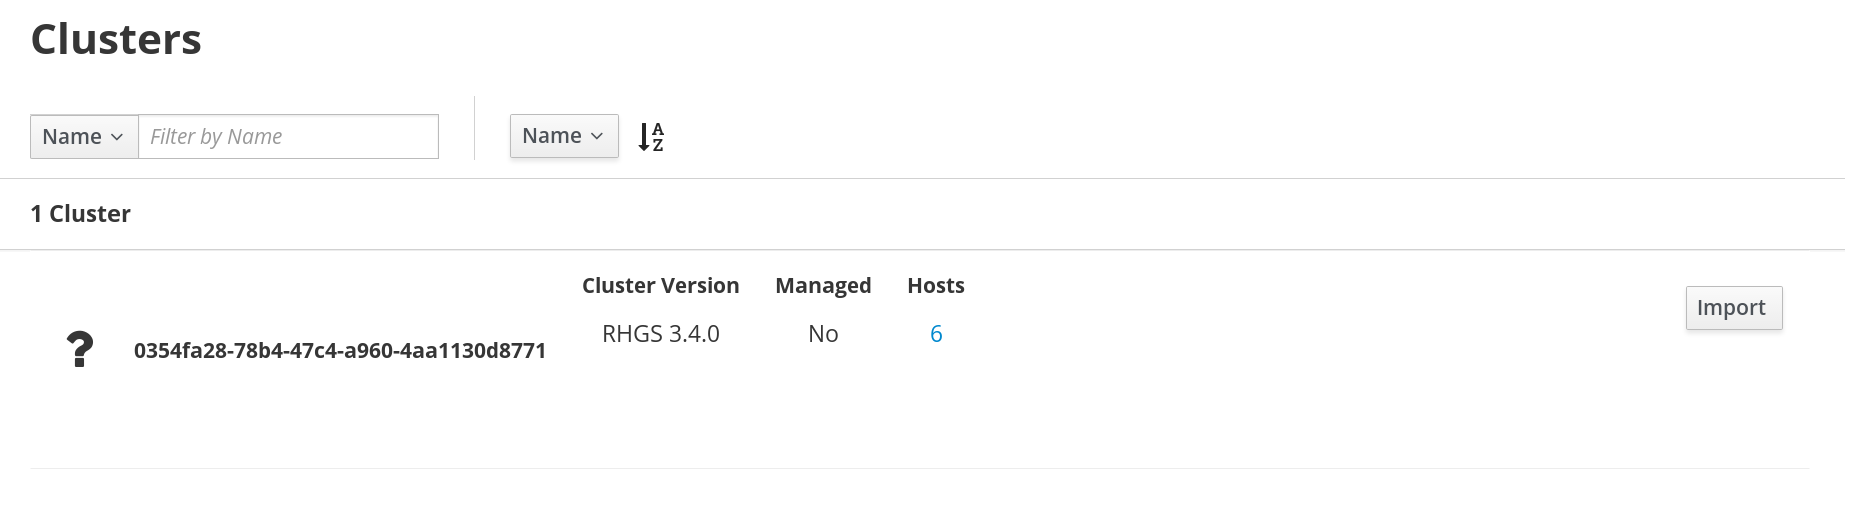
In the default landing interface, a list of all the clusters ready to be imported is displayed. Locate the cluster to be imported and click Import.
Figure 2.2. Import Cluster
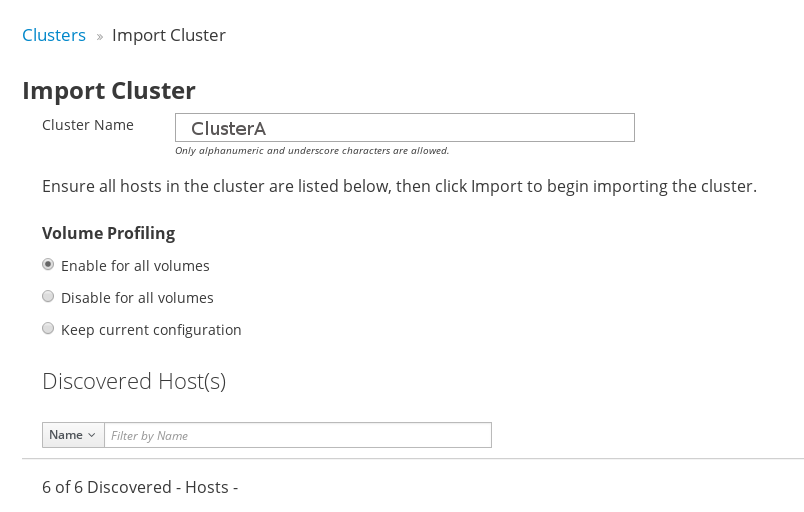
Enter a user-friendly Cluster name. By default, the Enable for all volumes option is selected.
Figure 2.3. Cluster name
 Note
NoteIf the cluster name is not provided, the system will assign a randomly generated uuid as a cluster name. However, it is advisable to enter a user-friendly cluster name to easily locate the cluster from the clusters list.
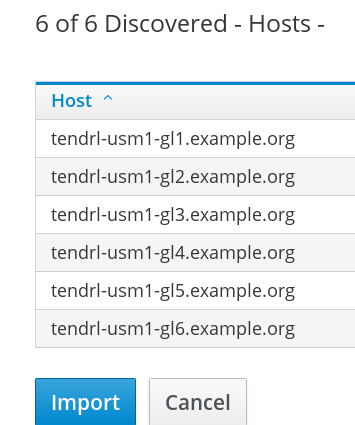
- Click Import to continue.
The cluster import request is submitted. To view the task progress, click View Task Progress.
Figure 2.4. Task Detail

- Navigate to the All Clusters interface view. The Cluster is successfully imported and ready for use.
Figure 2.5. Cluster Ready
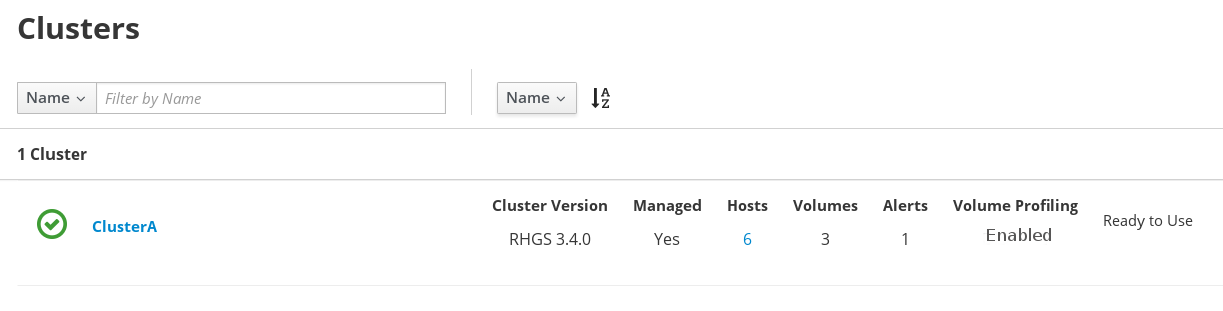
2.1.1. Troubleshooting Import Cluster
Scenario: The Import cluster UI button is disabled after a failed cluster import operation.
In this scenario, when cluster import fails, the Import button is disabled.
Resolution
Resolve the issue by investigating why the import cluster operation failed. To see details of the failed operation, navigate to the All Clusters interface of the Web Administration environment. In the clusters list, locate the cluster that you attempted to import and click on View Details next to the Import Failed status label.
Examine the reason of the failed cluster import operation and resolve the issue. After resolving the issue, unmanage the cluster and then reimport the cluster. For unmanaging cluster instructions, navigate to the Unmanaging Cluster section of this Guide.
2.1.2. Volume Profiling
Volume profiling enables additional telemetry information to be collected on a per volume basis for a given cluster, which helps in troubleshooting, capacity planning, and performance tuning.
Volume profiling can be enabled or disabled on a per cluster basis and per volume basis when a cluster is actively managed and monitored using the Web Administration interface.
Enabling volume profiling results in richer set of metrics being collected which may cause performance degradation to occur as system resources, for example, CPU and memory, may get used for volume profiling data collection.
Volume Profiling at Cluster Level
To enable or disable volume profiling at cluster level:
- Log in to the Web Administration interface
From the Clusters list, locate the cluster to disable Volume Profiling.
NoteClusters list is the default landing interface after login and the Interface switcher is on All Clusters.
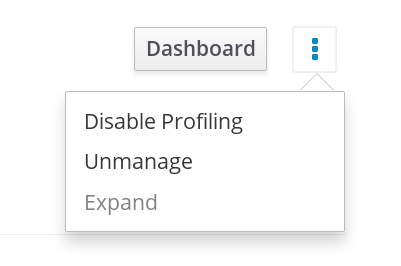
- At the right-hand side, next to the Dashboard button, click the vertical ellipsis.
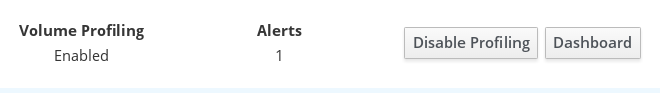
An inline menu is opened. Click Disable Profiling or Enable Profiling depending on the current state. In the example screen below, Volume Profiling option is enabled. Click Disable Profiling to disable.
Figure 2.6. Disable Volume Profiling
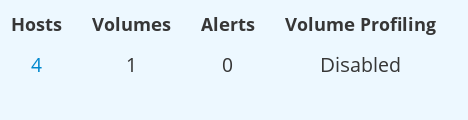
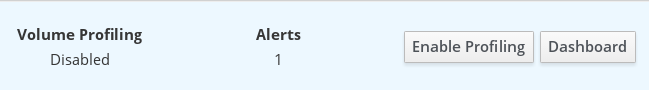
- The disable profiling task is submitted and processed. After processing, Volume Profiling is successfully disabled.
Figure 2.7. Disable Volume Profiling
Volume Profiling at Volume Level
To enable or disable volume profiling at Volume level:
- Log in to the Web Administration interface and select the specific cluster from the Interface switcher drop-down.
- After selecting the specific cluster, the left vertical navigation pane is exposed.
From the navigation pane, click Volumes. The Volumes view is displayed listing all the Volumes part of the cluster.
Figure 2.8. Volumes View

Locate the volume and click Disable Profiling or Enable Profiling depending on the current state. In the example screen below, Volume Profiling is enabled. To disable volume profiling, click Disable Profiling.
Figure 2.9. Disable Volume Profiling
- The disable profiling task is submitted and processed. After processing, Volume Profiling is successfully disabled.
Figure 2.10. Disable Volume Profiling
Volume Profiling Metrics
When volume profiling is disabled, the following metrics will not be displayed in the Grafana Dashboard. Based on the metrics required to view, enable or disable volume profiling accordingly.
For detailed information on Volume Profiling, see the Monitoring Red Hat Gluster Storage Gluster Workload chapter of the Red Hat Gluster Storage Administration Guide.
Table 2.1. Volume Profiling Metrics
| Grafana Dashboard Level | Dashboard Section | Panel and Metrics |
|---|---|---|
| Cluster Dashboard | At-a-glance | IOPS |
| Host Dashboard | At-a-glance | Brick IOPS |
| Volume Dashboard | Performance | IOPS |
| Volume Dashboard | Profiling Information | File Operations For Locks |
| Volume Dashboard | Profiling Information | Top File Operations |
| Volume Dashboard | Profiling Information | File Operations for Read/Write |
| Volume Dashboard | Profiling Information | File Operations for Inode Operations |
| Volume Dashboard | Profiling Information | File Operations for Entry Operations |
| Brick Dashboard | At-a-glance | IOPS |