
Chapter 4. Monitor and manage Red Hat Fuse applications on EAP standalone
4.1. About the Fuse Console
The Red Hat Fuse Console is a web console based on HawtIO open source software. For a list of supported browsers, go to Supported Configurations.
The Fuse Console provides a central interface to examine and manage the details of one or more deployed Fuse containers. You can also monitor Red Hat Fuse and system resources, perform updates, and start or stop services.
The Fuse Console is available when you install Red Hat Fuse standalone or use Fuse on OpenShift. The integrations that you can view and manage in the Fuse Console depend on the plugins that are running. Possible plugins include:
- Camel
- JMX
- Spring Boot
- OSGI
- Runtime
- Logs
4.2. Accessing the Fuse Console
Follow these steps to access the Fuse Console for Red Hat JBoss Enterprise Application Platform.
Prerequisite
You must install Fuse on the JBoss EAP container. For step-by-step instructions, see Installing on JBoss EAP.
Procedure
To access the Fuse Console for a standalone JBoss EAP distribution:
Start Red Hat Fuse standalone with the following command:
On Linux/Mac OS:
./bin/standalone.shOn Windows:
./bin/standalone.bat-
In a web browser, enter the URL to connect to the Fuse Console. For example:
http://localhost:8080/hawtio - In the login page, enter your user name and password and then click Log In.
By default, the Fuse Console shows the Home page. The left navigation tabs indicate the running plugins.
If the main Fuse Console page takes a long time to display in the browser, you might need to reduce the number and the size of the log files. You can use the periodic-size-rotating-file-handler to rotate the file when it reaches a maximum size (rotate-size) and maintains a number of files (max-backup-index). For details on how to use this handler, see the Red Hat JBoss Enterprise Application Platform product documentation.
4.3. Securing the Fuse Console
To secure the Fuse Console on EAP, you can:
Set HTTPS as the required protocol
You can use the
hawtio.http.strictTransportSecurityproperty to require web browsers to use the secure HTTPS protocol to access the Fuse Console. This property specifies that web browsers that try to use HTTP to access the Fuse Console must automatically convert the request to use HTTPS.Use public keys to secure responses
You can use the
hawtio.http.publicKeyPinsproperty to secure the HTTPS protocol by telling the web browser to associate a specific cryptographic public key with the Fuse Console to decrease the risk of “man-in-the-middle” attacks with forged certificates.
Procedure
Set the hawtio.http.strictTransportSecurity and the hawtio.http.publicKeyPins properties in the system-properties section of the $EAP_HOME/standalone/configuration/standalone*.xml file as shown in the following example:
+
<property name="hawtio.http.strictTransportSecurity" value="max-age=31536000; includeSubDomains; preload"/>
<property name="hawtio.http.publicKeyPins" value="pin-sha256=cUPcTAZWKaASuYWhhneDttWpY3oBAkE3h2+soZS7sWs"; max-age=5184000; includeSubDomains"/>
Additional resources
-
For a description of the
hawtio.http.strictTransportSecurityproperty’s syntax, see the description page for the HTTP Strict Transport Security (HSTS) response header. -
For a description of the
hawtio.http.publicKeyPinsproperty’s syntax, including instructions on how to extract the Base64 encoded public key, see the description page for the HTTP Public Key Pinning response header.
4.4. Ensuring that data displays correctly in the Fuse Console
If the display of the queues and connections in the Fuse Console is missing queues, missing connections, or displaying inconsistent icons, adjust the Jolokia collection size parameter that specifies the maximum number of elements in an array that Jolokia marshals in a response.
Procedure
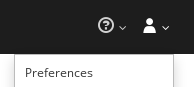
In the upper right corner of the Fuse Console, click the user icon and then click Preferences.
- Increase the value of the Maximum collection size option (the default is 50,000).
- Click Close.
4.5. Disabling the Fuse Console
You can disable the Fuse Console on JBoss EAP so that it becomes inaccessible to all users without affecting any other component.
Procedure
To disable the Fuse Console on JBoss EAP, do one of the following:
-
Remove the Fuse Console deployment file:
$EAP_HOME/standalone/deployments/hawtio-wildfly-xxxxx.war - Undeploy the Fuse Console by using the JBoss EAP admin console or command line interface.
4.6. Connecting to remote Fuse applications
The Fuse Console uses Jolokia, an agent-based approach to Java Management Extensions (JMX) that requires extra software (an agent) installed on the client. By default, Red Hat Fuse includes a jolokia agent.
With standalone Fuse Console distributions, you can connect to remote integrations that already have a jolokia agent (https://jolokia.org/) running inside them. If the process that you want to connect to does not have a jolokia agent inside, refer to the jolokia documentation (http://jolokia.org/agent.html).
4.6.1. Unlocking the Fuse Console
By default, Jolokia for Fuse 7 standalone on JBoss EAP) is locked and the Fuse Console is not accessible remotely.
To unlock the Fuse Console for a hostname or IP address other than locahost or 127.0.0.1, follow these steps:
-
Open the
$EAP_HOME/standalone/configuration/jolokia-access.xmlfile in an editor. Register the hostnames or IP addresses for the Fuse integrations that you want to access with the Fuse console by adding them to the <cors> section.
For example, to access hostname 0.0.0.3 from the Fuse Console, add the
*<allow-origin>http://0.0.0.3:*</allow-origin>*
line as shown:
<!-- Cross-Origin Resource Sharing (CORS) restrictions By default, only CORS access within localhost is allowed for maximum security. You can add trusted hostnames in the <cors> section to unlock CORS access from them. --> <cors> <!-- Allow cross origin access only within localhost --> <allow-origin>http*://localhost:*</allow-origin> <allow-origin>http*://127.0.0.1:*</allow-origin> <allow-origin>http://0.0.0.3:*</allow-origin> <!-- Whitelist the hostname patterns as <allow-origin> --> <!-- <allow-origin>http*://*.example.com</allow-origin> <allow-origin>http*://*.example.com:*</allow-origin> --> <!-- Check for the proper origin on the server side to protect against CSRF --> <strict-checking /> </cors>- Save the file.
4.6.2. Restricting remote access
Optionally, you can restrict remote access to the Fuse Console for specific hosts and IP addresses.
You can grant overall access based on the IP address of an HTTP client. To specify these restrictions:
In the jolokia-access.xml file, add or edit a <remote> section that contains one or more <host> elements. For the <host> element, you can specify an IP address, a host name, or a netmask given in CIDR format (for example, 10.0.0.0/16 for all clients coming from the 10.0 network).
The following example allows access from localhost and all clients whose IP addresses start with 10.0. For all other IP addresses, access is denied.
<remote>
  <host>localhost</host>
  <host>10.0.0.0/16</host>
</remote>
For more details, see the Jolokia security documentation (https://jolokia.org/reference/html/security.html).
4.6.3. Allowing connections to remote Fuse instances
The Fuse Console’s proxy servlet uses whitelist host protection, with which by default the Fuse Console can only connect to localhost. If you want to connect the Fuse Console to other remote Fuse instances, make the following configuration changes in the standalone/configuration/standalone-*.xml file:
+
<property name=hawtio.proxyWhitelist" value="localhost, 127.0.0.1, myhost1, myhost2, myhost3"/>
4.6.4. Connecting to a remote Jolokia agent
Before you begin, you need to know the connection details (host name, port, and path) of the remote Jolokia agent.
The default connection URLs for the Jolokia agent on Red Hat JBoss EAP is http://<host>:8080/hawtio/jolokia.
As a system administrator, you can change this default.
Typically, the URL to remotely connect to a Jolokia agent is the URL to open the Fuse Console plus /jolokia. For example, if the URL to open the Fuse Console is http://<host>:1234/hawtio, then the URL to remotely connect to it would probably be http://<host>:1234/hawtio/jolokia.
To connect to a remote Jolokia instance so that you can examine its JVM:
- Click the Connect tab.
- Click the Remote tab, and then Add connection.
- Type the Name, Scheme (HTTP or HTTPS), and the hostname.
- Click Test Connection.
- Click Add.
The Fuse Console automatically probes the local network interfaces other than localhost and 127.0.0.1 and adds them to the whitelist. Hence, you do not need to manually register the local machine’s addresses to the whitelist.
4.6.5. Setting data moving preferences
You can change the following Jolokia preferences, for example, if you want to more frequently refresh data that displays in the Fuse Console. Note that increasing the frequency of data updates impacts networking traffic and increases the number of requests made to the server.
- Update rate - The period between polls to Jolokia to fetch JMX data (the default is 5 seconds).
- Maximum depth - The number of levels that Jolokia will marshal an object to JSON on the server side before returning (the default is 7).
- Maximum collection size - The maximum number of elements in an array that Jolokia marshals in a response (the default is 50,000).
To change the values of these settings:
In the upper right of the Fuse Console, click the user icon and then click Preferences.
- Edit the options and then click Close.
4.6.6. Viewing JVM runtime information
To view JVM runtime information, such as system properties, metrics, and threads, click the Runtime tab.
4.7. Viewing and managing Apache Camel applications
In the Fuse Console’s Camel tab, you view and manage Apache Camel contexts, routes, and dependencies.
You can view the following details:
- A list of all running Camel contexts
- Detailed information of each Camel context such as Camel version number and runtime statics
- Lists of all routes in each Camel application and their runtime statistics
- Graphical representation of the running routes along with real time metrics
You can also interact with a Camel application by:
- Starting and suspending contexts
- Managing the lifecycle of all Camel applications and their routes, so you can restart, stop, pause, resume, etc.
- Live tracing and debugging of running routes
- Browsing and sending messages to Camel endpoints
Prerequisite
The Camel tab is only available when you connect to a container that uses one or more Camel routes.
4.7.1. Start, suspend, or delete a context
- In the Camel tab’s tree view, click Camel Contexts.
- Check the box next to one or more contexts in the list.
- Click Start or Suspend.
To delete a context:
- Stop the context.
- Click the ellipse icon and then select Delete from the dropdown menu.
When you delete a context, you remove it from the deployed application.
4.7.2. View Camel application details
- In the Camel tab’s tree view, click a Camel application.
- To view a list of application attributes and values, click Attributes.
- To view a graphical representation of the application attributes, click Chart and then click Edit to select the attributes that you want to see in the chart.
- To view inflight and blocked exchanges, click Exchanges.
- To view application endpoints, click Endpoints. You can filter the list by URL, Route ID, and direction.
- To view, enable, and disable statistics related to the Camel built-in type conversion mechanism that is used to convert message bodies and message headers to different types, click Type Converters.
- To view and execute JMX operations, such as adding or updating routes from XML or finding all Camel components available in the classpath, click Operations.
4.7.3. View a list of the Camel routes and interact with them
To view a list of routes:
- Click the Camel tab.
In the tree view, click the application’s routes folder:

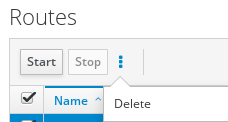
To start, stop, or delete one or more routes:
- Check the box next to one or more routes in the list.
- Click Start or Stop.
To delete a route, you must first stop it. Then click the ellipse icon and select Delete from the dropdown menu.
 Note
Note- When you delete a route, you remove it from the deployed application.
- You can also select a specific route in the tree view and then click the upper-right menu to start, stop, or delete it.
- To view a graphical diagram of the routes, click Route Diagram.
- To view inflight and blocked exchanges, click Exchanges.
- To view endpoints, click Endpoints. You can filter the list by URL, Route ID, and direction.
- Click Type Converters to view, enable, and disable statistics related to the Camel built-in type conversion mechanism, which is used to convert message bodies and message headers to different types.
To interact with a specific route:
- In the Camel tab’s tree view, select a route.
- To view a list of route attributes and values, click Attributes.
- To view a graphical representation of the route attributes, click Chart. You can click Edit to select the attributes that you want to see in the chart.
- To view inflight and blocked exchanges, click Exchanges.
- Click Operations to view and execute JMX operations on the route, such as dumping the route as XML or getting the route’s Camel ID value.
To trace messages through a route:
- In the Camel tab’s tree view, select a route.
- Select Trace, and then click Start tracing.
To send messages to a route:
- In the Camel tab’s tree view, open the context’s endpoints folder and then select an endpoint.
- Click the Send subtab.
- Configure the message in JSON or XML format.
- Click Send.
- Return to the route’s Trace tab to view the flow of messages through the route.
4.7.4. Debug a route
- In the Camel tab’s tree view, select a route.
- Select Debug, and then click Start debugging.
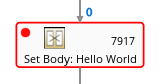
To add a breakpoint, select a node in the diagram and then click Add breakpoint. A red dot appears in the node:
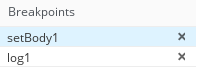
The node is added to the list of breakpoints:
- Click the down arrow to step to the next node or the Play button to resume running the route.
- Click the Pause button to suspend all threads for the route.
- Click Stop debugging when you are done. All breakpoints are cleared.
4.8. Viewing and managing JMX domains and MBeans
Java Management Extensions (JMX) is a Java technology that allows you to manage resources (services, devices, and applications) dynamically at runtime. The resources are represented by objects called MBeans (for Managed Bean). You can manage and monitor resources as soon as they are created, implemented, or installed.
With the JMX plugin on the Fuse Console, you can view and manage JMX domains and MBeans. You can view MBean attributes, run commands, and create charts that show statistics for the MBeans.
The JMX tab provides a tree view of the active JMX domains and MBeans organized in folders. You can view details and execute commands on the MBeans.
Procedure
To view and edit MBean attributes:
- In the tree view, select an MBean.
- Click the Attributes tab.
- Click an attribute to see its details.
To perform operations:
- In the tree view, select an MBean.
- Click the Operations tab, expand one of the listed operations.
- Click Execute to run the operation.
To view charts:
- In the tree view, select an item.
- Click the Chart tab.
4.9. Viewing diagnostics
Use the Diagnostics tab to view diagnostic information about the JVM via the JVM DiagnosticCommand and HotspotDiangostic interfaces.
The functionality is similar to the Diagnostic Commands view in Java Mission Control (jmc) or the command line tool jcmd. The plugin will provide corresponding jcmd commands in some scenarios.
Procedure
- To retrieve the number of instances of loaded classes and the amount of bytes they take up, click Class Histogram. If the operation is repeated, the tab shows the difference since last run.
- To view the JVM diagnostic flag setting, click the JVM flags.
- For a running JVM, you can also modify the flag settings.
Additional resources
The supported JVM depends on the platform, for more information go to one of the following sources:
4.10. Viewing threads
You can view and monitor the state of threads.
Procedure
- Click the Runtime tab and then the Threads subtab. The Threads page lists active threads and stack trace details for each thread. By default, the thread list shows all threads in descending ID order.
- To sort the list by increasing ID, click the ID column label.
- Optionally, filter the list by thread state (for example, Blocked) or by thread name.
- To drill down to detailed information for a specific thread, such as the lock class name and full stack trace for that thread, in the Actions column, click More.
4.11. Viewing log entries
You can view log entries for Red Hat Fuse in the Logs tab.
Prerequisite
The Logs tab is available when the Java application includes the Log MBean.
Procedure
To view a list of the log entries, click the Log Entries tab.
By default, the list shows log entries in ascending order.
You can drill down to each log entry to view detailed information about the log entry.
- To filter the list of logs to show specific log types, click the Action Bar. You can filter the log entries section according to a text string or the logging level.
To change the Fuse Console default settings:
In the upper right corner of the Fuse Console, click the user icon and then click Preferences from the drop-down menu.
- To change the default sorting order, select Server Logs and then click the log entry link to drill down to details about the log entry, such as the bundle name, thread, and the full message text.
Optionally, you can customize these settings for storing log messages:
- The number of log statements to keep in the Fuse Console (the default is 100).
- The global log level: INFO (the default), OFF, ERROR, WARN, and DEBUG.
-
The child-level messages to include, such as
hawtio-oauthandhawtio-core-utils.
- To reset the Fuse Console Logs settings to the default values, click Reset → Reset settings.