
Red Hat Training
A Red Hat training course is available for Red Hat Fuse
Chapter 6. Accessing Prometheus to monitor Fuse applications
You can use Prometheus to monitor and store Fuse on OpenShift data by exposing endpoints with your Fuse application’s data to Prometheus format. Prometheus stores the data so that you can use a graphical tool, such as Grafana, to visualize and run queries on the data.
You can use Prometheus to monitor Fuse applications that are running on an on-premise OpenShift cluster or on a single-node cluster, such as Minishift or the Red Hat Container Development Kit.
For information on installing and developing with Red Hat Fuse on OpenShift, see the Fuse on OpenShift Guide.
The following sections describe how to access Prometheus:
Using Prometheus to monitor Fuse applications on OpenShift Online is not supported.
6.1. Setting up Prometheus
To set up Prometheus, install the Prometheus operator custom resource definition on the cluster and then add Prometheus to an OpenShift project that includes a Fuse application.
Prerequisites
- You have system administrator access to the OpenShift cluster.
- You have prepared the OpenShift cluster by installing the Fuse on OpenShift images and templates as described in the Fuse on OpenShift Guide.
- You have created an OpenShift project on the cluster and added a Fuse application to it.
Procedure
Login to OpenShift with administrator permissions:
$ oc login -u system:admin
Install the custom resource definitions necessary for running the Prometheus operator, where
{$templates-base-url}is the location of the Fuse on OpenShift template files:$ oc create -f {$templates-base-url}\fuse-prometheus-crd.ymlThe Prometheus operator is now available to any namespace on the cluster.
Install the Prometheus operator to your namespace by using the following command syntax:
$ oc process -f {$templates-base-url}/fuse-prometheus-operator.yml -p NAMESPACE=<YOUR NAMESPACE> | oc create -f -For example, use this command for a project (namespace) named myproject:
oc process -f {$templates-base-url}/fuse-prometheus-operator.yml -p NAMESPACE=myproject | oc create -f -NoteThe first time that you install the Prometheus operator into a namespace, it might take a few minutes for the Prometheus resource pods to start. Subsequently, if you install it to other namespaces on your cluster, the Prometheus resource pods start much faster.
Instruct the Prometheus operator to monitor the Fuse application in the project by using the following command syntax::
$ oc process -f {$templates-base-url}/fuse-servicemonitor.yml -p NAMESPACE=<YOUR NAMESPACE> FUSE_SERVICE_NAME=<YOUR FUSE SERVICE> | oc apply -f -For example, use this command for an OpenShift project (namespace) named myproject that includes a Fuse application named myfuseapp:
oc process -f {$templates-base-url}/fuse-servicemonitor.yml -p NAMESPACE=myproject FUSE_SERVICE_NAME=myfuseapp | oc apply -f -To open the Prometheus dashboard:
- Login to the OpenShift console.
- Open the project to which you added Prometheus.
In the left pane, select Applications → Routes.
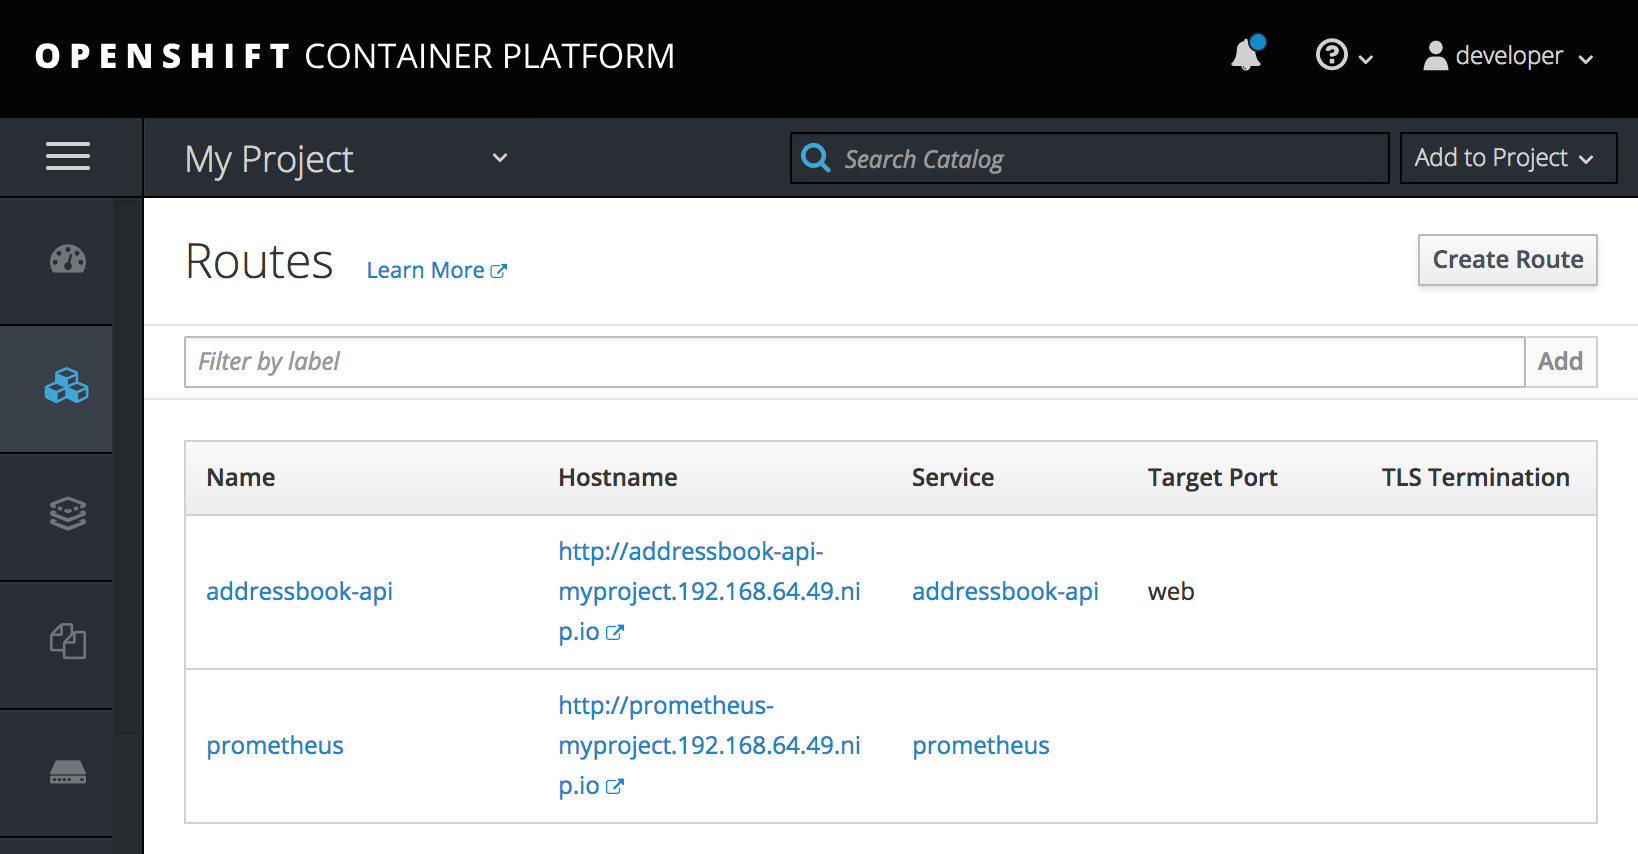
Click the Prometheus Hostname URL to open the Prometheus dashboard in a new browser tab or window.
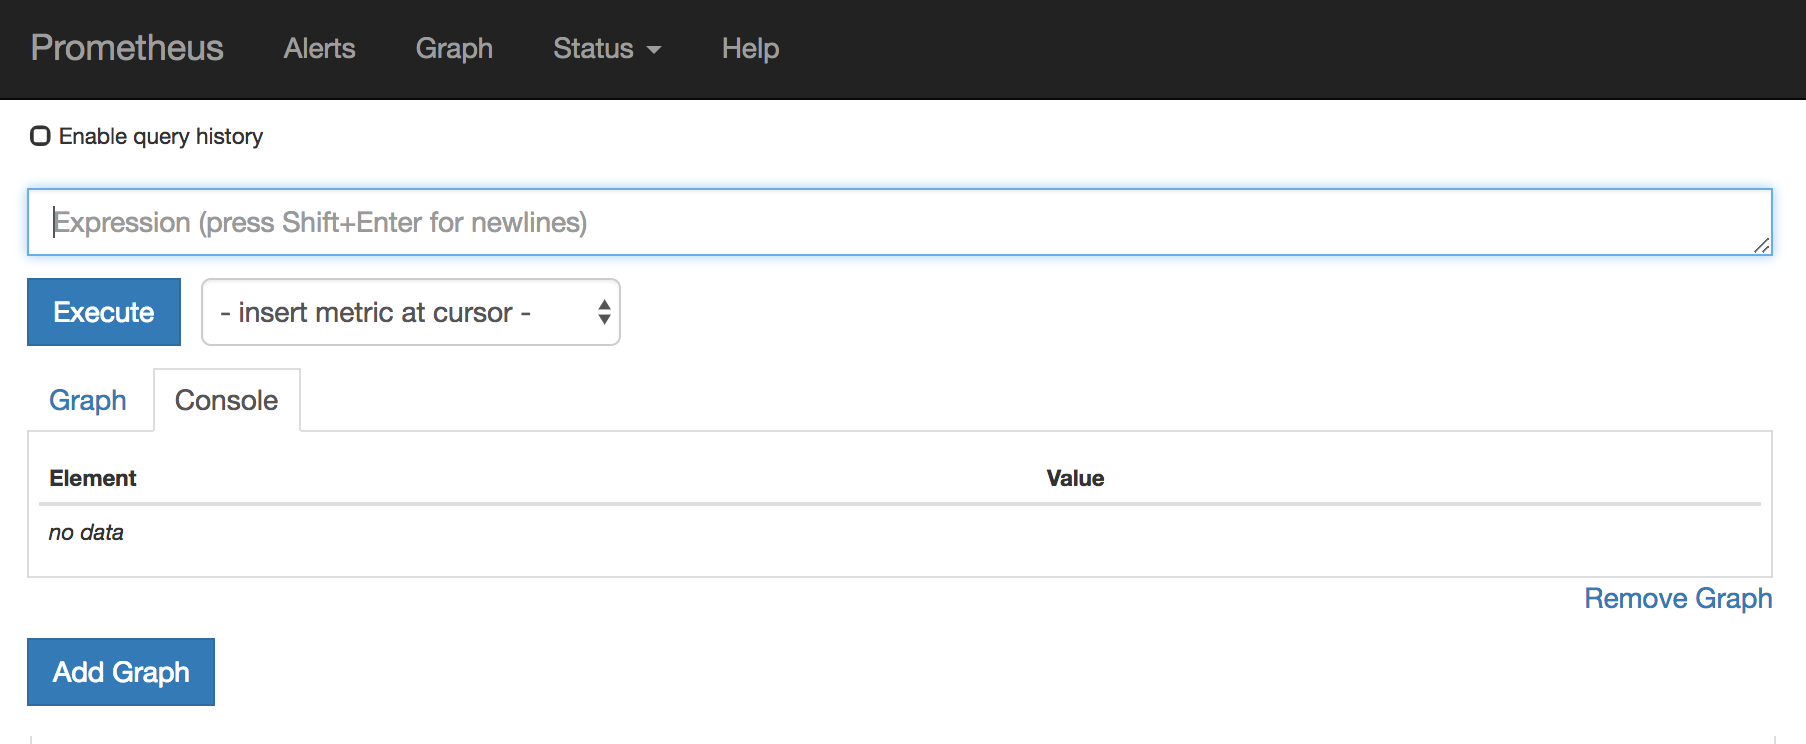
- For information about getting started with Prometheus, go to: https://prometheus.io/docs/prometheus/latest/getting_started/
6.2. Configuring Prometheus
The following sections describe how to configure Prometheus:
6.2.1. Setting OpenShift environment variables
To configure your application’s Prometheus instance, you can set the following environment variables in OpenShift:
Table 6.1. Prometheus Environment Variables
| Environment Variable | Description | Default |
|---|---|---|
|
| The host address to bind. |
|
|
| If set, disables the activation of Prometheus (echoes an empty value). | Prometheus is enabled. |
|
| The Port to use. |
|
|
| Uses the file (including path) as the Prometheus configuration file. | The /opt/prometheus/prometheus-config.yml file with Camel metrics. |
|
| Additional options to append to the JMX exporter configuration. | Not applicable. |
For information on setting environment variables for a pod, see the OpenShift Developer Guide (https://access.redhat.com/documentation/en-us/openshift_container_platform/3.11/html/developer_guide/).
6.2.2. Controlling the metrics that Prometheus monitors and collects
By default, Prometheus uses a configuration file ( https://raw.githubusercontent.com/jboss-fuse/application-templates/master/prometheus/prometheus-config.yml) that includes all possible metrics exposed by Camel.
If you have custom metrics within your application that you want Prometheus to monitor and collect (for example, the number of orders that your application processes), you can use your own configuration file. Note that the metrics that you can identify are limited to those supplied in JMX.
Procedure
To use a custom configuration file to expose JMX beans that are not covered by the default Prometheus configuration, follow these steps:
Create a custom Prometheus configuration file. You can use the contents of the default file (
prometheus-config.ymlhttps://raw.githubusercontent.com/jboss-fuse/application-templates/master/prometheus/prometheus-config.yml) as a guide for the format.You can use any name for the custom configuration file, for example:
my-prometheus-config.yml.-
Add your prometheus configuration file (for example,
my-prometheus-config.yml) to your application’ssrc/main/fabric8-includesdirectory. Create a
src/main/fabric8/deployment.xmlfile within your application and add an entry for the AB_JMX_EXPORTER_CONFIG environment variable with its value set to your configuration file. For example:spec: template: spec: containers: - resources: requests: cpu: "0.2" limits: cpu: "1.0" env: - name: SPRING_APPLICATION_JSON value: '{"server":{"tomcat":{"max-threads":1}}}' - name: AB_JMX_EXPORTER_CONFIG value: "my-prometheus-config.yml"This environment variable applies to your application at the pod level.
- Rebuild and deploy your application.
6.2.3. Generating alerts
For an example of using Prometheus for OpenShift to generate alerts, see the Red Hat Cloud Forms Monitoring, Alerts, and Reporting guide:
6.2.4. Configuring an external Prometheus instance to monitor Fuse Online Integration applications
When you install Fuse Online on OpenShift Container Platform, a syndesis-prometheus instance is included by default. For detailed instructions on how to install Fuse Online on premise OpenShift Container Platform, see Integrating Applications with Fuse Online.
However, if you already have an existing external Prometheus instance, you can configure that external instance to also monitor Fuse Online Integration applications that are deployed on OpenShift Container Platform.
The steps depend on whether you used the Prometheus operator to install your external Prometheus instance.
6.2.4.1. Configuring a Prometheus instance (with the Prometheus operator)
If you installed a Prometheus instance by using the Prometheus operator, updating your external Prometheus configuration to monitor Fuse Online integration involves adding and then editing a service monitor.
Prerequisite
You installed Prometheus as described in Section 6.1, “Setting up Prometheus”.
Procedure
In a terminal window, add a service monitor to the namespace (project) in which you installed Prometheus:
oc process -f {$templates-base-url}/fuse-servicemonitor.yml -p NAMESPACE=<YOUR-NAMESPACE> -p FUSE_SERVICE_NAME=fuseonline | oc create -f -- In the OpenShift console, open the project and then select Applications → Services.
- Click the fuseonline service and then select Actions → Edit YAML.
-
In the Editor, change the selector section of the YAML file by replacing
app: fuseonlinewithsyndesis.io/type: integration. - Click Save.
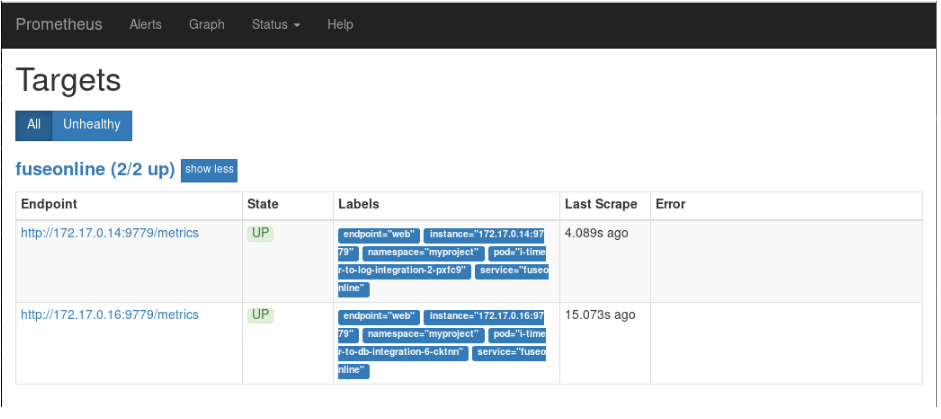
The Prometheus operator updates its configuration to monitor all Fuse Online integrations.
You can now view Fuse Online integrations in the Prometheus instance. The following example shows a Prometheus instance that monitors two integrations:
6.2.4.2. Configuring a Prometheus instance (without the Prometheus operator)
If you installed an external Prometheus instance without using the Prometheus operator, updating the configuration to monitor Fuse Online integration involves editing your Prometheus configuration file and updating the Prometheus pod configuration.
Prerequisite
You must have write access to the Prometheus configuration file (prometheus-config.yml). In the OpenShift web console, the configuration file is located in Resources → Config Maps.
Procedure
Edit your Prometheus configuration file (
prometheus-config.yml) as follows:Set the scrape interval to 5 seconds:
global:
        scrape_interval:     5s
        evaluation_interval: 5s
Add a scrape config job named
integration-podwith the Kubernetes service discovery configuration that configures it to scrape pods in the${OPENSHIFT_PROJECT}, which is typically thesyndesisnamespace:- job_name: integration-pods kubernetes_sd_configs: - role: pod namespaces: names: - ${OPENSHIFT_PROJECT}Add a
relabel_configssection that:-
Only scrapes integration pods with the
prometheus.io/scrapelabel set to true. -
Sets the
metrics_pathandaddresslabels, that are used to scrape the JMX exporter in the integration pod, by using values from theprometheus.io/pathandprometheus.io/portlabels. - Adds pod labels and annotations as Prometheus labels.
Creates
kubernetes_namespaceandkubernetes_pod_namelabels.Here is an example
relabel_configssection:relabel_configs: - source_labels: [__meta_kubernetes_pod_annotation_prometheus_io_scrape] action: keep regex: true - source_labels: [__meta_kubernetes_pod_annotation_prometheus_io_path] action: replace target_label: __metrics_path__ regex: (.+) - source_labels: [__address__, __meta_kubernetes_pod_annotation_prometheus_io_port] action: replace regex: ([^:]+)(?::\d+)?;(\d+) replacement: $1:$2 target_label: __address__ - action: labelmap regex: __meta_kubernetes_pod_label_(.+) - action: labelmap regex: __meta_kubernetes_pod_annotation_(syndesis.+) - source_labels: [__meta_kubernetes_namespace] action: replace target_label: kubernetes_namespace - source_labels: [__meta_kubernetes_pod_name] action: replace target_label: kubernetes_pod_name
-
Only scrapes integration pods with the
Fuse Online integrations expose a large number of metrics from the JVM, Camel and CXF. To reduce the amount of storage needed for metrics, add the following
metric_relabel_configssection to filter out metrics that are not displayed in the Fuse Online console.metric_relabel_configs: - source_labels: [__name__] regex: jmx_(.+) action: drop - source_labels: [__name__] regex: jvm_(.+) action: drop - source_labels: [__name__] regex: process_(.+) action: drop - source_labels: [type, __name__] separator: ':' regex: context:(org_apache_camel_ExchangesTotal|org_apache_camel_ExchangesFailed|io_syndesis_camel_StartTimestamp|io_syndesis_camel_LastExchangeCompletedTimestamp|io_syndesis_camel_LastExchangeFailureTimestamp) action: keepNoteThe last configuration line explicitly lists metrics to be added in Prometheus metrics store that are critical to the statistics shown in the Fuse Online web console. Your Prometheus instance must explicitly allow these metrics to be collected if other metrics are being filtered.
Update the Prometheus pod configuration to store 30 days worth of metric data as follows:
args:
            - '--config.file=/etc/prometheus/prometheus.yml'
            - '--storage.tsdb.retention=30d'