
Red Hat Training
A Red Hat training course is available for Red Hat Fuse
Chapter 8. Viewing and managing Apache Camel applications
In the Fuse Console’s Camel tab, you view and manage Apache Camel contexts, routes, and dependencies.
8.1. Overview
The Camel tab is only available when you connect to a container that uses one or more Camel routes.
You can view the following details:
- A list of all running Camel contexts
- Detailed information of each Camel context such as Camel version number and runtime statics
- Lists of all routes in each Camel application and their runtime statistics
- Graphical representation of the running routes along with real time metrics
You can also interact with a Camel application by:
- Starting and suspending contexts
- Managing the lifecycle of all Camel applications and their routes, so you can restart, stop, pause, resume, etc.
- Live tracing and debugging of running routes
- Browsing and sending messages to Camel endpoints
8.2. Interacting with a Camel application
To start, suspend, or delete a context:
- In the Camel tab’s tree view, click Camel Contexts.
- Check the box next to one or more contexts in the list.
- Click Start or Suspend.
- To delete a context, you must first stop it. Then click the ellipse icon and select Delete from the dropdown menu.
When you delete a context, you remove it from the deployed application.
To view Camel application details:
- In the Camel tab’s tree view, click a Camel application.
- To view a list of application attributes and values, click Attributes.
To view a graphical representation of the application attributes::
- Click Chart.
- Click Edit to select the attributes that you want to see in the chart.
- To view inflight and blocked exchanges, click Exchanges.
- To view application endpoints, click Endpoints. You can filter the list by URL, Route ID, and direction.
- Click Type Converters to view, enable, and disable statistics related to the Camel built-in type conversion mechanism, that is used to convert message bodies and message headers to different types.
- Click Operations to view and execute JMX operations, such as adding or updating routes from XML or finding all Camel components available in the classpath.
To interact with Camel routes:
In the Camel tab’s tree view, click the application’s routes folder to view a list of the routes:
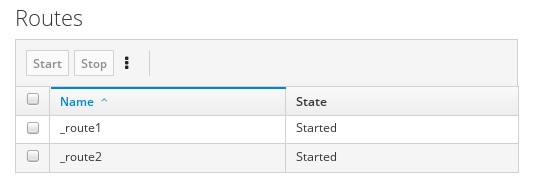
To start, stop, or delete one or more routes:
- Check the box next to one or more routes in the list.
- Click Start or Stop.
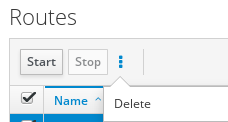
To delete a route, you must first stop it. Then click the ellipse icon and select Delete from the dropdown menu.
 Note
Note- When you delete a route, you remove it from the deployed application.
- You can also select a specific route in the tree view and then click the upper-right menu to start, stop, or delete it.
- To view a graphical diagram of the routes, click Route Diagram.
- To view inflight and blocked exchanges, click Exchanges.
- To view endpoints, click Endpoints. You can filter the list by URL, Route ID, and direction.
- Click Type Converters to view, enable, and disable statistics related to the Camel built-in type conversion mechanism, which is used to convert message bodies and message headers to different types.
To interact with a specific route:
- In the Camel tab’s tree view, select a route.
- To view a list of route attributes and values, click Attributes.
- To view a graphical representation of the route attributes, click Chart. You can click Edit to select the attributes that you want to see in the chart.
- To view inflight and blocked exchanges, click Exchanges.
- Click Operations to view and execute JMX operations on the route, such as dumping the route as XML or getting the route’s Camel ID value.
To trace messages through a route:
- In the Camel tab’s tree view, select a route.
- Select Trace, and then click Start tracing.
To send messages to a route:
- In the Camel tab’s tree view, open the context’s endpoints folder and then select an endpoint.
- Click the Send subtab.
- Configure the message in JSON or XML format.
- Click Send.
- Return to the route’s Trace tab to view the flow of messages through the route.
To debug a route:
- In the Camel tab’s tree view, select a route.
- Select Debug, and then click Start debugging.
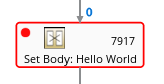
To add a breakpoint, select a node in the diagram and then click Add breakpoint. A red dot appears in the node:
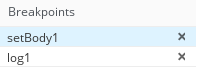
The node is added to the list of breakpoints:
- Click the down arrow to step to the next node or the Play button to resume running the route.
- Click the Pause button to suspend all threads for the route.
- Click Stop debugging when you are done. All breakpoints are cleared.