
Chapter 3. Monitoring Using Nagios
3.1. Install the Nagios Service
The Nagios monitoring system can be used to provide monitoring and alerts for the OpenStack network and infrastructure. The following installation procedure installs:
- nagios
- Nagios program that monitors hosts and services on the network, and which can send email or page alerts when a problem arises and when a problem is resolved.
- nagios-devel
- Includes files which can be used by Nagios-related applications.
- nagios-plugins*
- Nagios plugins for Nagios-related applications (including ping and nrpe).
- gd
- Graphics Library, for dynamically creating images
- gd-devel
- Development libraries for Graphics Library (gd)
- php
- HTML-embedded scripting language, used by Nagios for the web interface.
- gcc, glibc and glibc-common
- GNU compiler collection, together with standard programming libraries and binaries (including locale support).
- openssl
- OpenSSL toolkit, which provides support for secure communication between machines.
Install the required packages as the root user, using the yum command:
# yum install nagios nagios-devel nagios-plugins\* gd gd-devel php gcc glibc glibc-common openssl
If any of the packages are not immediately available (for example, gd-devel or gcc), you might have to enable the optional Red Hat channel using subscription-manager:
# subscription-manager repos --enable rhel-7-server-optional-rpms
3.1.1. Nagios Service Placement
Consider deploying Nagios to a server that is external to the OpenStack environment, allowing it to receive diagnostic information in the event of system issues. In addition, there are a number of points to review for optimal Nagios placement:
- Nagios services can have high CPU overhead if SSH is used.
- Nagios should be hosted on a securely locked down server, especially if security events are being monitored. The Nagios server will receive traffic from a broad scope of systems. If security segmentation is a requirement, then this would be considered a privileged system, subject to additional firewall rules than what would apply to an OpenStack node.
- Nagios servers may receive a considerable amount of network traffic, resulting in resource contention.
3.1.2. Install the NRPE Addon
NRPE (Nagios Remote Plugin Executor) plugins are compiled executables or scripts that are used to check the status of a host’s service, and report back to the Nagios service. If the OpenStack cloud is distributed across machines, the NPRE addon can be used to run access plugin information on those remote machines.
NRPE and the Nagios plugins must be installed on each remote machine to be monitored. On the remote machine, and as the root user, execute the following:
# yum install -y nrpe nagios-plugins\* openssl
After the installation, you can view all available plugins in the /usr/lib64/nagios/plugins/ directory.
SSH can also be used to access remote Nagios plugins. However, this can result in too high a CPU load on both the Nagios host and remote machine, and is not recommended.
3.2. Configure Nagios
Nagios is composed of a server, plugins that report object/host information from both local and remote machines back to the server, a web interface, and configuration that ties all of it together.
At a minimum, the following must be done:
- Check web-interface user name and password, and check basic configuration.
- Add OpenStack monitoring to the local server.
If the OpenStack cloud includes distributed hosts:
- Install and configure NRPE on each remote machine (that has services to be monitored).
- Tell Nagios which hosts are being monitored.
- Tell Nagios which services are being monitored for each host.
Table 3.1. Nagios Configuration Files
| File Name | Description |
|---|---|
| /etc/nagios/nagios.cfg | Main Nagios configuration file. |
| /etc/nagios/cgi.cfg | CGI configuration file. |
| /etc/httpd/conf.d/nagios.conf | Nagios configuration for httpd. |
| /etc/nagios/passwd | Password file for Nagios users. |
| /usr/local/nagios/etc/ResourceName.cfg | Contains user-specific settings. |
| /etc/nagios/objects/ObjectsDir/ObjectsFile.cfg | Object definition files that are used to store information about items such as services or contact groups. |
| /etc/nagios/nrpe.cfg | NRPE configuration file. |
3.2.1. Configure HTTPD for Nagios
By default, when Nagios is installed, the default httpd user and password is: nagiosadmin / nagiosadmin. This value can be viewed in the /etc/nagios/cgi.cfg file.
To configure HTTPD for nagios, follow these steps:
- Log in as the root user.
To change the default password for the user nagiosadmin, execute:
# htpasswd -c /etc/nagios/passwd nagiosadminNoteTo create a new user, use the following command with the new user’s name:
# htpasswd /etc/nagios/passwd newUserNameUpdate the nagiosadmin email address in
/etc/nagios/objects/contacts.cfg:define contact{ contact_name nagiosadmin ; Short name of user [...snip...] email yourName@example.com ; << CHANGE THIS }Verify that the basic configuration is working:
# nagios -v /etc/nagios/nagios.cfg
If errors occur, check the parameters set in
/etc/nagios/nagios.cfg.Ensure that Nagios is started automatically when the system boots:
# chkconfig --add nagios
# chkconfig nagios on
Start up Nagios and restart httpd:
# service httpd restart
# service nagios start
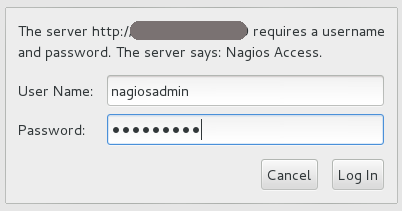
Check your Nagios access by using the following URL in your browser, and using the nagiosadmin user and the password that was set in Step 2:
http://nagiosHostURL/nagios
Figure 3.1. Nagios Login
If the Nagios URL cannot be accessed, ensure your firewall rules have been set up correctly.
3.2.2. Configure Nagios to Monitor OpenStack Services
By default, on the Nagios server, the /etc/nagios/objects/localhost.cfg file is used to define services for basic local statistics; for example, swap usage or the number of current users. You can always comment these services out if they are no longer needed by prefacing each line with a '#' character. This same file can be used to add new OpenStack monitoring services.
Additional service files can be used, but they must be specified as a cfg_file parameter in the /etc/nagios/nagios.cfg file.
- Log in as the root user.
Write a short script for the item to be monitored (for example, whether a service is running), and place it in the
/usr/lib64/nagios/pluginsdirectory.For example, the following script checks the number of Compute instances, and is stored in a file named
nova-list:#!/bin/env bash export OS_USERNAME=userName export OS_TENANT_NAME=tenantName export OS_PASSWORD=password export OS_AUTH_URL=http://identityURL:35357/v2.0/ data=$(nova list 2>&1) rv=$? if [ "$rv" != "0" ] ; then echo $data exit $rv fi echo "$data" | grep -v -e '--------' -e '| Status |' -e '^$' | wc -l
Ensure the script is executable:
# chmod a+x nova-list
In the
/etc/nagios/objects/commands.cfgfile, specify a command section for each new script:define command { command_line /usr/lib64/nagios/plugins/nova-list command_name nova-list }In the
/etc/nagios/objects/localhost.cfgfile, define a service for each new item, using the defined command. For example:define service { check_command nova-list host_name localURL name nova-list normal_check_interval 5 service_description Number of nova vm instances use generic-service }Restart nagios using:
# service nagios restart
3.2.3. Configure NRPE
To set up monitoring on each remote machine, execute the following as the root user:
In the
/etc/nagios/nrpe.cfgfile, add the central Nagios server IP address in theallowed_hostsline:allowed_hosts=127.0.0.1, NagiosServerIPIn the
/etc/nagios/nrpe.cfgfile, add any commands to be used to monitor the OpenStack services. For example:command[keystone]=/usr/lib64/nagios/plugins/check_procs -c 1: -w 3: -C keystone-all
Each defined command can then be specified in the
services.cfgfile on the Nagios monitoring server.NoteAny complicated monitoring can be placed into a script, and then referred to in the command definition.
-
Next, configure the firewall to allow
nrpetraffic. Start the NRPE service:
# service nrpe start
3.2.4. Create Host Definitions
If additional machines are being used in the cloud, in addition to the host on which Nagios is installed, they must be made known to Nagios by configuring them in an objects file:
- Log in as the root user.
-
In the
/etc/nagios/objects/directory, create ahosts.cfgfile. In the file, specify a host section for each machine on which an OpenStack service is running and should be monitored:
define host{
    use linux-server
    host_name remoteHostName
    alias remoteHostAlias
    address remoteAddress
}
where:
-
host_name= Name of the remote machine to be monitored (typically listed in the local/etc/hostsfile). This name is used to reference the host in service and host group definitions. -
alias= Name used to easily identify the host (typically the same as thehost_name). -
address= Host address (typically its IP address, although a FQDN can be used instead, just make sure that DNS services are available).
For example:
define host{ host_name Server-ABC alias OS-ImageServices address 192.168.1.254 }-
In the
/etc/nagios/nagios.cfgfile, under theOBJECT CONFIGURATION FILESsection, specify the following line:cfg_file=/etc/nagios/objects/hosts.cfg
3.2.5. Create Service Definitions for Remote Services
To monitor remote services, you must define those services in a new file; in this procedure, /etc/nagios/objects/services.cfg:
- Log in as the root user.
In the
/etc/nagios/objects/commands.cfgfile, specify the following to handle the use of thecheck_nrpeplugin with remote scripts or plugins:define command{ command_name check_nrpe command_line $USER1$/check_nrpe -H $HOSTADDRESS$ -c $ARG1$ }-
In the
/etc/nagios/objects/directory, create theservices.cfgfile. In the file, specify the following
servicesections for each remote OpenStack host to be monitored:##Basic remote checks############# ##Remember that remoteHostName is defined in the hosts.cfg file. define service{ use generic-service host_name remoteHostName service_description PING check_command check_ping!100.0,20%!500.0,60% } define service{ use generic-service host_name remoteHostName service_description Load Average check_command check_nrpe!check_load } ##OpenStack Service Checks####### define service{ use generic-service host_name remoteHostName service_description Identity Service check_command check_nrpe!keystone }
The above sections ensure that a server heartbeat, load check, and the OpenStack Identity service status are reported back to the Nagios server. All OpenStack services can be reported, just ensure that a matching command is specified in the remote server’s
nrpe.cfgfile.In the
/etc/nagios/nagios.cfgfile, under theOBJECT CONFIGURATION FILESsection, specify the following line:cfg_file=/etc/nagios/objects/services.cfg
3.2.6. Verify the Nagios Configuration
- Log in as the root user.
Verify that the updated configuration is working:
# nagios -v /etc/nagios/nagios.cfg
If errors occur, check the parameters set in
/etc/nagios/nagios.cfg,/etc/nagios/services.cfg, and/etc/nagios/hosts.cfg.Restart Nagios:
# service nagios restart
Log in to the Nagios dashboard again by using the following URL in your browser, and using the nagiosadmin user and the password that was set in the beginning:
http://nagiosHostURL/nagios