
Optimizing RHEL 8 for Real Time for low latency operation
Optimizing the RHEL for Real Time kernel on Red Hat Enterprise Linux
Abstract
Making open source more inclusive
Red Hat is committed to replacing problematic language in our code, documentation, and web properties. We are beginning with these four terms: master, slave, blacklist, and whitelist. Because of the enormity of this endeavor, these changes will be implemented gradually over several upcoming releases. For more details, see our CTO Chris Wright’s message.
Providing feedback on Red Hat documentation
We appreciate your feedback on our documentation. Let us know how we can improve it.
Submitting feedback through Jira (account required)
- Log in to the Jira website.
- Click Create in the top navigation bar.
- Enter a descriptive title in the Summary field.
- Enter your suggestion for improvement in the Description field. Include links to the relevant parts of the documentation.
- Click Create at the bottom of the dialogue.
Chapter 1. Real-time kernel tuning in RHEL 8
Latency, or response time, refers to the time from an event and to the system response. It is generally measured in microseconds (μs).
For most applications running under a Linux environment, basic performance tuning can improve latency sufficiently. For those industries where latency must be low, accountable, and predictable, Red Hat has a replacement kernel that can be set for latency to meet those requirements. RHEL for Real Time 8 provides seamless integration with RHEL 8 and offers clients the opportunity to measure, configure, and record latency times within their organization.
Use the real-time kernel for well-tuned systems and for applications with extremely high determinism requirements. With kernel system tuning, you can achieve good improvement in determinism. Before you begin, perform general system tuning of the standard RHEL 8 system and then deploy the RHEL for Real Time kernel.
Failure to perform these tasks might prevent a consistent performance from a RHEL for Real Time deployment.
1.1. Tuning guidelines
Real-time tuning is an iterative process; you will almost never be able to tweak a few variables and know that the change is the best that can be achieved. Be prepared to spend days or weeks narrowing down the set of tuning configurations that work best for your system.
Additionally, always make long test runs. Changing some tuning parameters then doing a five minute test run is not a good validation of a particular set of tuning changes. Make the length of your test runs adjustable and run them for longer than a few minutes. You can narrow down to a few different tuning configuration sets with test runs of a few hours, then run those sets for many hours or days at a time to detect corner-cases of highest latency or resource exhaustion.
- Build a measurement mechanism into your application, so that you can accurately gauge how a particular set of tuning changes affect the application’s performance. Anecdotal evidence, for example, "The mouse moves more smoothly" is usually wrong and can vary. Do hard measurements and record them for later analysis.
- It is very tempting to make multiple changes to tuning variables between test runs, but doing so means that you do not have a way to narrow down which tuning parameter affected your test results. Keep the tuning changes between test runs as small as you can.
- It is also tempting to make large changes when tuning, but it is almost always better to make incremental changes. You will find that working your way up from the lowest to highest priority values will yield better results in the long run.
-
Use the available tools. The
tunatuning tool makes it easy to change processor affinities for threads and interrupts, thread priorities and to isolate processors for application use. Thetasksetandchrtcommand line utilities allow you to do most of whattunadoes. If you run into performance problems, theftraceandperfutilities can help locate latency problems. - Rather than hard-coding values into your application, use external tools to change policy, priority and affinity. Using external tools allows you to try many different combinations and simplifies your logic. Once you have found some settings that give good results, you can either add them to your application, or set up startup logic to implement the settings when the application starts.
1.2. Balancing logging parameters
The syslog server forwards log messages from programs over a network. The less often this occurs, the larger the pending transaction is likely to be. If the transaction is very large, it can cause an I/O spike. To prevent this, keep the interval reasonably small.
The system logging daemon, syslogd, is used to collect messages from different programs. It also collects information reported by the kernel from the kernel logging daemon, klogd. Typically, syslogd logs to a local file, but it can also be configured to log over a network to a remote logging server.
Procedure
To enable remote logging:
- Configure the machine to which the logs will be sent. For more information, see Remote Syslogging with rsyslog on Red Hat Enterprise Linux.
Configure each system that will send logs to the remote log server, so that its
syslogoutput is written to the server, rather than to the local file system. To do so, edit the/etc/rsyslog.conffile on each client system. For each of the logging rules defined in that file, replace the local log file with the address of the remote logging server.# Log all kernel messages to remote logging host. kern.* @my.remote.logging.server
The example above configures the client system to log all kernel messages to the remote machine at
@my.remote.logging.server.Alternatively, you can configure
syslogdto log all locally generated system messages, by adding the following line to the/etc/rsyslog.conffile:# Log all messages to a remote logging server: . @my.remote.logging.server
The syslogd daemon does not include built-in rate limiting on its generated network traffic. Therefore, Red Hat recommends that when using RHEL for Real Time systems, only log messages that are required to be remotely logged by your organization. For example, kernel warnings, authentication requests, and the like. Other messages should be logged locally.
Additional resources
-
syslog(3)man page -
rsyslog.conf(5)man page -
rsyslogd(8)man page
1.3. Improving performance by avoiding running unnecessary applications
Every running application uses system resources. Ensuring that there are no unnecessary applications running on your system can significantly improve performance.
Prerequisites
- You have root permissions on the system.
Procedure
Do not run the graphical interface where it is not absolutely required, especially on servers.
Check if the system is configured to boot into the GUI by default:
# systemctl get-defaultIf the output of the command is
graphical.target, configure the system to boot to text mode:# systemctl set-default multi-user.targetUnless you are actively using a Mail Transfer Agent (MTA) on the system you are tuning, disable it. If the MTA is required, ensure it is well-tuned or consider moving it to a dedicated machine.
For more information, refer to the MTA’s documentation.
ImportantMTAs are used to send system-generated messages, which are executed by programs such as
cron. This includes reports generated by logging functions likelogwatch(). You will not be able to receive these messages if the MTAs on your machine are disabled.Peripheral devices, such as mice, keyboards, webcams send interrupts that may negatively affect latency. If you are not using a graphical interface, remove all unused peripheral devices and disable them.
For more information, refer to the devices' documentation.
Check for automated
cronjobs that might impact performance.# crontab -lDisable the
crondservice or any unneededcronjobs.- Check your system for third-party applications and any components added by external hardware vendors, and remove any that are unnecessary.
Additional resources
-
cron(8)man page
1.4. Non-Uniform Memory Access
The taskset utility only works on CPU affinity and has no knowledge of other NUMA resources such as memory nodes. If you want to perform process binding in conjunction with NUMA, use the numactl command instead of taskset.
For more information about the NUMA API, see Andi Kleen’s whitepaper An NUMA API for Linux.
Additional resources
-
numactl(8)man page
1.5. Ensuring that debugfs is mounted
The debugfs file system is specially designed for debugging and making information available to users. It is mounted automatically in RHEL 8 in the /sys/kernel/debug/ directory.
The debugfs file system is mounted using the ftrace and trace-cmd commands.
Procedure
To verify that debugfs is mounted:
Run the following command:
# mount | grep ^debugfs
debugfs on /sys/kernel/debug type debugfs (rw,nosuid,nodev,noexec,relatime,seclabel)
If
debugfsis mounted, the command displays the mount point and properties fordebugfs.If
debugfsis not mounted, the command returns nothing.
1.6. InfiniBand in RHEL for Real Time
InfiniBand is a type of communications architecture often used to increase bandwidth, improve quality of service (QOS), and provide for failover. It can also be used to improve latency by using the Remote Direct Memory Access (RDMA) mechanism.
The support for InfiniBand on RHEL for Real Time is the same as the support available on Red Hat Enterprise Linux 8. For more information, see Configuring InfiniBand and RDMA networks.
1.7. Using RoCEE and High-Performance Networking
RoCEE (RDMA over Converged Enhanced Ethernet) is a protocol that implements Remote Direct Memory Access (RDMA) over Ethernet networks. It allows you to maintain a consistent, high-speed environment in your data centers, while providing deterministic, low latency data transport for critical transactions.
High Performance Networking (HPN) is a set of shared libraries that provides RoCEE interfaces into the kernel. Instead of going through an independent network infrastructure, HPN places data directly into remote system memory using standard Ethernet infrastructure, resulting in less CPU overhead and reduced infrastructure costs.
Support for RoCEE and HPN under RHEL for Real Time does not differ from the support offered under RHEL 8.
Additional resources
1.8. Tuning containers for RHEL for real-time
The main RHEL kernels enable the real time group scheduling feature, CONFIG_RT_GROUP_SCHED, by default. However, for real-time kernels, this feature is disabled.
The CONFIG_RT_GROUP_SCHED feature was developed independently of the PREEMPT_RT patchset used in the kernel-rt package and is intended to operate on real time processes on the main RHEL kernel. The CONFIG_RT_GROUP_SCHED feature might cause latency spikes and is therefore disabled on PREEMPT_RT enabled kernels. Therefore, when testing your workload in a container running on the main RHEL kernel, some real-time bandwidth must be allocated to the container to be able to run the SCHED_FIFO or SCHED_RR tasks inside it.
Procedure
Configure the following global setting before using podman’s
--cpu-rt-runtimecommand line option:# echo 950000 > /sys/fs/cgroup/cpu,cpuacct/machine.slice/cpu.rt_runtime_us- For CPU isolation, use the existing recommendations for setting aside a set of cores for the RT workload.
-
Run
podman run --cpuset-cpuswith the list of isolated CPU cores to be used. Specify the Non-Uniform Memory Access (NUMA) memory nodes to use.
*podman run --cpuset-mems=number-of-memory-nodesThis avoids cross-NUMA node memory access.
-
To verify that the minimal amount of memory required by the real-time workload running on the container is available at container start time, use the
*podman run --memory-reservation=limitcommand.
Additional resources
-
podman-run(1)man page
Chapter 2. Scheduling policies for RHEL for Real Time
In real-time, the scheduler is the kernel component that determines the runnable thread to run. Each thread has an associated scheduling policy and a static scheduling priority, known as sched_priority. The scheduling is preemptive and therefore the currently running thread stops when a thread with a higher static priority gets ready to run. The running thread then returns to the waitlist for its static priority.
All Linux threads have one of the following scheduling policies:
-
SCHED_OTHERorSCHED_NORMAL: is the default policy. -
SCHED_BATCH: is similar toSCHED_OTHER, but with incremental orientation. -
SCHED_IDLE: is the policy with lower priority thanSCHED_OTHER. -
SCHED_FIFO: is the first in and first out real-time policy. -
SCHED_RR: is the round-robin real-time policy. -
SCHED_DEADLINE: is a scheduler policy to prioritize tasks according to the job deadline. The job with the earliest absolute deadline runs first.
2.1. Scheduler policies
The real-time threads have higher priority than the standard threads. The policies have scheduling priority values that range from the minimum value of 1 to the maximum value of 99.
The following policies are critical to real-time:
SCHED_OTHERorSCHED_NORMALpolicyThis is the default scheduling policy for Linux threads. It has a dynamic priority that is changed by the system based on the characteristics of the thread.
SCHED_OTHERthreads have nice values between 20, which is the highest priority and 19, which is the lowest priority. The default nice value forSCHED_OTHERthreads is 0.SCHED_FIFOpolicyThreads with
SCHED_FIFOrun with higher priority overSCHED_OTHERtasks. Instead of using nice values,SCHED_FIFOuses a fixed priority between 1, which is the lowest and 99, which is the highest. ASCHED_FIFOthread with a priority of 1 always schedules first over aSCHED_OTHERthread.SCHED_RRpolicyThe
SCHED_RRpolicy is similar to theSCHED_FIFOpolicy. The threads of equal priority are scheduled in a round-robin fashion.SCHED_FIFOandSCHED_RRthreads run until one of the following events occurs:- The thread goes to sleep or waits for an event.
A higher-priority real-time thread gets ready to run.
Unless one of the above events occurs, the threads run indefinitely on the specified processor, while the lower-priority threads remain in the queue waiting to run. This might cause the system service threads to be resident and prevent being swapped out and fail the filesystem data flushing.
SCHED_DEADLINEpolicyThe
SCHED_DEADLINEpolicy specifies the timing requirements. It schedules each task according to the task’s deadline. The task with the earliest deadline first (EDF) schedule runs first.The kernel requires
runtime⇐deadline⇐periodto be true. The relation between the required options isruntime⇐deadline⇐period.
2.2. Parameters for SCHED_DEADLINE policy
Each SCHED_DEADLINE task is characterized by period, runtime, and deadline parameters. The values for these parameters are integers of nanoseconds.
Table 2.1. SCHED_DEADLINE parameters
| Parameter | Description |
|---|---|
|
|
For example, if a video processing task has 60 frames per second to process, a new frame is queued for service every 16 milliseconds. Therefore, the |
|
|
For example, if a video processing tool can take, in the worst case, five milliseconds to process an image, the |
|
|
For example, if a task needs to deliver the processed frame within ten milliseconds, the |
Chapter 3. Setting persistent kernel tuning parameters
When you have decided on a tuning configuration that works for your system, you can make the changes persistent across reboots.
By default, edited kernel tuning parameters only remain in effect until the system reboots or the parameters are explicitly changed. This is effective for establishing the initial tuning configuration. It also provides a safety mechanism. If the edited parameters cause the machine to behave erratically, rebooting the machine returns the parameters to the previous configuration.
3.1. Making persistent kernel tuning parameter changes
You can make persistent changes to kernel tuning parameters by adding the parameter to the /etc/sysctl.conf file.
This procedure does not change any of the kernel tuning parameters in the current session. The changes entered into /etc/sysctl.conf only affect future sessions.
Prerequisites
- You have root permissions on the system.
Procedure
-
Open
/etc/sysctl.confin a text editor. Insert the new entry into the file with the parameter’s value.
Modify the parameter name by removing the
/proc/sys/path, changing the remaining slash (/) to a period (.), and including the parameter’s value.For example, to make the command
echo 0 > /proc/sys/kernel/hung_task_panicpersistent, enter the following into/etc/sysctl.conf:# Enable gettimeofday(2) kernel.hung_task_panic = 0
- Save and close the file.
- Reboot the system for changes to take effect.
Verification
To verify the configuration:
# cat /proc/sys/kernel/hung_task_panic
0
Chapter 4. Application tuning and deployment
Tuning a real-time kernel with a combination of optimal configurations and settings can help in enhancing and developing RHEL for Real Time applications.
In general, try to use POSIX defined APIs (application programming interfaces). RHEL for Real Time is compliant with POSIX standards. Latency reduction in RHEL for Real Time kernel is also based on POSIX.
4.1. Signal processing in real-time applications
Traditional UNIX and POSIX signals have their uses, especially for error handling, but they are not suitable as an event delivery mechanism in real-time applications. This is because the current Linux kernel signal handling code is quite complex, mainly due to legacy behavior and the many APIs that need to be supported. This complexity means that the code paths that are taken when delivering a signal are not always optimal, and long latencies can be experienced by applications.
The original motivation behind UNIX signals was to multiplex one thread of control (the process) between different "threads" of execution. Signals behave somewhat like operating system interrupts. That is, when a signal is delivered to an application, the application’s context is saved and it starts executing a previously registered signal handler. Once the signal handler completes, the application returns to executing where it was when the signal was delivered. This can get complicated in practice.
Signals are too non-deterministic to trust in a real-time application. A better option is to use POSIX Threads (pthreads) to distribute your workload and communicate between various components. You can coordinate groups of threads using the pthreads mechanisms of mutexes, condition variables, and barriers. The code paths through these relatively new constructs are much cleaner than the legacy handling code for signals.
Additional resources
4.2. Synchronizing threads
The sched_yield command is a synchronization mechanism that can allow lower priority threads a chance to run. This type of request is prone to failure when issued from within a poorly-written application.
A higher priority thread can call sched_yield() to allow other threads a chance to run. The calling process gets moved to the tail of the queue of processes running at that priority. When this occurs in a situation where there are no other processes running at the same priority, the calling process continues running. If the priority of that process is high, it can potentially create a busy loop, rendering the machine unusable.
When a SCHED_DEADLINE task calls sched_yield(), it gives up the configured CPU, and the remaining runtime is immediately throttled until the next period. The sched_yield() behavior allows the task to wake up at the start of the next period.
The scheduler is better able to determine when, and if, there actually are other threads waiting to run. Avoid using sched_yield() on any real-time task.
Procedure
To call the
sched_yield()function, run the following code:for(;;) { do_the_computation(); /* * Notify the scheduler the end of the computation * This syscall will block until the next replenishment */ sched_yield(); }The
SCHED_DEADLINEtask gets throttled by the conflict-based search (CBS) algorithm until the next period (start of next execution of the loop).
Additional resources
-
pthread.h(P)man page -
sched_yield(2)man page -
sched_yield(3p)man page
4.3. Real-time scheduler priorities
The systemd command can be used to set real-time priority for services launched during the boot process. Some kernel threads can be given a very high priority. This allows the default priorities to integrate well with the requirements of the Real Time Specification for Java (RTSJ). RTSJ requires a range of priorities from 10 to 89.
For deployments where RTSJ is not in use, there is a wide range of scheduling priorities below 90 that can be used by applications. Use extreme caution when scheduling any application thread above priority 49 because it can prevent essential system services from running, because it can prevent essential system services from running. This can result in unpredictable behavior, including blocked network traffic, blocked virtual memory paging, and data corruption due to blocked filesystem journaling.
If any application threads are scheduled above priority 89, ensure that the threads run only a very short code path. Failure to do so would undermine the low latency capabilities of the RHEL for Real Time kernel.
Setting real-time priority for users without mandatory privileges
By default, only users with root permissions on the application can change priority and scheduling information. To provide root permissions, you can modify settings and the preferred method is to add a user to the realtime group.
You can also change user privileges by editing the /etc/security/limits.conf file. However, this can result in duplication and render the system unusable for regular users. If you decide to edit this file, exercise caution and always create a copy before making changes.
4.4. Loading dynamic libraries
When developing real-time application, consider resolving symbols at startup to avoid non-deterministic latencies during program execution. Resolving symbols at startup can slow down program initialization. You can instruct Dynamic Libraries to load at application startup by setting the LD_BIND_NOW variable with ld.so, the dynamic linker/loader.
For example, the following shell script exports the LD_BIND_NOW variable with a value of 1, then runs a program with a scheduler policy of FIFO and a priority of 1.
#!/bin/sh

LD_BIND_NOW=1
export LD_BIND_NOW

chrt --fifo 1 _/opt/myapp/myapp-server &_
Additional resources
-
ld.so(8)man page
Chapter 5. Setting BIOS parameters for system tuning
The BIOS plays a key role in the functioning of the system. By configuring the BIOS parameters correctly you can significantly improve the system performance.
Every system and BIOS vendor uses different terms and navigation methods. For more information about BIOS settings, see the BIOS documentation or contact the BIOS vendor.
5.1. Disabling power management to improve response times
BIOS power management options help save power by changing the system clock frequency or by putting the CPU into one of various sleep states. These actions are likely to affect how quickly the system responds to external events.
To improve response times, disable all power management options in the BIOS.
5.2. Improving response times by disabling error detection and correction units
Error Detection and Correction (EDAC) units are devices for detecting and correcting errors signaled from Error Correcting Code (ECC) memory. Usually EDAC options range from no ECC checking to a periodic scan of all memory nodes for errors. The higher the EDAC level, the more time the BIOS uses. This may result in missing crucial event deadlines.
To improve response times, turn off EDAC. If this is not possible, configure EDAC to the lowest functional level.
5.3. Improving response time by configuring System Management Interrupts
System Management Interrupts (SMIs) are a hardware vendors facility to ensure that the system is operating correctly. The BIOS code usually services the SMI interrupt. SMIs are typically used for thermal management, remote console management (IPMI), EDAC checks, and various other housekeeping tasks.
If the BIOS contains SMI options, check with the vendor and any relevant documentation to determine the extent to which it is safe to disable them.
While it is possible to completely disable SMIs, Red Hat strongly recommends that you do not do this. Removing the ability of your system to generate and service SMIs can result in catastrophic hardware failure.
Chapter 6. Running and interpreting hardware and firmware latency tests
With the hwlatdetect program, you can test and verify if a potential hardware platform is suitable for using real-time operations.
Prerequisites
-
Ensure that the
RHEL-RT(RHEL for Real Time) andrt-testspackages are installed. Check the vendor documentation for any tuning steps required for low latency operation.
The vendor documentation can provide instructions to reduce or remove any System Management Interrupts (SMIs) that would transition the system into System Management Mode (SMM). While a system is in SMM, it runs firmware and not operating system code. This means that any timers that expire while in SMM wait until the system transitions back to normal operation. This can cause unexplained latencies, because SMIs cannot be blocked by Linux, and the only indication that we actually took an SMI can be found in vendor-specific performance counter registers.
WarningRed Hat strongly recommends that you do not completely disable SMIs, as it can result in catastrophic hardware failure.
6.1. Running hardware and firmware latency tests
It is not required to run any load on the system while running the hwlatdetect program, because the test looks for latencies introduced by the hardware architecture or BIOS or EFI firmware. The default values for hwlatdetect are to poll for 0.5 seconds each second, and report any gaps greater than 10 microseconds between consecutive calls to fetch the time. hwlatdetect returns the best maximum latency possible on the system. Therefore, if you have an application that requires maximum latency values of less than 10us and hwlatdetect reports one of the gaps as 20us, then the system can only guarantee latency of 20us.
If hwlatdetect shows that the system cannot meet the latency requirements of the application, try changing the BIOS settings or working with the system vendor to get new firmware that meets the latency requirements of the application.
Prerequisites
-
Ensure that the
RHEL-RTandrt-testspackages are installed.
Procedure
Run
hwlatdetect, specifying the test duration in seconds.hwlatdetectlooks for hardware and firmware-induced latencies by polling the clock-source and looking for unexplained gaps.# hwlatdetect --duration=60s hwlatdetect: test duration 60 seconds detector: tracer parameters: Latency threshold: 10us Sample window: 1000000us Sample width: 500000us Non-sampling period: 500000us Output File: None Starting test test finished Max Latency: Below threshold Samples recorded: 0 Samples exceeding threshold: 0
Additional resources
-
hwlatdetectman page. - Interpreting hardware and firmware latency tests
6.2. Interpreting hardware and firmware latency test results
The hardware latency detector (hwlatdetect) uses the tracer mechanism to detect latencies introduced by the hardware architecture or BIOS/EFI firmware. By checking the latencies measured by hwlatdetect, you can determine if a potential hardware is suitable to support the RHEL for Real Time kernel.
Examples
The example result represents a system tuned to minimize system interruptions from firmware. In this situation, the output of
hwlatdetectlooks like this:# hwlatdetect --duration=60s hwlatdetect: test duration 60 seconds detector: tracer parameters: Latency threshold: 10us Sample window: 1000000us Sample width: 500000us Non-sampling period: 500000us Output File: None Starting test test finished Max Latency: Below threshold Samples recorded: 0 Samples exceeding threshold: 0The example result represents a system that could not be tuned to minimize system interruptions from firmware. In this situation, the output of
hwlatdetectlooks like this:# hwlatdetect --duration=10s hwlatdetect: test duration 10 seconds detector: tracer parameters: Latency threshold: 10us Sample window: 1000000us Sample width: 500000us Non-sampling period: 500000us Output File: None Starting test test finished Max Latency: 18us Samples recorded: 10 Samples exceeding threshold: 10 SMIs during run: 0 ts: 1519674281.220664736, inner:17, outer:15 ts: 1519674282.721666674, inner:18, outer:17 ts: 1519674283.722667966, inner:16, outer:17 ts: 1519674284.723669259, inner:17, outer:18 ts: 1519674285.724670551, inner:16, outer:17 ts: 1519674286.725671843, inner:17, outer:17 ts: 1519674287.726673136, inner:17, outer:16 ts: 1519674288.727674428, inner:16, outer:18 ts: 1519674289.728675721, inner:17, outer:17 ts: 1519674290.729677013, inner:18, outer:17----The output shows that during the consecutive reads of the system
clocksource, there were 10 delays that showed up in the 15-18 us range.NotePrevious versions used a kernel module rather than the
ftracetracer.
Understanding the results
The information on testing method, parameters, and results helps you understand the latency parameters and the latency values detected by the hwlatdetect utility.
The table for Testing method, parameters, and results, lists the parameters and the latency values detected by the hwlatdetect utility.
Table 6.1. Testing method, parameters, and results
| Parameter | Value | Description |
|---|---|---|
|
|
| The duration of the test in seconds |
|
|
|
The utility that runs the |
|
| ||
|
|
| The maximum allowable latency |
|
|
| 1 second |
|
|
| 0.05 seconds |
|
|
| 0.05 seconds |
|
|
| The file to which the output is saved. |
|
| ||
|
|
|
The highest latency during the test that exceeded the |
|
|
| The number of samples recorded by the test. |
|
|
|
The number of samples recorded by the test where the latency exceeded the |
|
|
| The number of System Management Interrupts (SMIs) that occurred during the test run. |
The values printed by the hwlatdetect utility for inner and outer are the maximum latency values. They are deltas between consecutive reads of the current system clocksource (usually the TSC or TSC register, but potentially the HPET or ACPI power management clock) and any delays between consecutive reads introduced by the hardware-firmware combination.
After finding the suitable hardware-firmware combination, the next step is to test the real-time performance of the system while under a load.
Chapter 7. Running and interpreting system latency tests
RHEL for Real Time provides the rteval utility to test the system real-time performance under load.
7.1. Running system latency tests
With the rteval utility, you can test a system’s real-time performance under load.
Prerequisites
-
The
RHEL for Real Timepackage group is installed. - You have root permissions on the system.
Procedure
Run the
rtevalutility.# rtevalThe
rtevalutility starts a heavy system load ofSCHED_OTHERtasks. It then measures real-time response on each online CPU. The loads are a parallelmakeof the Linux kernel tree in a loop and thehackbenchsynthetic benchmark.The goal is to bring the system into a state, where each core always has a job to schedule. The jobs perform various tasks, such as memory allocation/free, disk I/O, computational tasks, memory copies, and other.
Once the loads start,
rtevalstarts thecyclictestmeasurement program. This program starts theSCHED_FIFOreal-time thread on each online core. It then measures the real-time scheduling response time.Each measurement thread takes a timestamp, sleeps for an interval, then takes another timestamp after waking up. The latency measured is
t1 - (t0 + i), which is the difference between the actual wakeup timet1, and the theoretical wakeup time of the first timestampt0plus the sleep intervali.The details of the
rtevalrun are written to an XML file along with the boot log for the system. This report is displayed on the screen and saved to a compressed file.The file name is in the form
rteval-<date>-N-tar.bz2, where<date>is the date the report was generated,Nis a counter for the Nth run on<date>.The following is an example of an
rtevalreport:System: Statistics: Samples: 1440463955 Mean: 4.40624790712us Median: 0.0us Mode: 4us Range: 54us Min: 2us Max: 56us Mean Absolute Dev: 1.0776661507us Std.dev: 1.81821060672us CPU core 0 Priority: 95 Statistics: Samples: 36011847 Mean: 5.46434910711us Median: 4us Mode: 4us Range: 38us Min: 2us Max: 40us Mean Absolute Dev: 2.13785341159us Std.dev: 3.50155558554us
The report includes details about the system hardware, length of the run, options used, and the timing results, both per-cpu and system-wide.
NoteTo regenerate an
rtevalreport from its generated file, run# rteval --summarize rteval-<date>-N.tar.bz2
Chapter 8. Setting CPU affinity on RHEL for Real Time
All threads and interrupt sources in the system has a processor affinity property. The operating system scheduler uses this information to determine the threads and interrupts to run on a CPU. By setting processor affinity, along with effective policy and priority settings, you can achieve maximum possible performance. Applications always compete for resources, especially CPU time, with other processes. Depending on the application, related threads are often run on the same core. Alternatively, one application thread can be allocated to one core.
Systems that perform multitasking are naturally more prone to indeterminism. Even high priority applications can be delayed from executing while a lower priority application is in a critical section of code. After the low priority application exits the critical section, the kernel safely preempts the low priority application and schedules the high priority application on the processor. Additionally, migrating processes from one CPU to another can be costly due to cache invalidation. RHEL for Real Time includes tools that address some of these issues and allows latency to be better controlled.
Affinity is represented as a bit mask, where each bit in the mask represents a CPU core. If the bit is set to 1, then the thread or interrupt runs on that core; if 0 then the thread or interrupt is excluded from running on the core. The default value for an affinity bit mask is all ones, meaning the thread or interrupt can run on any core in the system.
By default, processes can run on any CPU. However, by changing the affinity of the process, you can define a process to run on a predetermined set of CPUs. Child processes inherit the CPU affinities of their parents.
Setting the following typical affinity setups can achieve maximum possible performance:
- Using a single CPU core for all system processes and setting the application to run on the remainder of the cores.
-
Configuring a thread application and a specific kernel thread, such as network
softirqor a driver thread, on the same CPU. - Pairing the producer-consumer threads on each CPU. Producers and consumers are two classes of threads, where producers insert data into the buffer and consumers remove it from the buffer.
The usual good practice for tuning affinities on a real-time system is to determine the number of cores required to run the application and then isolate those cores. You can achieve this with the Tuna tool or with the shell scripts to modify the bit mask value, such as the taskset command. The taskset command changes the affinity of a process and modifying the /proc/ file system entry changes the affinity of an interrupt.
8.1. Tuning processor affinity using the taskset command
On real-time, the taskset command helps to set or retrieve the CPU affinity of a running process. The taskset command takes -p and -c options. The -p or --pid option work an existing process and does not start a new task. The -c or --cpu-list specify a numerical list of processors instead of a bitmask. The list can contain more than one items, separated by comma, and a range of processors. For example, 0,5,7,9-11.
Prerequisites
- You have root permissions on the system.
Procedure
To verify the process affinity for a specific process:
# taskset -p -c 1000
   pid 1000’s current affinity list: 0,1
The command prints the affinity of the process with PID 1000. The process is set up to use CPU 0 or CPU 1.
(Optional) To configure a specific CPU to bind a process:
# taskset -p -c 1 1000
pid 1000’s current affinity list: 0,1
pid 1000’s new affinity list: 1
(Optional) To define more than one CPU affinity:
# taskset -p -c 0,1 1000
pid 1000’s current affinity list: 1
pid 1000’s new affinity list: 0,1
(Optional) To configure a priority level and a policy on a specific CPU:
# taskset -c 5 chrt -f 78 /bin/my-appFor further granularity, you can also specify the priority and policy. In the example, the command runs the
/bin/my-appapplication on CPU 5 withSCHED_FIFOpolicy and a priority value of 78.
8.2. Setting processor affinity using the sched_setaffinity() system call
You can also set processor affinity using the real-time sched_setaffinity() system call.
Prerequisite
- You have root permissions on the system.
Procedure
To set the processor affinity with
sched_setaffinity():#define _GNU_SOURCE #include <stdio.h> #include <stdlib.h> #include <unistd.h> #include <errno.h> #include <sched.h> int main(int argc, char **argv) { int i, online=0; ulong ncores = sysconf(_SC_NPROCESSORS_CONF); cpu_set_t *setp = CPU_ALLOC(ncores); ulong setsz = CPU_ALLOC_SIZE(ncores); CPU_ZERO_S(setsz, setp); if (sched_getaffinity(0, setsz, setp) == -1) { perror("sched_getaffinity(2) failed"); exit(errno); } for (i=0; i < CPU_COUNT_S(setsz, setp); i) { if (CPU_ISSET_S(i, setsz, setp)) online; } printf("%d cores configured, %d cpus allowed in affinity mask\n", ncores, online); CPU_FREE(setp); }
8.3. Isolating a single CPU to run high utilization tasks
With the cpusets mechanism, you can assign a set of CPUs and memory nodes for SCHED_DEADLINE tasks. In a task set that has high and low CPU utilizing tasks, isolating a CPU to run the high utilization task and scheduling small utilization tasks on different sets of CPU, enables all tasks to meet the assigned runtime.
Prerequisites
- You have root permissions on the system.
Procedure
Create two directories named as
cpuset:# cd /sys/fs/cgroup/cpuset/ # mkdir cluster # mkdir partition
Disable the load balance of the root
cpusetto create two new root domains in thecpusetdirectory:# echo 0 > cpuset.sched_load_balanceIn the cluster
cpuset, schedule the low utilization tasks to run on CPU 1 to 7, verify memory size, and name the CPU as exclusive:# cd cluster/ # echo 1-7 > cpuset.cpus # echo 0 > cpuset.mems # echo 1 > cpuset.cpu_exclusive
Move all low utilization tasks to the cpuset directory:
# ps -eLo lwp | while read thread; do echo $thread > tasks ; doneCreate a partition named as
cpusetand assign the high utilization task:# cd ../partition/ # echo 1 > cpuset.cpu_exclusive # echo 0 > cpuset.mems # echo 0 > cpuset.cpus
Set the shell to the cpuset and start the deadline workload:
# echo $$ > tasks
# /root/d &
With this setup, the task isolated in the partitioned
cpusetdirectory does not interfere with the task in the clustercpusetdirectory. This enables all real-time tasks to meet the scheduler deadline.
8.4. Reducing CPU performance spikes
A common source of latency spikes is when multiple CPUs contend on common locks in the kernel timer tick handler. The usual lock responsible for the contention is xtime_lock, which is used by the timekeeping system and the Read-Copy-Update (RCU) structure locks. By using skew_tick=1, you can offset the timer tick per CPU to start at a different time and avoid potential lock conflicts.
The skew_tick kernel command line parameter might prevent latency fluctuations on moderate to large systems with large core-counts and have latency-sensitive workloads.
Prerequisites
- You have administrator permissions.
Procedure
Enable the
skew_tick=1parameter withgrubby.# grubby --update-kernel=ALL --args="skew_tick=1"
Reboot for changes to take effect.
# reboot
Enabling skew_tick=1 causes a significant increase in power consumption and, therefore, you must enable the skew boot parameter only if you are running latency sensitive real-time workloads and consistent latency is an important consideration over power consumption.
Verification
Display the /proc/cmdline file and ensure skew_tick=1 is specified. The /proc/cmdline file shows the parameters passed to the kernel.
Check the new settings in the
/proc/cmdlinefile.# cat /proc/cmdline
8.5. Lowering CPU usage by disabling the PC card daemon
The pcscd daemon manages connections to parallel communication (PC or PCMCIA) and smart card (SC) readers. Although pcscd is usually a low priority task, it can often use more CPU than any other daemon. Therefore, the additional background noise can lead to higher preemption costs to real-time tasks and other undesirable impacts on determinism.
Prerequisites
- You have root permissions on the system.
Procedure
Check the status of the
pcscddaemon.# systemctl status pcscd ● pcscd.service - PC/SC Smart Card Daemon Loaded: loaded (/usr/lib/systemd/system/pcscd.service; indirect; vendor preset: disabled) Active: active (running) since Mon 2021-03-01 17:15:06 IST; 4s ago TriggeredBy: ● pcscd.socket Docs: man:pcscd(8) Main PID: 2504609 (pcscd) Tasks: 3 (limit: 18732) Memory: 1.1M CPU: 24ms CGroup: /system.slice/pcscd.service └─2504609 /usr/sbin/pcscd --foreground --auto-exitThe
Activeparameter shows the status of thepcsddaemon.If the
pcsddaemon is running, stop it.# systemctl stop pcscd Warning: Stopping pcscd.service, but it can still be activated by: pcscd.socketConfigure the system to ensure that the
pcsddaemon does not restart when the system boots.# systemctl disable pcscd Removed /etc/systemd/system/sockets.target.wants/pcscd.socket.
Verification steps
Check the status of the
pcscddaemon.# systemctl status pcscd ● pcscd.service - PC/SC Smart Card Daemon Loaded: loaded (/usr/lib/systemd/system/pcscd.service; indirect; vendor preset: disabled) Active: inactive (dead) since Mon 2021-03-01 17:10:56 IST; 1min 22s ago TriggeredBy: ● pcscd.socket Docs: man:pcscd(8) Main PID: 4494 (code=exited, status=0/SUCCESS) CPU: 37ms-
Ensure that the value for the
Activeparameter isinactive (dead).
Chapter 9. Using mlock() system calls on RHEL for Real Time
The RHEL for Real-Time memory lock (mlock()) function enables the real-time calling processes to lock or unlock a specified range of the address space. This range prevents Linux from paging the locked memory when swapping memory space. After you allocate the physical page to the page table entry, references to that page become fast. The mlock() system calls include two functions: mlock() and mlockall(). Similarly, munlock() system call includes the munlock() and munlockall() functions.
9.1. mlock() and munlock() system calls
The mlock() and mlockall() system calls lock a specified memory range and do not page this memory. The following are the mlock() system call groups:
-
mlock()system calls: lock a specified range of address. -
munlock()system calls: unlock a specified range of address.
The mlock() system calls, lock pages in the address range starting at addr and continuing for len bytes. When the call returns successfully, all pages that contain a part of the specified address range stay in the memory until unlocked later.
With mlockall() system calls, you can lock all mapped pages into the specified address range. Memory locks do not stack. Any page locked by several calls will unlock the specified address range or the entire region with a single munlock() system call. With munlockall() system calls, you can unlock the entire program space.
The status of the pages contained in a specific range depends on the value in the flags argument. The flags argument can be 0 or MLOCK_ONFAULT.
Memory locks are not inherited by a child process through fork and automatically removed when a process terminates.
Use mlock() system calls with caution. Excessive use can cause out-of-memory (OOM) errors. When an application is large or if it has a large data domain, the mlock() calls can cause thrashing when the system is not able to allocate memory for other tasks.
When using mlockall() calls for real-time processes, ensure that you reserve sufficient stack pages.
9.2. Using mlock() system calls to lock pages
The real-time mlock() system calls use the addr parameter to specify the start of an address range and len to define the length of the address space in bytes. The alloc_workbuf() function dynamically allocates a memory buffer and locks it. Memory allocation is done by the posix_memalig() function to align the memory area to a page. The function free_workbuf() unlocks the memory area.
Prerequisites:
-
You have root privileges or the
CAP_IPC_LOCKcapability to usemlockall()ormlock()on large buffers
Procedure
To lock pages with
mlock()system call, run the following command:#include <stdlib.h> #include <unistd.h> #include <sys/mman.h> void *alloc_workbuf(size_t size) { void ptr; int retval; // alloc memory aligned to a page, to prevent two mlock() in the same page. retval = posix_memalign(&ptr, (size_t) sysconf(_SC_PAGESIZE), size); // return NULL on failure if (retval) return NULL; // lock this buffer into RAM if (mlock(ptr, size)) { free(ptr); return NULL; } return ptr; } void free_workbuf(void *ptr, size_t size) { // unlock the address range munlock(ptr, size); // free the memory free(ptr); }
Verification
The real-time mlock() and munlock() calls return 0 when successful. In case of an error, they return -1 and set a errno to indicate the error.
9.3. Using mlockall() system calls to lock all mapped pages
To lock and unlock real-time memory with mlockall() and munlockall() system calls, set the flags argument to 0 or one of the constants: MCL_CURRENT or MCL_FUTURE. With MCL_FUTURE, a future system call, such as mmap2(), sbrk2(), or malloc3(), might fail, because it causes the number of locked bytes to exceed the permitted maximum.
Prerequisites
- You have root permissions on the system.
Procedure
To use
mlockall()andmunlockall()real-time system calls :Lock all mapped pages by using
mlockall()system call:#include <sys/mman.h> int mlockall (int flags)
Unlock all mapped pages by using
munlockall()system call:#include <sys/mman.h> int munlockall (void)
Additional resources
-
capabilities(7)man page -
mlock(2)man page -
mlock(3)man page -
move_pages(2)man page -
posix_memalign(3)man page -
posix_memalign(3p)man page
9.4. Using mmap() system calls to map files or devices into memory
For large memory allocations on real-time systems, the memory allocation (malloc) method uses the mmap() system call to find memory space. You can assign and lock memory areas by setting MAP_LOCKED in the flags parameter. As mmap() assigns memory on a page basis, it avoids two locks on the same page, which prevents the double-lock or single-unlock problems.
Prerequisites
- You have root permissions on the system.
Procedure
To map a specific process-address space:
#include <sys/mman.h>
#include <stdlib.h>

void *alloc_workbuf(size_t size)
{
 void *ptr;

 ptr = mmap(NULL, size, PROT_READ | PROT_WRITE,
            MAP_PRIVATE | MAP_ANONYMOUS | MAP_LOCKED, -1, 0);

 if (ptr == MAP_FAILED)
  return NULL;

 return ptr;
}

void
free_workbuf(void *ptr, size_t size)
{
 munmap(ptr, size);
}
Verification
-
When the
mmap()function completes successfully, it returns a pointer to the mapped area. On error, it returns theMAP_FAILEDvalue and sets aerrnoto indicate the error. -
When the
munmap()function completes successfully, it returns0. On error, it returns-1and sets anerrnoto indicate the error.
Additional resources
-
mmap(2)man page -
mlockall(2)man page
9.5. Parameters for mlock() system calls
The parameters for memory lock system call and the functions they perform are listed and described in the mlock parameters table.
Table 9.1. mlock parameters
| Parameter | Description |
|---|---|
|
|
Specifies the process address space to lock or unlock. When NULL, the kernel chooses the page-aligned arrangement of data in the memory. If |
|
| Specifies the length of the mapping, which must be greater than 0. |
|
| Specifies the file descriptor. |
|
|
|
|
|
Controls the mapping visibility to other processes that map the same file. It takes one of the values: |
|
| Locks all pages that are currently mapped into a process. |
|
| Sets the mode to lock subsequent memory allocations. These could be new pages required by a growing heap and stack, new memory-mapped files, or shared memory regions. |
Chapter 10. Minimizing or avoiding system slowdowns due to journaling
The order in which journal changes are written to disk might differ from the order in which they arrive. The kernel I/O system can reorder the journal changes to optimize the use of available storage space. Journal activity can result in system latency by re-ordering journal changes and committing data and metadata. As a result, journaling file systems can slow down the system.
XFS is the default file system used by RHEL 8. This is a journaling file system. An older file system called ext2 does not use journaling. Unless your organization specifically requires journaling, consider the ext2 file system. In many of Red Hat’s best benchmark results, the ext2 filesystem is used. This is one of the top initial tuning recommendations.
Journaling file systems like XFS, records the time a file was last accessed (the atime attribute). If you need to use a journaling file system, consider disabling atime.
10.1. Disabling atime
Disabling the atime attribute increases performance and decreases power usage by limiting the number of writes to the file-system journal.
Procedure
Open the
/etc/fstabfile using your chosen text editor and locate the entry for the root mount point./dev/mapper/rhel-root / xfs defaults…
Edit the options sections to include the terms
noatimeandnodiratime. Thenoatimeoption prevents access timestamps being updated when a file is read, and thenodiratimeoption stops directory inode access times being updated./dev/mapper/rhel-root / xfs noatime,nodiratime…
Some applications rely on atime being updated. Therefore, this option is reasonable only on systems where such applications are not used.
Alternatively, you can use the relatime mount option, which ensures that the access time is only updated if the previous access time is older than the current modify time.
10.2. Additional resources
-
mkfs.ext2(8)man page -
mkfs.xfs(8)man page -
mount(8)man page
Chapter 11. Disabling graphics console output for latency sensitive workloads
The kernel starts passing messages to printk() as soon as it starts. The kernel sends messages to the log file and also displays on the graphics console even in the absence of a monitor attached to a headless server.
In some systems, the output sent to the graphics console might introduce stalls in the pipeline. This might cause potential delay in task execution while waiting for data transfers. For example, outputs sent to teletype0 (/dev/tty0), might cause potential stalls in some systems.
To prevent unexpected stalls, you can limit or disable the information that is sent to the graphic console by:
-
Removing the
tty0definition. - Changing the order of console definitions.
-
Turning off most
printk()functions and ensuring that you set theignore_loglevelkernel parameter tonot configured.
By disabling the graphics console output from logging on and by controlling the messages that print on the graphics console, you can improve latency on sensitive workloads.
11.1. Disabling graphics console logging to graphics adapter
The teletype (tty) default kernel console enables your interaction with the system by passing input data to the system and displaying the output information about the graphics console.
Not configuring the graphics console, prevents it from logging on the graphics adapter. This makes tty0 unavailable to the system and helps disable printing messages on the graphics console.
Disabling graphics console output does not delete information. The information prints in the system log and you can access them using the journalctl or dmesg utilities.
Procedure
Remove the
console=tty0option from the kernel configuration:# grubby --update-kernel=ALL --remove-args="console=tty0"
11.2. Disabling messages from printing on graphics console
You can control the amount of output messages that are sent to the graphics console by configuring the required log levels in the /proc/sys/kernel/printk file.
Procedure
View the current console log level:
$ cat /proc/sys/kernel/printk
  7    4    1    7
The command prints the current settings for system log levels. The numbers correspond to current, default, minimum, and boot-default values for the system logger.
Configure the desired log level in the
/proc/sys/kernel/printkfile.$ echo “1” > /proc/sys/kernel/printkThe command changes the current console log level. For example, setting log level 1, will print only alert messages and prevent display of other messages on the graphics console.
Chapter 12. Managing system clocks to satisfy application needs
Multiprocessor systems such as NUMA or SMP have multiple instances of hardware clocks. During boot time the kernel discovers the available clock sources and selects one to use. To improve performance, you can change the clock source used to meet the minimum requirements of a real-time system.
12.1. Hardware clocks
Multiple instances of clock sources found in multiprocessor systems, such as non-uniform memory access (NUMA) and Symmetric multiprocessing (SMP), interact among themselves and the way they react to system events, such as CPU frequency scaling or entering energy economy modes, determine whether they are suitable clock sources for the real-time kernel.
The preferred clock source is the Time Stamp Counter (TSC). If the TSC is not available, the High Precision Event Timer (HPET) is the second best option. However, not all systems have HPET clocks, and some HPET clocks can be unreliable.
In the absence of TSC and HPET, other options include the ACPI Power Management Timer (ACPI_PM), the Programmable Interval Timer (PIT), and the Real Time Clock (RTC). The last two options are either costly to read or have a low resolution (time granularity), therefore they are sub-optimal for use with the real-time kernel.
12.2. Viewing the available clock sources in your system
The list of available clock sources in your system is in the /sys/devices/system/clocksource/clocksource0/available_clocksource file.
Procedure
Display the
available_clocksourcefile.# cat /sys/devices/system/clocksource/clocksource0/available_clocksource tsc hpet acpi_pmIn this example, the available clock sources in the system are TSC, HPET, and ACPI_PM.
12.3. Viewing the clock source currently in use
The currently used clock source in your system is stored in the /sys/devices/system/clocksource/clocksource0/current_clocksource file.
Procedure
Display the
current_clocksourcefile.# cat /sys/devices/system/clocksource/clocksource0/current_clocksource tscIn this example, the current clock source in the system is TSC.
12.4. Temporarily changing the clock source to use
Sometimes the best-performing clock for a system’s main application is not used due to known problems on the clock. After ruling out all problematic clocks, the system can be left with a hardware clock that is unable to satisfy the minimum requirements of a real-time system.
Requirements for crucial applications vary on each system. Therefore, the best clock for each application, and consequently each system, also varies. Some applications depend on clock resolution, and a clock that delivers reliable nanoseconds readings can be more suitable. Applications that read the clock too often can benefit from a clock with a smaller reading cost (the time between a read request and the result).
In these cases it is possible to override the clock selected by the kernel, provided that you understand the side effects of the override and can create an environment which will not trigger the known shortcomings of the given hardware clock.
The kernel automatically selects the best available clock source. Overriding the selected clock source is not recommended unless the implications are well understood.
Prerequisites
- You have root permissions on the system.
Procedure
View the available clock sources.
# cat /sys/devices/system/clocksource/clocksource0/available_clocksource tsc hpet acpi_pmAs an example, consider the available clock sources in the system are TSC, HPET, and ACPI_PM.
Write the name of the clock source you want to use to the
/sys/devices/system/clocksource/clocksource0/current_clocksourcefile.# echo hpet > /sys/devices/system/clocksource/clocksource0/current_clocksourceNoteThe changes apply to the clock source currently in use. When the system reboots, the default clock is used. To make the change persistent, see Making persistent kernel tuning parameter changes.
Verification steps
Display the
current_clocksourcefile to ensure that the current clock source is the specified clock source.# cat /sys/devices/system/clocksource/clocksource0/current_clocksource hpetThe example uses HPET as the current clock source in the system.
12.5. Comparing the cost of reading hardware clock sources
You can compare the speed of the clocks in your system. Reading from the TSC involves reading a register from the processor. Reading from the HPET clock involves reading a memory area. Reading from the TSC is faster, which provides a significant performance advantage when timestamping hundreds of thousands of messages per second.
Prerequisites
- You have root permissions on the system.
-
The
clock_timingprogram must be on the system. For more information, see the clock_timing program.
Procedure
Change to the directory in which the
clock_timingprogram is saved.# cd clock_testView the available clock sources in your system.
# cat /sys/devices/system/clocksource/clocksource0/available_clocksource tsc hpet acpi_pmIn this example, the available clock sources in the system are
TSC,HPET, andACPI_PM.View the currently used clock source.
# cat /sys/devices/system/clocksource/clocksource0/current_clocksource
tsc
In this example, the current clock source in the system is
TSC.Run the
timeutility in conjunction with the ./clock_timingprogram. The output displays the duration required to read the clock source 10 million times.# time ./clock_timing real 0m0.601s user 0m0.592s sys 0m0.002sThe example shows the following parameters:
-
real- The total time spent beginning from program invocation until the process ends.realincludes user and kernel times, and will usually be larger than the sum of the latter two. If this process is interrupted by an application with higher priority, or by a system event such as a hardware interrupt (IRQ), this time spent waiting is also computed underreal. -
user- The time the process spent in user space performing tasks that did not require kernel intervention. -
sys- The time spent by the kernel while performing tasks required by the user process. These tasks include opening files, reading and writing to files or I/O ports, memory allocation, thread creation, and network related activities.
-
Write the name of the next clock source you want to test to the
/sys/devices/system/clocksource/clocksource0/current_clocksourcefile.# echo hpet > /sys/devices/system/clocksource/clocksource0/current_clocksourceIn this example, the current clock source is changed to
HPET.- Repeat steps 4 and 5 for all of the available clock sources.
- Compare the results of step 4 for all of the available clock sources.
Additional resources
-
time(1)man page
12.6. Synchronizing the TSC timer on Opteron CPUs
The current generation of AMD64 Opteron processors can be susceptible to a large gettimeofday skew. This skew occurs when both cpufreq and the Time Stamp Counter (TSC) are in use. RHEL for Real Time provides a method to prevent this skew by forcing all processors to simultaneously change to the same frequency. As a result, the TSC on a single processor never increments at a different rate than the TSC on another processor.
Prerequisites
- You have root permissions on the system.
Procedure
Enable the
clocksource=tscandpowernow-k8.tscsync=1kernel options:# grubby --update-kernel=ALL --args="clocksource=tsc powernow-k8.tscsync=1"
This forces the use of TSC and enables simultaneous core processor frequency transitions.
- Restart the machine.
Additional resources
-
gettimeofday(2)man page
12.7. The clock_timing program
The clock_timing program reads the current clock source 10 million times. In conjunction with the time utility it measures the amount of time needed to do this.
Procedure
To create the clock_timing program:
Create a directory for the program files.
$ mkdir clock_testChange to the created directory.
$ cd clock_testCreate a source file and open it in a text editor.
$ {EDITOR} clock_timing.cEnter the following into the file:
#include <time.h> void main() { int rc; long i; struct timespec ts; for(i=0; i<10000000; i++) { rc = clock_gettime(CLOCK_MONOTONIC, &ts); } }- Save the file and exit the editor.
Compile the file.
$ gcc clock_timing.c -o clock_timing -lrtThe
clock_timingprogram is ready and can be run from the directory in which it is saved.
Chapter 13. Controlling power management transitions
You can control power management transitions to improve latency.
Prerequisites
- You have root permissions on the system.
13.1. Power saving states
Modern processors actively transition to higher power saving states (C-states) from lower states. Unfortunately, transitioning from a high power saving state back to a running state can consume more time than is optimal for a real-time application. To prevent these transitions, an application can use the Power Management Quality of Service (PM QoS) interface.
With the PM QoS interface, the system can emulate the behavior of the idle=poll and processor.max_cstate=1 parameters, but with a more fine-grained control of power saving states. idle=poll prevents the processor from entering the idle state. processor.max_cstate=1 prevents the processor from entering deeper C-states (energy-saving modes).
When an application holds the /dev/cpu_dma_latency file open, the PM QoS interface prevents the processor from entering deep sleep states, which cause unexpected latencies when they are being exited. When the file is closed, the system returns to a power-saving state.
13.2. Configuring power management states
You can control power management transitions by configuring power management states with one of the following ways:
-
Write a value to the
/dev/cpu_dma_latencyfile to change the maximum response time for processes in microseconds and hold the file descriptor open until low latency is required. -
Reference the
/dev/cpu_dma_latencyfile in an application or a script.
Prerequisites
- You have administrator privileges.
Procedure
Specify latency tolerance by writing a 32-bit number that represents a maximum response time in microseconds in
/dev/cpu_dma_latencyand keep the file descriptor open through the low-latency operation. A value of0disables C-state completely.For example:
import os import os.path import signal import sys if not os.path.exists('/dev/cpu_dma_latency'): print("no PM QOS interface on this system!") sys.exit(1) fd = os.open('/dev/cpu_dma_latency', os.O_WRONLY) os.write(fd, b'\0\0\0\0') print("Press ^C to close /dev/cpu_dma_latency and exit") signal.pause() except KeyboardInterrupt: print("closing /dev/cpu_dma_latency") os.close(fd) sys.exit(0)NoteThe Power Management Quality of Service interface (
pm_qos) interface is only active while it has an open file descriptor. Therefore, any script or program you use to access/dev/cpu_dma_latencymust hold the file open until power-state transitions are allowed.
Chapter 14. Minimizing system latency by isolating interrupts and user processes
Real-time environments need to minimize or eliminate latency when responding to various events. To do this, you can isolate interrupts (IRQs) from user processes from one another on different dedicated CPUs.
14.1. Interrupt and process binding
Isolating interrupts (IRQs) from user processes on different dedicated CPUs can minimize or eliminate latency in real-time environments.
Interrupts are generally shared evenly between CPUs. This can delay interrupt processing when the CPU has to write new data and instruction caches. These interrupt delays can cause conflicts with other processing being performed on the same CPU.
It is possible to allocate time-critical interrupts and processes to a specific CPU (or a range of CPUs). In this way, the code and data structures for processing this interrupt will most likely be in the processor and instruction caches. As a result, the dedicated process can run as quickly as possible, while all other non-time-critical processes run on the other CPUs. This can be particularly important where the speeds involved are near or at the limits of memory and available peripheral bus bandwidth. Any wait for memory to be fetched into processor caches will have a noticeable impact in overall processing time and determinism.
In practice, optimal performance is entirely application-specific. For example, tuning applications with similar functions for different companies, required completely different optimal performance tunings.
- One firm saw optimal results when they isolated 2 out of 4 CPUs for operating system functions and interrupt handling. The remaining 2 CPUs were dedicated purely for application handling.
- Another firm found optimal determinism when they bound the network related application processes onto a single CPU which was handling the network device driver interrupt.
To bind a process to a CPU, you usually need to know the CPU mask for a given CPU or range of CPUs. The CPU mask is typically represented as a 32-bit bitmask, a decimal number, or a hexadecimal number, depending on the command you are using.
Table 14.1. Example of the CPU Mask for given CPUs
| CPUs | Bitmask | Decimal | Hexadecimal |
| 0 | 00000000000000000000000000000001 | 1 | 0x00000001 |
| 0, 1 | 00000000000000000000000000000011 | 3 | 0x00000011 |
14.2. Disabling the irqbalance daemon
The irqbalance daemon is enabled by default and periodically forces interrupts to be handled by CPUs in an even manner. However in real-time deployments, irqbalance is not needed, because applications are typically bound to specific CPUs.
Procedure
Check the status of
irqbalance.# systemctl status irqbalance irqbalance.service - irqbalance daemon Loaded: loaded (/usr/lib/systemd/system/irqbalance.service; enabled) Active: active (running) …If
irqbalanceis running, disable it, and stop it.# systemctl disable irqbalance # systemctl stop irqbalance
Verification
Check that the
irqbalancestatus is inactive.# systemctl status irqbalance
14.3. Excluding CPUs from IRQ balancing
You can use the IRQ balancing service to specify which CPUs you want to exclude from consideration for interrupt (IRQ) balancing. The IRQBALANCE_BANNED_CPUS parameter in the /etc/sysconfig/irqbalance configuration file controls these settings. The value of the parameter is a 64-bit hexadecimal bit mask, where each bit of the mask represents a CPU core.
Procedure
Open
/etc/sysconfig/irqbalancein your preferred text editor and find the section of the file titledIRQBALANCE_BANNED_CPUS.# IRQBALANCE_BANNED_CPUS # 64 bit bitmask which allows you to indicate which cpu's should # be skipped when reblancing irqs. Cpu numbers which have their # corresponding bits set to one in this mask will not have any # irq's assigned to them on rebalance # #IRQBALANCE_BANNED_CPUS=
-
Uncomment the
IRQBALANCE_BANNED_CPUSvariable. - Enter the appropriate bitmask to specify the CPUs to be ignored by the IRQ balance mechanism.
- Save and close the file.
Restart the
irqbalanceservice for the changes to take effect:# systemctl restart irqbalance
If you are running a system with up to 64 CPU cores, separate each group of eight hexadecimal digits with a comma. For example: IRQBALANCE_BANNED_CPUS=00000001,0000ff00
Table 14.2. Examples
| CPUs | Bitmask |
| 0 | 00000001 |
| 8 - 15 | 0000ff00 |
| 8 - 15, 33 | 00000002,0000ff00 |
In RHEL 7.2 and higher, the irqbalance utility automatically avoids IRQs on CPU cores isolated via the isolcpus kernel parameter if IRQBALANCE_BANNED_CPUS is not set in /etc/sysconfig/irqbalance.
14.4. Manually assigning CPU affinity to individual IRQs
Assigning CPU affinity enables binding and unbinding processes and threads to a specified CPU or range of CPUs. This can reduce caching problems.
Procedure
Check the IRQs in use by each device by viewing the
/proc/interruptsfile.# cat /proc/interruptsEach line shows the IRQ number, the number of interrupts that happened in each CPU, followed by the IRQ type and a description.
         CPU0       CPU1
0:   26575949         11         IO-APIC-edge  timer
1:         14          7         IO-APIC-edge  i8042
Write the CPU mask to the
smp_affinityentry of a specific IRQ. The CPU mask must be expressed as a hexadecimal number.For example, the following command instructs IRQ number 142 to run only on CPU 0.
# echo 1 > /proc/irq/142/smp_affinityThe change only takes effect when an interrupt occurs.
Verification steps
- Perform an activity that will trigger the specified interrupt.
Check
/proc/interruptsfor changes.The number of interrupts on the specified CPU for the configured IRQ increased, and the number of interrupts for the configured IRQ on CPUs outside the specified affinity did not increase.
14.5. Binding processes to CPUs with the taskset utility
The taskset utility uses the process ID (PID) of a task to view or set its CPU affinity. You can use the utility to run a command with a chosen CPU affinity.
To set the affinity, you need to get the CPU mask to be as a decimal or hexadecimal number. The mask argument is a bitmask that specifies which CPU cores are legal for the command or PID being modified.
The taskset utility works on a NUMA (Non-Uniform Memory Access) system, but it does not allow the user to bind threads to CPUs and the closest NUMA memory node. On such systems, taskset is not the preferred tool, and the numactl utility should be used instead for its advanced capabilities.
For more information, see the numactl(8) man page.
Procedure
Run
tasksetwith the necessary options and arguments.You can specify a CPU list using the -c parameter instead of a CPU mask. In this example,
my_embedded_processis being instructed to run only on CPUs 0,4,7-11.# taskset -c 0,4,7-11 /usr/local/bin/my_embedded_processThis invocation is more convenient in most cases.
To set the affinity of a process that is not currently running, use
tasksetand specify the CPU mask and the process.In this example,
my_embedded_processis being instructed to use only CPU 3 (using the decimal version of the CPU mask).# taskset 8 /usr/local/bin/my_embedded_processYou can specify more than one CPU in the bitmask. In this example,
my_embedded_processis being instructed to execute on processors 4, 5, 6, and 7 (using the hexadecimal version of the CPU mask).# taskset 0xF0 /usr/local/bin/my_embedded_processYou can set the CPU affinity for processes that are already running by using the
-p(--pid) option with the CPU mask and the PID of the process you want to change. In this example, the process with a PID of 7013 is being instructed to run only on CPU 0.# taskset -p 1 7013
You can combine the listed options.
Additional resources
-
taskset(1)man page -
numactl(8)man page
Chapter 15. Managing Out of Memory states
Out-of-memory (OOM) is a computing state where all available memory, including swap space, has been allocated. Normally this causes the system to panic and stop functioning as expected. The provided instructions help in avoiding OOM states on your system.
Prerequisites
- You have root permissions on the system.
15.1. Changing the Out of Memory value
The /proc/sys/vm/panic_on_oom file contains a value which is the switch that controls Out of Memory (OOM) behavior. When the file contains 1, the kernel panics on OOM and stops functioning as expected.
The default value is 0, which instructs the kernel to call the oom_killer() function when the system is in an OOM state. Usually, oom_killer() terminates unnecessary processes, which allows the system to survive.
You can change the value of /proc/sys/vm/panic_on_oom.
Procedure
Display the current value of
/proc/sys/vm/panic_on_oom.# cat /proc/sys/vm/panic_on_oom 0To change the value in
/proc/sys/vm/panic_on_oom:Echo the new value to
/proc/sys/vm/panic_on_oom.# echo 1 > /proc/sys/vm/panic_on_oom
It is recommended that you make the Real-Time kernel panic on OOM (1). Otherwise, when the system encounters an OOM state, it is no longer deterministic.
Verification steps
Display the value of
/proc/sys/vm/panic_on_oom.# cat /proc/sys/vm/panic_on_oom 1- Verify that the displayed value matches the value specified.
15.2. Prioritizing processes to kill when in an Out of Memory state
You can prioritize the processes that get terminated by the oom_killer() function. This can ensure that high-priority processes keep running during an OOM state. Each process has a directory, /proc/PID. Each directory includes the following files:
-
oom_adj- Valid scores foroom_adjare in the range -16 to +15. This value is used to calculate the performance footprint of the process, using an algorithm that also takes into account how long the process has been running, among other factors. -
oom_score- Contains the result of the algorithm calculated using the value inoom_adj.
In an Out of Memory state, the oom_killer() function terminates processes with the highest oom_score.
You can prioritize the processes to terminate by editing the oom_adj file for the process.
Prerequisites
- Know the process ID (PID) of the process you want to prioritize.
Procedure
Display the current
oom_scorefor a process.# cat /proc/12465/oom_score 79872Display the contents of
oom_adjfor the process.# cat /proc/12465/oom_adj 13Edit the value in
oom_adj.# echo -5 > /proc/12465/oom_adj
Verification steps
Display the current
oom_scorefor the process.# cat /proc/12465/oom_score 78- Verify that the displayed value is lower than the previous value.
15.3. Disabling the Out of Memory killer for a process
You can disable the oom_killer() function for a process by setting oom_adj to the reserved value of -17. This will keep the process alive, even in an OOM state.
Procedure
Set the value in
oom_adjto-17.# echo -17 > /proc/12465/oom_adj
Verification steps
Display the current
oom_scorefor the process.# cat /proc/12465/oom_score 0-
Verify that the displayed value is
0.
Chapter 16. Improving latency using the tuna CLI
You can use the tuna CLI to improve latency on your system. The options used with the tuna command determine the method invoked to improve latency. By using the tuna CLI, you perform the following functions:
- Modify the scheduler tunables
- Tune a IRQ handlers and thread priorities
- Isolate CPU cores and sockets
- Reduce the complexity to tune tasks
16.1. Prerequisites
-
The
tunaand thepython-linux-procfspackages are installed. - You have root permissions on the system.
16.2. The tuna CLI
The tuna command-line interface (CLI) is a tool to help you make tuning changes to your system.
The tuna tool is designed to be used on a running system, and changes take place immediately. This allows any application-specific measurement tools to see and analyze system performance immediately after changes have been made.
The tuna CLI has both action options and modifier options. Modifier options must be specified on the command-line before the actions they are intended to modify. All modifier options apply to the actions that follow until the modifier options are overridden.
16.3. Isolating CPUs using the tuna CLI
You can use the tuna CLI to isolate interrupts (IRQs) from user processes on different dedicated CPUs to minimize latency in real-time environments. For more information about isolating CPUs, see Interrupt and process binding.
Prerequisites
-
The
tunaand thepython-linux-procfspackages are installed. - You have root permissions on the system.
Procedure
Isolate one or more CPUs.
# tuna --cpus=<cpu_list> --isolatecpu_listis a comma-separated list or a range of CPUs to isolate.For example:
# tuna --cpus=0,1 --isolate
16.4. Moving interrupts to specified CPUs using the tuna CLI
You can use the tuna CLI to move interrupts (IRQs) to dedicated CPUs to minimize or eliminate latency in real-time environments. For more information about moving IRQs, see Interrupt and process binding.
Prerequisites
-
The
tunaandpython-linux-procfspackages are installed. - You have root permissions on the system.
Procedure
List the CPUs to which a list of IRQs is attached.
# tuna --irqs=<irq_list> --show_irqsirq_listis a comma-separated list of the IRQs for which you want to list attached CPUs.For example:
# tuna --irqs=128 --show_irqs
   # users         affinity
 128 iwlwifi          0,1,2,3
Attach a list of IRQs to a list of CPUs.
# tuna --irqs=irq_list --cpus=<cpu_list> --moveirq_listis a comma-separated list of the IRQs you want to attach andcpu_listis a comma-separated list of the CPUs to which they will be attached or a range of CPUs.For example:
# tuna --irqs=128 --cpus=3 --move
Verification
Compare the state of the selected IRQs before and after moving any IRQ to a specified CPU.
# tuna --irqs=128 --show_irqs
   # users         affinity
 128 iwlwifi          3
16.5. Changing process scheduling policies and priorities using the tuna CLI
You can use the tuna CLI to change process scheduling policy and priority.
Prerequisites
-
The
tunaandpython-linux-procfspackages are installed. You have root permissions on the system.
NoteAssigning the
OTHERandBATCHscheduling policies does not require root permissions.
Procedure
View the information for a thread.
# tuna --threads=<thread_list> --show_threadsthread_listis a comma-separated list of the processes you want to display.For example:
# tuna --threads=rngd --show_threads
                      thread       ctxt_switches
    pid SCHED_ rtpri affinity voluntary nonvoluntary             cmd
  3571   OTHER     0  0,1,2,3    167697          134            rngd
Modify the process scheduling policy and the priority of the thread.
# tuna --threads=<thread_list> --priority scheduling_policy:priority_number-
thread_listis a comma-separated list of the processes whose scheduling policy and priority you want to display. scheduling_policyis one of the following:- OTHER
- BATCH
- FIFO - First In First Out
- RR - Round Robin
priority_numberis a priority number from 0 to 99, where0is no priority and99is the highest priority.NoteThe
OTHERandBATCHscheduling policies do not require specifying a priority. In addition, the only valid priority (if specified) is0. TheFIFOandRRscheduling policies require a priority of1or more.For example:
# tuna --threads=rngd --priority FIFO:1
-
Verification
- View the information for the thread to ensure that the information changes.
# *tuna --threads=rngd --show_threads*
                      thread       ctxt_switches
    pid SCHED_ rtpri affinity voluntary nonvoluntary           cmd
  3571   FIFO     1  0,1,2,3    167697          134            rngd
Chapter 17. Setting scheduler priorities
Red Hat Enterprise Linux for Real Time kernel allows fine-grained control of scheduler priorities. It also allows application-level programs to be scheduled at a higher priority than kernel threads.
Setting scheduler priorities can carry consequences and may cause the system to become unresponsive or behave unpredictably if crucial kernel processes are prevented from running as needed. Ultimately, the correct settings are workload-dependent.
17.1. Viewing thread scheduling priorities
Thread priorities are set using a series of levels, ranging from 0 (lowest priority) to 99 (highest priority). The systemd service manager can be used to change the default priorities of threads after the kernel boots.
Procedure
To view scheduling priorities of running threads, use the tuna utility:
# tuna --show_threads
                      thread       ctxt_switches
    pid SCHED_ rtpri affinity voluntary nonvoluntary             cmd
  2      OTHER     0    0xfff       451            3        kthreadd
  3       FIFO     1        0     46395            2     ksoftirqd/0
  5      OTHER     0        0        11            1    kworker/0:0H
  7       FIFO    99        0         9            1   posixcputmr/0
  ...[output truncated]...
17.2. Changing the priority of services during booting
Using systemd, you can set up real-time priority for services launched during the boot process.
Unit configuration directives are used to change the priority of a service during boot process. The boot process priority change is done by using the following directives in the service section of /etc/systemd/system/service.service.d/priority.conf:
CPUSchedulingPolicy=
Sets the CPU scheduling policy for executed processes. Takes one of the scheduling classes available on Linux:
-
other -
batch -
idle -
fifo -
rr
CPUSchedulingPriority=
Sets the CPU scheduling priority for an executed processes. The available priority range depends on the selected CPU scheduling policy. For real-time scheduling policies, an integer between 1 (lowest priority) and 99 (highest priority) can be used.
Prerequisites
- You have administrator privileges.
- A service that runs on boot.
Procedure
For an existing service:
Create a supplementary service configuration directory file for the service.
# cat <<-EOF > /etc/systemd/system/mcelog.service.d/priority.confAdd the scheduling policy and priority to the file in the
[Service]section.For example:
[Service]
CPUSchedulingPolicy=fifo
CPUSchedulingPriority=20
EOF
Reload the
systemdscripts configuration.# systemctl daemon-reloadRestart the service.
# systemctl restart mcelog
Verification
Display the service’s priority.
$ tuna -t mcelog -PThe output shows the configured priority of the service.
For example:
                    thread       ctxt_switches
  pid SCHED_ rtpri affinity voluntary nonvoluntary             cmd
826     FIFO    20  0,1,2,3        13            0          mcelog
Additional resources
17.3. Configuring the CPU usage of a service
Using systemd, you can specify the CPUs on which services can run.
Prerequisites
- You have administrator privileges.
Procedure
Create a supplementary service configuration directory file for the service.
# md sscdAdd the CPUs to use for the service to the file using the
CPUAffinityattribute in the[Service]section.For example:
[Service]
CPUAffinity=0,1
EOF
Reload the systemd scripts configuration.
# systemctl daemon-reloadRestart the service.
# systemctl restart service
Verification
Display the CPUs to which the specified service is limited.
$ tuna -t mcelog -Pwhere
serviceis the specified service.The following output shows that the
mcelogservice is limited to CPUs 0 and 1.thread ctxt_switches pid SCHED_ rtpri affinity voluntary nonvoluntary cmd 12954 FIFO 20 0,1 2 1 mcelog
17.4. Priority map
Scheduler priorities are defined in groups, with some groups dedicated to particular kernel functions.
Table 17.1. Thread priority table
| Priority | Threads | Description |
|---|---|---|
| 1 | Low priority kernel threads |
This priority is usually reserved for the tasks that need to be just above |
| 2 - 49 | Available for use | The range used for typical application priorities. |
| 50 | Default hard-IRQ value | This priority is the default value for hardware-based interrupts. |
| 51 - 98 | High priority threads |
Use this range for threads that execute periodically and must have quick response times. Do |
| 99 | Watchdogs and migration | System threads that must run at the highest priority. |
17.5. Additional resources
Chapter 18. Network determinism tips
TCP can have a large effect on latency. TCP adds latency in order to obtain efficiency, control congestion, and to ensure reliable delivery. When tuning, consider the following points:
- Do you need ordered delivery?
Do you need to guard against packet loss?
Transmitting packets more than once can cause delays.
Do you need to use TCP?
Consider disabling the Nagle buffering algorithm by using
TCP_NODELAYon your socket. The Nagle algorithm collects small outgoing packets to send all at once, and can have a detrimental effect on latency.
18.1. Coalescing interrupts
In systems that transfer large amounts of data where throughput is a priority, using the default value or increasing coalescence can increase throughput and lower the number of interrupts hitting CPUs. For systems requiring a rapid network response, reducing or disabling coalescence is advised.
To reduce the number of interrupts, packets can be collected and a single interrupt generated for a collection of packets.
Prerequisites
- You have administrator privileges.
Procedure
To enable coalescing interrupts, run the
ethtoolcommand with the--coalesceoption.# ethtool -C tun0
Verification
Verify that coalescing interrupts are enabled.
# ethtool -c tun0
Coalesce parameters for tun0:
Adaptive RX: n/a  TX: n/a
stats-block-usecs: n/a
sample-interval: n/a
pkt-rate-low: n/a
pkt-rate-high: n/a

rx-usecs: n/a
rx-frames: 0
rx-usecs-irq: n/a
rx-frames-irq: n/a

tx-usecs: n/a
tx-frames: n/a
tx-usecs-irq: n/a
tx-frames-irq: n/a

rx-usecs-low: n/a
rx-frame-low: n/a
tx-usecs-low: n/a
tx-frame-low: n/a

rx-usecs-high: n/a
rx-frame-high: n/a
tx-usecs-high: n/a
tx-frame-high: n/a

CQE mode RX: n/a  TX: n/a
18.2. Avoiding network congestion
I/O switches can often be subject to back-pressure, where network data builds up as a result of full buffers. You can change pause parameters and avoid network congestion.
Prerequisites
- You have administrator privileges.
Procedure
To change pause parameters, run the
ethtoolcommand with the-Aoption.# ethtool -A enp0s31f6
Verification
Verify that the pause parameter changed.
# ethtool -a enp0s31f6
Pause parameters for enp0s31f6:
Autonegotiate:	on
RX:		on
TX:		on
18.3. Monitoring network protocol statistics
The netstat command can be used to monitor network traffic.
Procedure
To monitor network traffic:
$ netstat -s
Ip:
    Forwarding: 1
    30817508 total packets received
    2927 forwarded
    0 incoming packets discarded
    30813320 incoming packets delivered
    19184491 requests sent out
    181 outgoing packets dropped
    2628 dropped because of missing route
Icmp
    29450 ICMP messages received
    213 input ICMP message failed
    ICMP input histogram:
        destination unreachable: 29431
        echo requests: 19
    10141 ICMP messages sent
    0 ICMP messages failed
    ICMP output histogram:
        destination unreachable: 10122
        echo replies: 19
IcmpMsg:
        InType3: 29431
        InType8: 19
        OutType0: 19
        OutType3: 10122
Tcp:
    162638 active connection openings
    89 passive connection openings
    38908 failed connection attempts
    17869 connection resets received
    48 connections established
    8456952 segments received
    9323882 segments sent out
    69885 segments retransmitted
    1143 bad segments received
    56209 resets sent
Udp:
    21929780 packets received
    1319 packets to unknown port received
    712919 packet receive errors
    10134989 packets sent
    712919 receive buffer errors
    180 send buffer errors
    IgnoredMulti: 39231
18.4. Additional resources
-
ethtool(8)man page -
netstat(8)man page
Chapter 19. Tracing latencies with trace-cmd
The trace-cmd utility is a front end to the ftrace utility. By using trace-cmd, you can enable ftrace actions, without the need to write to the /sys/kernel/debug/tracing/ directory. trace-cmd does not add any overhead on its installation.
Prerequisites
- You have administrator privileges.
19.1. Installing trace-cmd
The trace-cmd utility provides a front-end to the ftrace utility.
Prerequisites
- You have administrator privileges.
Procedure
Install the
trace-cmdutility.# yum install trace-cmd
19.2. Running trace-cmd
You can use the trace-cmd utility to access all ftrace functionalities.
Prerequisites
- You have administrator privileges.
Procedure
Enter
trace-cmd commandwhere
commandis anftraceoption.NoteSee the
trace-cmd(1)man page for a complete list of commands and options. Most of the individual commands also have their own man pages,trace-cmd-command.
19.3. trace-cmd examples
The command examples show how to trace kernel functions by using the trace-cmd utility.
Examples
Enable and start recording functions executing within the kernel while myapp runs.
# trace-cmd record -p function myapp
This records functions from all CPUs and all tasks, even those not related to myapp.
Display the result.
# trace-cmd reportRecord only functions that start with sched while myapp runs.
# trace-cmd record -p function -l 'sched*' myapp
Enable all the IRQ events.
# trace-cmd start -e irqStart the
wakeup_rttracer.# trace-cmd start -p wakeup_rtStart the
preemptirqsofftracer, while disabling function tracing.# trace-cmd start -p preemptirqsoff -dNoteThe version of
trace-cmdin RHEL 8 turns offftrace_enabledinstead of using thefunction-traceoption. You can enableftraceagain withtrace-cmd start -pfunction.Restore the state in which the system was before
trace-cmdstarted modifying it.# trace-cmd start -p nopThis is important if you want to use the
debugfsfile system after usingtrace-cmd, whether or not the system was restarted in the meantime.Trace a single trace point.
# trace-cmd record -e sched_wakeup ls /binStop tracing.
# trace-cmd record stop
19.4. Additional resources
-
trace-cmd(1)man page
Chapter 20. Isolating CPUs using tuned-profiles-real-time
To give application threads the most execution time possible, you can isolate CPUs. Therefore, remove as many extraneous tasks from a CPU as possible. Isolating CPUs generally involves:
- Removing all user-space threads.
- Removing any unbound kernel threads. Kernel related bound threads are linked to a specific CPU and cannot not be moved).
-
Removing interrupts by modifying the
/proc/irq/N/smp_affinityproperty of each Interrupt Request (IRQ) numberNin the system.
By using the isolated_cores=cpulist configuration option of the tuned-profiles-realtime package, you can automate operations to isolate a CPU.
Prerequisites
- You have administrator privileges.
20.1. Choosing CPUs to isolate
Choosing the CPUs to isolate requires careful consideration of the CPU topology of the system. Different use cases require different configuration:
- If you have a multi-threaded application where threads need to communicate with one another by sharing cache, they need to be kept on the same NUMA node or physical socket.
- If you run multiple unrelated real-time applications, separating the CPUs by NUMA node or socket can be suitable.
The hwloc package provides utilities that are useful for getting information about CPUs, including lstopo-no-graphics and numactl.
Prerequisites
-
The
hwlocpackage are installed.
Procedure
View the layout of available CPUs in physical packages:
# lstopo-no-graphics --no-io --no-legend --of txtFigure 20.1. Showing the layout of CPUs using lstopo-no-graphics
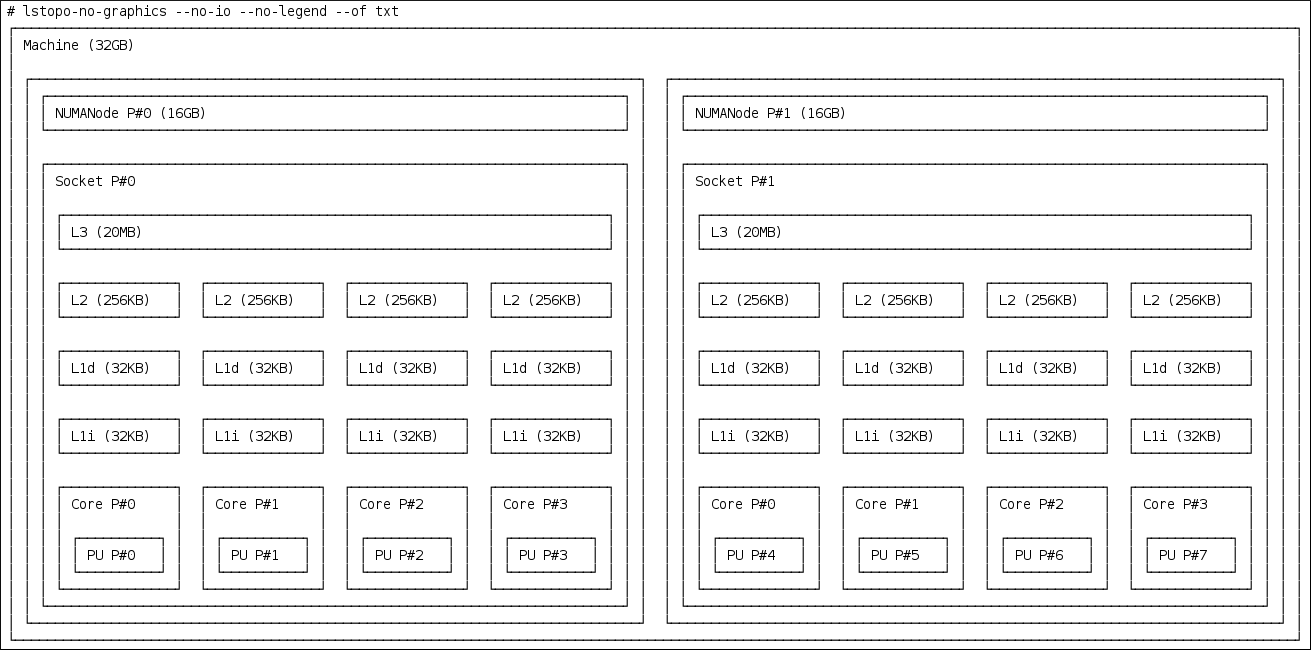
This command is useful for multi-threaded applications, because it shows how many cores and sockets are available and the logical distance of the NUMA nodes.
Additionally, the
hwloc-guipackage provides thelstopoutility, which produces graphical output.View more information about the CPUs, such as the distance between nodes:
# numactl --hardware
available: 2 nodes (0-1)
node 0 cpus: 0 1 2 3
node 0 size: 16159 MB
node 0 free: 6323 MB
node 1 cpus: 4 5 6 7
node 1 size: 16384 MB
node 1 free: 10289 MB
node distances:
node   0   1
  0:  10  21
  1:  21  10
Additional resources
-
the
hwloc(7)man page
20.2. Isolating CPUs using TuneD’s isolated_cores option
The initial mechanism for isolating CPUs is specifying the boot parameter isolcpus=cpulist on the kernel boot command line. The recommended way to do this for RHEL for Real Time is to use the TuneD daemon and its tuned-profiles-realtime package.
In tuned-profiles-realtime version 2.19 and later, the built-in function calc_isolated_cores applies the initial CPU setup automatically. The /etc/tuned/realtime-variables.conf configuration file includes the default variable content as isolated_cores=${f:calc_isolated_cores:2}.
By default, calc_isolated_cores reserves one core per socket for housekeeping and isolates the rest. If you must change the default configuration, comment out the isolated_cores=${f:calc_isolated_cores:2} line in /etc/tuned/realtime-variables.conf configuration file and follow the procedure steps for Isolating CPUs using TuneD’s isolated_cores option.
Prerequisites
-
The
TuneDandtuned-profiles-realtimepackages are installed. - You have root permissions on the system.
Procedure
-
As a root user, open
/etc/tuned/realtime-variables.confin a text editor. Set
isolated_cores=cpulistto specify the CPUs that you want to isolate. You can use CPU numbers and ranges.Examples:
isolated_cores=0-3,5,7
This isolates cores 0, 1, 2, 3, 5, and 7.
In a two socket system with 8 cores, where NUMA node 0 has cores 0-3 and NUMA node 1 has cores 4-8, to allocate two cores for a multi-threaded application, specify:
isolated_cores=4,5
This prevents any user-space threads from being assigned to CPUs 4 and 5.
To pick CPUs from different NUMA nodes for unrelated applications, specify:
isolated_cores=0,4
This prevents any user-space threads from being assigned to CPUs 0 and 4.
Activate the real-time
TuneDprofile using thetuned-admutility.# tuned-adm profile realtime- Reboot the machine for changes to take effect.
Verification
Search for the
isolcpusparameter in the kernel command line:$ cat /proc/cmdline | grep isolcpus BOOT_IMAGE=/vmlinuz-4.18.0-305.rt7.72.el8.x86_64 root=/dev/mapper/rhel_foo-root ro crashkernel=auto rd.lvm.lv=rhel_foo/root rd.lvm.lv=rhel_foo/swap console=ttyS0,115200n81 isolcpus=0,4
20.3. Isolating CPUs using the nohz and nohz_full parameters
The nohz and nohz_full parameters modify activity on specified CPUs. To enable these kernel boot parameters, you need to use one of the following TuneD profiles: realtime-virtual-host, realtime-virtual-guest, or cpu-partitioning.
nohz=onReduces timer activity on a particular set of CPUs.
The
nohzparameter is mainly used to reduce timer interrupts on idle CPUs. This helps battery life by allowing idle CPUs to run in reduced power mode. While not being directly useful for real-time response time, thenohzparameter does not directly impact real-time response time negatively. But thenohzparameter is required to activate thenohz_fullparameter that does have positive implications for real-time performance.nohz_full=cpulist-
The
nohz_fullparameter treats the timer ticks of a list of specified CPUs differently. If a CPU is specified as anohz_fullCPU and there is only one runnable task on the CPU, then the kernel stops sending timer ticks to that CPU. As a result, more time may be spent running the application and less time spent servicing interrupts and context switching.
Additional resources
Chapter 21. Limiting SCHED_OTHER task migration
You can limit the tasks that SCHED_OTHER migrates to other CPUs using the sched_nr_migrate variable.
Prerequisites
- You have administrator privileges.
21.1. Task migration
If a SCHED_OTHER task spawns a large number of other tasks, they will all run on the same CPU. The migration task or softirq will try to balance these tasks so they can run on idle CPUs.
The sched_nr_migrate option can be adjusted to specify the number of tasks that will move at a time. Because real-time tasks have a different way to migrate, they are not directly affected by this. However, when softirq moves the tasks, it locks the run queue spinlock, thus disabling interrupts.
If there are a large number of tasks that need to be moved, it occurs while interrupts are disabled, so no timer events or wakeups will be allowed to happen simultaneously. This can cause severe latencies for real-time tasks when sched_nr_migrate is set to a large value.
21.2. Limiting SCHED_OTHER task migration using the sched_nr_migrate variable
Increasing the sched_nr_migrate variable provides high performance from SCHED_OTHER threads that spawn many tasks at the expense of real-time latency.
For low real-time task latency at the expense of SCHED_OTHER task performance, the value must be lowered. The default value is 8.
Procedure
To adjust the value of the
sched_nr_migratevariable, echo the value directly to/proc/sys/kernel/sched_nr_migrate:# echo 2 > /proc/sys/kernel/sched_nr_migrate
Verification
View the contents of
/proc/sys/kernel/sched_nr_migrate:# cat > /proc/sys/kernel/sched_nr_migrate 2
Chapter 22. Reducing TCP performance spikes
Generating TCP timestamps can result in TCP performance spikes. The sysctl command controls the values of TCP related entries, setting the timestamps kernel parameter found at /proc/sys/net/ipv4/tcp_timestamps.
Prerequisites
- You have administrator privileges.
22.1. Turning off TCP timestamps
Turning off TCP timestamps can reduce TCP performance spikes.
Procedure
Turn off TCP timestamps:
# sysctl -w net.ipv4.tcp_timestamps=0
net.ipv4.tcp_timestamps = 0
The output shows that the value of
net.ip4.tcp_timestampsoptions is0. That is, TCP timestamps are disabled.
22.2. Turning on TCP timestamps
Generating timestamps can cause TCP performance spikes. You can reduce TCP performance spikes by disabling TCP timestamps. If you find that generating TCP timestamps is not causing TCP performance spikes, you can enable them.
Procedure
Enable TCP timestamps.
# sysctl -w net.ipv4.tcp_timestamps=1
net.ipv4.tcp_timestamps = 1
The output shows that the value of
net.ip4.tcp_timestampsis1. That is, TCP timestamps are enabled.
22.3. Displaying the TCP timestamp status
You can view the status of TCP timestamp generation.
Procedure
Display the TCP timestamp generation status:
# sysctl net.ipv4.tcp_timestamps
net.ipv4.tcp_timestamps = 0
The value
1indicates that timestamps are being generated. The value0indicates timestamps are being not generated.
Chapter 23. Improving CPU performance by using RCU callbacks
The Read-Copy-Update (RCU) system is a lockless mechanism for mutual exclusion of threads inside the kernel. As a consequence of performing RCU operations, call-backs are sometimes queued on CPUs to be performed at a future moment when removing memory is safe.
To improve CPU performance using RCU callbacks:
- You can remove CPUs from being candidates for running CPU callbacks.
- You can assign a CPU to handle all RCU callbacks. This CPU is called the housekeeping CPU.
- You can relieve CPUs from the responsibility of awakening RCU offload threads.
This combination reduces the interference on CPUs that are dedicated for the user’s workload.
Prerequisites
- You have administrator privileges.
-
The
tunapackage is installed
23.1. Offloading RCU callbacks
You can offload RCU callbacks using the rcu_nocbs and rcu_nocb_poll kernel parameters.
Procedure
To remove one or more CPUs from the candidates for running RCU callbacks, specify the list of CPUs in the
rcu_nocbskernel parameter, for example:rcu_nocbs=1,4-6
or
rcu_nocbs=3
The second example instructs the kernel that CPU 3 is a no-callback CPU. This means that RCU callbacks will not be done in the
rcuc/$CPUthread pinned to CPU 3, but in thercuo/$CPUthread. You can move this trhead to a housekeeping CPU to relieve CPU 3 from being assigned RCU callback jobs.
23.2. Moving RCU callbacks
You can assign a housekeeping CPU to handle all RCU callback threads. To do this, use the tuna command and move all RCU callbacks to the housekeeping CPU.
Procedure
Move RCU callback threads to the housekeeping CPU:
# tuna --threads=rcu --cpus=x --movewhere
xis the CPU number of the housekeeping CPU.
This action relieves all CPUs other than CPU X from handling RCU callback threads.
23.3. Relieving CPUs from awakening RCU offload threads
Although the RCU offload threads can perform the RCU callbacks on another CPU, each CPU is responsible for awakening the corresponding RCU offload thread. You can relieve a CPU from this responsibility,
Procedure
Set the
rcu_nocb_pollkernel parameter.This command causes a timer to periodically raise the RCU offload threads to check if there are callbacks to run.
23.4. Additional resources
Chapter 24. Tracing latencies using ftrace
The ftrace utility is one of the diagnostic facilities provided with the RHEL for Real Time kernel. ftrace can be used by developers to analyze and debug latency and performance issues that occur outside of the user-space. The ftrace utility has a variety of options that allow you to use the utility in different ways. It can be used to trace context switches, measure the time it takes for a high-priority task to wake up, the length of time interrupts are disabled, or list all the kernel functions executed during a given period.
Some of the ftrace tracers, such as the function tracer, can produce exceedingly large amounts of data, which can turn trace log analysis into a time-consuming task. However, you can instruct the tracer to begin and end only when the application reaches critical code paths.
Prerequisites
- You have administrator privileges.
24.1. Using the ftrace utility to trace latencies
You can trace latencies using the ftrace utility.
Procedure
View the available tracers on the system.
# cat /sys/kernel/debug/tracing/available_tracers
function_graph wakeup_rt wakeup preemptirqsoff preemptoff irqsoff function nop
The user interface for
ftraceis a series of files withindebugfs.The
ftracefiles are also located in the/sys/kernel/debug/tracing/directory.Move to the
/sys/kernel/debug/tracing/directory.# cd /sys/kernel/debug/tracingThe files in this directory can only be modified by the root user, because enabling tracing can have an impact on the performance of the system.
To start a tracing session:
-
Select a tracer you want to use from the list of available tracers in
/sys/kernel/debug/tracing/available_tracers. Insert the name of the selector into the
/sys/kernel/debug/tracing/current_tracer.# echo preemptoff > /sys/kernel/debug/tracing/current_tracerNoteIf you use a single '>' with the echo command, it will override any existing value in the file. If you wish to append the value to the file, use '>>' instead.
-
Select a tracer you want to use from the list of available tracers in
The function-trace option is useful because tracing latencies with
wakeup_rt,preemptirqsoff, and so on automatically enablesfunction tracing, which may exaggerate the overhead.Check if
functionandfunction_graphtracing are enabled:# cat /sys/kernel/debug/tracing/options/function-trace 1-
A value of
1indicates thatfunctionandfunction_graphtracing are enabled. -
A value of
0indicates thatfunctionandfunction_graphtracing are disabled.
-
A value of
By default,
functionandfunction_graphtracing are enabled. To turnfunctionandfunction_graphtracing on or off, echo the appropriate value to the/sys/kernel/debug/tracing/options/function-tracefile.# echo 0 > /sys/kernel/debug/tracing/options/function-trace # echo 1 > /sys/kernel/debug/tracing/options/function-trace
ImportantWhen using the
echocommand, ensure you place a space character in between the value and the>character. At the shell prompt, using0>,1>, and2>(without a space character) refers to standard input, standard output, and standard error. Using them by mistake could result in an unexpected trace output.Adjust the details and parameters of the tracers by changing the values for the various files in the
/debugfs/tracing/directory.For example:
The
irqsoff,preemptoff,preempirqsoff, andwakeuptracers continuously monitor latencies. When they record a latency greater than the one recorded intracing_max_latencythe trace of that latency is recorded, andtracing_max_latencyis updated to the new maximum time. In this way,tracing_max_latencyalways shows the highest recorded latency since it was last reset.To reset the maximum latency, echo
0into thetracing_max_latencyfile:# echo 0 > /sys/kernel/debug/tracing/tracing_max_latencyTo see only latencies greater than a set amount, echo the amount in microseconds:
# echo 200 > /sys/kernel/debug/tracing/tracing_max_latencyWhen the tracing threshold is set, it overrides the maximum latency setting. When a latency is recorded that is greater than the threshold, it will be recorded regardless of the maximum latency. When reviewing the trace file, only the last recorded latency is shown.
To set the threshold, echo the number of microseconds above which latencies must be recorded:
# echo 200 > /sys/kernel/debug/tracing/tracing_thresh
View the trace logs:
# cat /sys/kernel/debug/tracing/traceTo store the trace logs, copy them to another file:
# cat /sys/kernel/debug/tracing/trace > /tmp/lat_trace_logView the functions being traced:
# cat /sys/kernel/debug/tracing/set_ftrace_filter-
Filter the functions being traced by editing the settings in
/sys/kernel/debug/tracing/set_ftrace_filter. If no filters are specified in the file, all functions are traced. To change filter settings, echo the name of the function to be traced. The filter allows the use of a '*' wildcard at the beginning or end of a search term.
For examples, see ftrace examples.
24.2. ftrace files
The following are the main files in the /sys/kernel/debug/tracing/ directory.
ftrace files
- trace
-
The file that shows the output of an
ftracetrace. This is really a snapshot of the trace in time, because the trace stops when this file is read, and it does not consume the events read. That is, if the user disabled tracing and reads this file, it will report the same thing every time it is read. - trace_pipe
-
The file that shows the output of an
ftracetrace as it reads the trace live. It is a producer/consumer trace. That is, each read will consume the event that is read. This can be used to read an active trace without stopping the trace as it is read. - available_tracers
- A list of ftrace tracers that have been compiled into the kernel.
- current_tracer
-
Enables or disables an
ftracetracer. - events
- A directory that contains events to trace and can be used to enable or disable events, as well as set filters for the events.
- tracing_on
-
Disable and enable recording to the
ftracebuffer. Disabling tracing via thetracing_onfile does not disable the actual tracing that is happening inside the kernel. It only disables writing to the buffer. The work to do the trace still happens, but the data does not go anywhere.
24.3. ftrace tracers
Depending on how the kernel is configured, not all tracers may be available for a given kernel. For the RHEL for Real Time kernels, the trace and debug kernels have different tracers than the production kernel does. This is because some of the tracers have a noticeable overhead when the tracer is configured into the kernel, but not active. Those tracers are only enabled for the trace and debug kernels.
Tracers
- function
- One of the most widely applicable tracers. Traces the function calls within the kernel. This can cause noticeable overhead depending on the number of functions traced. When not active, it creates little overhead.
- function_graph
The
function_graphtracer is designed to present results in a more visually appealing format. This tracer also traces the exit of the function, displaying a flow of function calls in the kernel.NoteThis tracer has more overhead than the
functiontracer when enabled, but the same low overhead when disabled.- wakeup
- A full CPU tracer that reports the activity happening across all CPUs. It records the time that it takes to wake up the highest priority task in the system, whether that task is a real time task or not. Recording the max time it takes to wake up a non-real time task hides the times it takes to wake up a real time task.
- wakeup_rt
- A full CPU tracer that reports the activity happening across all CPUs. It records the time that it takes from the current highest priority task to wake up to until the time it is scheduled. This tracer only records the time for real time tasks.
- preemptirqsoff
- Traces the areas that disable preemption or interrupts, and records the maximum amount of time for which preemption or interrupts were disabled.
- preemptoff
- Similar to the preemptirqsoff tracer, but traces only the maximum interval for which pre-emption was disabled.
- irqsoff
- Similar to the preemptirqsoff tracer, but traces only the maximum interval for which interrupts were disabled.
- nop
-
The default tracer. It does not provide any tracing facility itself, but as events may interleave into any tracer, the
noptracer is used for specific interest in tracing events.
24.4. ftrace examples
The following provides a number of examples for changing the filtering of functions being traced. You can use the * wildcard at both the beginning and end of a word. For example: *irq\* will select all functions that contain irq in the name. The wildcard cannot, however, be used inside a word.
Encasing the search term and the wildcard character in double quotation marks ensures that the shell will not attempt to expand the search to the present working directory.
Examples of filters
Trace only the
schedulefunction:# echo schedule > /sys/kernel/debug/tracing/set_ftrace_filter
Trace all functions that end with
lock:# echo "*lock" > /sys/kernel/debug/tracing/set_ftrace_filter
Trace all functions that start with
spin_:# echo "spin_*" > /sys/kernel/debug/tracing/set_ftrace_filter
Trace all functions with
cpuin the name:# echo "cpu" > /sys/kernel/debug/tracing/set_ftrace_filter
Chapter 25. Application timestamping
Applications that perform frequent timestamps are affected by the CPU cost of reading the clock. The high cost and amount of time used to read the clock can have a negative impact on an application’s performance.
You can reduce the cost of reading the clock by selecting a hardware clock that has a reading mechanism, faster than that of the default clock.
In RHEL for Real Time, a further performance gain can be acquired by using POSIX clocks with the clock_gettime() function to produce clock readings with the lowest possible CPU cost.
These benefits are more evident on systems which use hardware clocks with high reading costs.
25.1. POSIX clocks
POSIX is a standard for implementing and representing time sources. You can assign a POSIX clock to an application without affecting other applications in the system. This is in contrast to hardware clocks which are selected by the kernel and implemented across the system.
The function used to read a given POSIX clock is clock_gettime(), which is defined at <time.h>. The kernel counterpart to clock_gettime() is a system call. When a user process calls clock_gettime():
-
The corresponding C library (
glibc) calls thesys_clock_gettime()system call. -
sys_clock_gettime()performs the requested operation. -
sys_clock_gettime()returns the result to the user program.
However, the context switch from the user application to the kernel has a CPU cost. Even though this cost is very low, if the operation is repeated thousands of times, the accumulated cost can have an impact on the overall performance of the application. To avoid context switching to the kernel, thus making it faster to read the clock, support for the CLOCK_MONOTONIC_COARSE and CLOCK_REALTIME_COARSE POSIX clocks was added, in the form of a virtual dynamic shared object (VDSO) library function.
Time readings performed by clock_gettime(), using one of the _COARSE clock variants, do not require kernel intervention and are executed entirely in user space. This yields a significant performance gain. Time readings for _COARSE clocks have a millisecond (ms) resolution, meaning that time intervals smaller than 1 ms are not recorded. The _COARSE variants of the POSIX clocks are suitable for any application that can accommodate millisecond clock resolution.
To compare the cost and resolution of reading POSIX clocks with and without the _COARSE prefix, see the RHEL for Real Time Reference guide.
25.2. The _COARSE clock variant in clock_gettime
The example code output shows using the clock_gettime function with the CLOCK_MONOTONIC_COARSE POSIX clock.
#include <time.h>

main()
{
	int rc;
	long i;
	struct timespec ts;

	for(i=0; i<10000000; i++) {
		rc = clock_gettime(CLOCK_MONOTONIC_COARSE, &ts);
	}
}
You can improve upon the example above by adding checks to verify the return code of clock_gettime(), to verify the value of the rc variable, or to ensure the content of the ts structure is to be trusted.
The clock_gettime() man page provides more information about writing more reliable applications.
Programs using the clock_gettime() function must be linked with the rt library by adding -lrt to the gcc command line.
$ gcc clock_timing.c -o clock_timing -lrt
25.3. Additional resources
-
clock_gettime()man page
Chapter 26. Improving network latency using TCP_NODELAY
By default, TCP uses Nagle’s algorithm to collect small outgoing packets to send all at once. This can cause higher rates of latency.
Prerequisites
- You have administrator privileges.
26.1. The effects of using TCP_NODELAY
Applications that require low latency on every packet sent must be run on sockets with the TCP_NODELAY option enabled. This sends buffer writes to the kernel as soon as an event occurs.
- Note
-
For
TCP_NODELAYto be effective, applications must avoid doing small, logically related buffer writes. Otherwise, these small writes causeTCPto send these multiple buffers as individual packets, resulting in poor overall performance.
If applications have several buffers that are logically related and must be sent as one packet, apply one of the following workarounds to avoid poor performance:
-
Build a contiguous packet in memory and then send the logical packet to
TCPon a socket configured withTCP_NODELAY. -
Create an I/O vector and pass it to the kernel using the
writevcommand on a socket configured withTCP_NODELAY. -
Use the
TCP_CORKoption.TCP_CORKtellsTCPto wait for the application to remove the cork before sending any packets. This command causes the buffers it receives to be appended to the existing buffers. This allows applications to build a packet in kernel space, which can be required when using different libraries that provide abstractions for layers.
When a logical packet has been built in the kernel by the various components in the application, the socket should be uncorked, allowing TCP to send the accumulated logical packet immediately.
26.2. Enabling TCP_NODELAY
The TCP_NODELAY option sends buffer writes to the kernel when events occur, with no delays. Enable TCP_NODELAY using the setsockopt() function.
Procedure
Add the following lines to the
TCPapplication’s.cfile.int one = 1; setsockopt(descriptor, SOL_TCP, TCP_NODELAY, &one, sizeof(one));
- Save the file and exit the editor.
Apply one of the following workarounds to prevent poor performance.
-
Build a contiguous packet in memory and then send the logical packet to
TCPon a socket configured withTCP_NODELAY. -
Create an I/O vector and pass it to the kernel using
writevon a socket configured withTCP_NODELAY.
-
Build a contiguous packet in memory and then send the logical packet to
26.3. Enabling TCP_CORK
The TCP_CORK option prevents TCP from sending any packets until the socket is "uncorked".
Procedure
Add the following lines to the
TCPapplication’s.cfile.int one = 1; setsockopt(descriptor, SOL_TCP, TCP_CORK, &one, sizeof(one));
- Save the file and exit the editor.
After the logical packet has been built in the kernel by the various components in the application, disable
TCP_CORK.int zero = 0; setsockopt(descriptor, SOL_TCP, TCP_CORK, &zero, sizeof(zero));
TCPsends the accumulated logical packet immediately, without waiting for any further packets from the application.
26.4. Additional resources
-
tcp(7)man page -
setsockopt(3p)man page -
setsockopt(2)man page
Chapter 27. Preventing resource overuse by using mutex
Mutual exclusion (mutex) algorithms are used to prevent overuse of common resources.
27.1. Mutex options
Mutual exclusion (mutex) algorithms are used to prevent processes simultaneously using a common resource. A fast user-space mutex (futex) is a tool that allows a user-space thread to claim a mutex without requiring a context switch to kernel space, provided the mutex is not already held by another thread.
When you initialize a pthread_mutex_t object with the standard attributes, a private, non-recursive, non-robust, and non-priority inheritance-capable mutex is created. This object does not provide any of the benfits provided by the pthreads API and the RHEL for Real Time kernel.
To benefit from the pthreads API and the RHEL for Real Time kernel, create a pthread_mutexattr_t object. This object stores the attributes defined for the futex.
The terms futex and mutex are used to describe POSIX thread (pthread) mutex constructs.
27.2. Creating a mutex attribute object
To define any additional capabilities for the mutex, create a pthread_mutexattr_t object. This object stores the defined attributes for the futex. This is a basic safety procedure that you must always perform.
Procedure
Create the mutex attribute object using one of the following:
-
pthread_mutex_t(my_mutex); -
pthread_mutexattr_t(&my_mutex_attr); -
pthread_mutexattr_init(&my_mutex_attr);
-
For more information about advanced mutex attributes, see Advanced mutex attributes.
27.3. Creating a mutex with standard attributes
When you initialize a pthread_mutex_t object with the standard attributes, a private, non-recursive, non-robust, and non-priority inheritance-capable mutex is created.
Procedure
Create a mutex object under
pthreadsusing one of the following:-
pthread_mutex_t(my_mutex); pthread_mutex_init(&my_mutex, &my_mutex_attr);where
&my_mutex_attr;is a mutex attribute object.
-
27.4. Advanced mutex attributes
The following advanced mutex attributes can be stored in a mutex attribute object:
Mutex attributes
- Shared and private mutexes
Shared mutexes can be used between processes, however they can create a lot more overhead.
pthread_mutexattr_setpshared(&my_mutex_attr, PTHREAD_PROCESS_SHARED);- Real-time priority inheritance
You can avoid priority inversion problems by using priority inheritance.
pthread_mutexattr_setprotocol(&my_mutex_attr, PTHREAD_PRIO_INHERIT);- Robust mutexes
When a pthread dies, robust mutexes under the pthread are released. However, this comes with a high overhead cost. _NP in this string indicates that this option is non-POSIX or not portable.
pthread_mutexattr_setrobust_np(&my_mutex_attr, PTHREAD_MUTEX_ROBUST_NP);- Mutex initialization
Shared mutexes can be used between processes, however, they can create a lot more overhead.
pthread_mutex_init(&my_mutex_attr, &my_mutex);
27.5. Cleaning up a mutex attribute object
After the mutex has been created using the mutex attribute object, you can keep the attribute object to initialize more mutexes of the same type, or you can clean it up. The mutex is not affected in either case.
Procedure
Clean up the attribute object using the
_destroycommand.pthread_mutexattr_destroy(&my_mutex_attr);The mutex now operates as a regular pthread_mutex, and can be locked, unlocked, and destroyed as normal.
27.6. Additional resources
-
futex(7)man page -
pthread_mutex_destroy(P)man page -
pthread_mutexattr_setprotocol(3p)man page -
pthread_mutexattr_setprioceiling(3p)man page
Chapter 28. Analyzing application performance
Perf is a performance analysis tool. It provides a simple command line interface and abstracts the CPU hardware difference in Linux performance measurements. Perf is based on the perf_events interface exported by the kernel.
One advantage of perf is that it is both kernel and architecture neutral. The analysis data can be reviewed without requiring a specific system configuration.
Prerequisites
-
The
perfpackage must be installed on the system. - You have administrator privileges.
28.1. Collecting system-wide statistics
The perf record command is used for collecting system-wide statistics. It can be used in all processors.
Procedure
Collect system-wide performance statistics.
# perf record -a
^C[ perf record: Woken up 1 times to write data ]
[ perf record: Captured and wrote 0.725 MB perf.data (~31655 samples) ]
In this example, all CPUs are denoted with the
-aoption, and the process was terminated after a few seconds. The results show that it collected 0.725 MB of data and stored it to a newly-createdperf.datafile.
Verification
Ensure that the results file was created.
# ls
perf.data
28.2. Archiving performance analysis results
You can analyze the results of the perf on other systems using the perf archive command. This may not be necessary, if:
-
Dynamic Shared Objects (DSOs), such as binaries and libraries, are already present in the analysis system, such as the
~/.debug/cache. - Both systems have the same set of binaries.
Procedure
Create an archive of the results from the
perfcommand.# perf archiveCreate a tarball from the archive.
# tar cvf perf.data.tar.bz2 -C ~/.debug
28.3. Analyzing performance analysis results
The data from the perf record feature can now be investigated directly using the perf report command.
Procedure
Analyze the results directly from the
perf.datafile or from an archived tarball.# perf reportThe output of the report is sorted according to the maximum CPU usage in percentage by the application. It shows if the sample has occurred in the kernel or user space of the process.
The report shows information about the module from which the sample was taken:
-
A kernel sample that did not take place in a kernel module is marked with the notation
[kernel.kallsyms]. -
A kernel sample that took place in the kernel module is marked as
[module],[ext4]. For a process in user space, the results might show the shared library linked with the process.
The report denotes whether the process also occurs in kernel or user space.
-
The result
[.]indicates user space. -
The result
[k]indicates kernel space.
Finer grained details are available for review, including data appropriate for experienced
perfdevelopers.-
A kernel sample that did not take place in a kernel module is marked with the notation
28.4. Listing pre-defined events
There are a range of available options to get the hardware tracepoint activity.
Procedure
List pre-defined hardware and software events:
# perf list
List of pre-defined events (to be used in -e):
  cpu-cycles OR cycles                               [Hardware event]
  stalled-cycles-frontend OR idle-cycles-frontend    [Hardware event]
  stalled-cycles-backend OR idle-cycles-backend      [Hardware event]
  instructions                                       [Hardware event]
  cache-references                                   [Hardware event]
  cache-misses                                       [Hardware event]
  branch-instructions OR branches                    [Hardware event]
  branch-misses                                      [Hardware event]
  bus-cycles                                         [Hardware event]

  cpu-clock                                          [Software event]
  task-clock                                         [Software event]
  page-faults OR faults                              [Software event]
  minor-faults                                       [Software event]
  major-faults                                       [Software event]
  context-switches OR cs                             [Software event]
  cpu-migrations OR migrations                       [Software event]
  alignment-faults                                   [Software event]
  emulation-faults                                   [Software event]
  ...[output truncated]...
28.5. Getting statistics about specified events
You can view specific events using the perf stat command.
Procedure
View the number of context switches with the
perf statfeature:# perf stat -e context-switches -a sleep 5 ^Performance counter stats for 'sleep 5': 15,619 context-switches 5.002060064 seconds time elapsedThe results show that in 5 seconds, 15619 context switches took place.
View file system activity by running a script. The following shows an example script:
# for i in {1..100}; do touch /tmp/$i; sleep 1; doneIn another terminal run the
perf statcommand:# perf stat -e ext4:ext4_request_inode -a sleep 5 Performance counter stats for 'sleep 5': 5 ext4:ext4_request_inode 5.002253620 seconds time elapsedThe results show that in 5 seconds the script asked to create 5 files, indicating that there are 5
inoderequests.
28.6. Additional resources
-
perf help COMMAND -
perf(1) man page
Chapter 29. Stress testing real-time systems with stress-ng
The stress-ng tool measures the system’s capability to maintain a good level of efficiency under unfavorable conditions. The stress-ng tool is a stress workload generator to load and stress all kernel interfaces. It includes a wide range of stress mechanisms known as stressors. Stress testing makes a machine work hard and trip hardware issues such as thermal overruns and operating system bugs that occur when a system is being overworked.
There are over 270 different tests. These include CPU specific tests that exercise floating point, integer, bit manipulation, control flow, and virtual memory tests.
Use the stress-ng tool with caution as some of the tests can impact the system’s thermal zone trip points on a poorly designed hardware. This can impact system performance and cause excessive system thrashing which can be difficult to stop.
29.1. Testing CPU floating point units and processor data cache
A floating point unit is the functional part of the processor that performs floating point arithmetic operations. Floating point units handle mathematical operations and make floating numbers or decimal calculations simpler.
Using the --matrix-method option, you can stress test the CPU floating point operations and processor data cache.
Prerequisites
- You have root permissions on the systems
Procedure
To test the floating point on one CPU for 60 seconds, use the
--matrixoption:# stress-ng --matrix 1 -t 1mTo run multiple stressors on more than one CPUs for 60 seconds, use the
--timesor-toption:# stress-ng --matrix 0 -t 1m stress-ng --matrix 0 -t 1m --times stress-ng: info: [16783] dispatching hogs: 4 matrix stress-ng: info: [16783] successful run completed in 60.00s (1 min, 0.00 secs) stress-ng: info: [16783] for a 60.00s run time: stress-ng: info: [16783] 240.00s available CPU time stress-ng: info: [16783] 205.21s user time ( 85.50%) stress-ng: info: [16783] 0.32s system time ( 0.13%) stress-ng: info: [16783] 205.53s total time ( 85.64%) stress-ng: info: [16783] load average: 3.20 1.25 1.40The special mode with 0 stressors, query the available CPUs to run, removing the need to specify the CPU number.
The total CPU time required is 4 x 60 seconds (240 seconds), of which 0.13% is in the kernel, 85.50% is in user time, and
stress-ngruns 85.64% of all the CPUs.To test message passing between processes using a POSIX message queue, use the
-mqoption:# stress-ng --mq 0 -t 30s --times --perfThe
mqoption configures a specific number of processes to force context switches using the POSIX message queue. This stress test aims for low data cache misses.
29.2. Testing CPU with multiple stress mechanisms
The stress-ng tool runs multiple stress tests. In the default mode, it runs the specified stressor mechanisms in parallel.
Prerequisites
- You have root privileges on the systems
Procedure
Run multiple instances of CPU stressors as follows:
# stress-ng --cpu 2 --matrix 1 --mq 3 -t 5mIn the example,
stress-ngruns two instances of the CPU stressors, one instance of the matrix stressor and three instances of the message queue stressor to test for five minutes.To run all stress tests in parallel, use the
–alloption:# stress-ng --all 2In this example,
stress-ngruns two instances of all stress tests in parallel.To run each different stressor in a specific sequence, use the
--seqoption.# stress-ng --seq 4 -t 20In this example,
stress-ngruns all the stressors one by one for 20 minutes, with the number of instances of each stressor matching the number of online CPUs.To exclude specific stressors from a test run, use the
-xoption:# stress-ng --seq 1 -x numa,matrix,hddIn this example,
stress-ngruns all stressors, one instance of each, excludingnuma,hddandkeystressors mechanisms.
29.3. Measuring CPU heat generation
To measure the CPU heat generation, the specified stressors generate high temperatures for a short time duration to test the system’s cooling reliability and stability under maximum heat generation. Using the --matrix-size option, you can measure CPU temperatures in degrees Celsius over a short time duration.
Prerequisites
- You have root privileges on the system.
Procedure
To test the CPU behavior at high temperatures for a specified time duration, run the following command:
# stress-ng --matrix 0 --matrix-size 64 --tz -t 60

  stress-ng: info:  [18351] dispatching hogs: 4 matrix
  stress-ng: info:  [18351] successful run completed in 60.00s (1 min, 0.00 secs)
  stress-ng: info:  [18351] matrix:
  stress-ng: info:  [18351] x86_pkg_temp   88.00 °C
  stress-ng: info:  [18351] acpitz   87.00 °C
In this example, the
stress-ngconfigures the processor package thermal zone to reach 88 degrees Celsius over the duration of 60 seconds.(Optional) To print a report at the end of a run, use the
--tzoption:# stress-ng --cpu 0 --tz -t 60 stress-ng: info: [18065] dispatching hogs: 4 cpu stress-ng: info: [18065] successful run completed in 60.07s (1 min, 0.07 secs) stress-ng: info: [18065] cpu: stress-ng: info: [18065] x86_pkg_temp 88.75 °C stress-ng: info: [18065] acpitz 88.38 °C
29.4. Measuring test outcomes with bogo operations
The stress-ng tool can measure a stress test throughput by measuring the bogo operations per second. The size of a bogo operation depends on the stressor being run. The test outcomes are not precise, but they provide a rough estimate of the performance.
You must not use this measurement as an accurate benchmark metric. These estimates help to understand the system performance changes on different kernel versions or different compiler versions used to build stress-ng. Use the --metrics-brief option to display the total available bogo operations and the matrix stressor performance on your machine.
Prerequisites
- You have root privileges on the system.
Procedure
To measure test outcomes with bogo operations, use with the
--metrics-briefoption:# stress-ng --matrix 0 -t 60s --metrics-brief stress-ng: info: [17579] dispatching hogs: 4 matrix stress-ng: info: [17579] successful run completed in 60.01s (1 min, 0.01 secs) stress-ng: info: [17579] stressor bogo ops real time usr time sys time bogo ops/s bogo ops/s stress-ng: info: [17579] (secs) (secs) (secs) (real time) (usr+sys time) stress-ng: info: [17579] matrix 349322 60.00 203.23 0.19 5822.03 1717.25The
--metrics-briefoption displays the test outcomes and the total real-time bogo operations run by thematrixstressor for 60 seconds.
29.5. Generating a virtual memory pressure
When under memory pressure, the kernel starts writing pages out to swap. You can stress the virtual memory by using the --page-in option to force non-resident pages to swap back into the virtual memory. This causes the virtual machine to be heavily exercised. Using the --page-in option, you can enable this mode for the bigheap, mmap and virtual machine (vm) stressors. The --page-in option, touch allocated pages that are not in core, forcing them to page in.
Prerequisites
- You have root privileges on the system.
Procedure
To stress test a virtual memory, use the
--page-inoption:# stress-ng --vm 2 --vm-bytes 2G --mmap 2 --mmap-bytes 2G --page-inIn this example,
stress-ngtests memory pressure on a system with 4GB of memory, which is less than the allocated buffer sizes, 2 x 2GB ofvmstressor and 2 x 2GB ofmmapstressor with--page-inenabled.
29.6. Testing large interrupts loads on a device
Running timers at high frequency can generate a large interrupt load. The –timer stressor with an appropriately selected timer frequency can force many interrupts per second.
Prerequisites
- You have root permissions on the system.
Procedure
To generate an interrupt load, use the
--timeroption:# stress-ng --timer 32 --timer-freq 1000000In this example,
stress-ngtests 32 instances at 1MHz.
29.7. Generating major page faults in a program
With stress-ng, you can test and analyze the page fault rate by generating major page faults in a page that are not loaded in the memory. On new kernel versions, the userfaultfd mechanism notifies the fault finding threads about the page faults in the virtual memory layout of a process.
Prerequisites
- You have root permissions on the system.
Procedure
To generate major page faults on early kernel versions, use:
# stress-ng --fault 0 --perf -t 1mTo generate major page faults on new kernel versions, use:
# stress-ng --userfaultfd 0 --perf -t 1m
29.8. Viewing CPU stress test mechanisms
The CPU stress test contains methods to exercise a CPU. You can print an output to view all methods using the which option.
If you do not specify the test method, by default, the stressor checks all the stressors in a round-robin fashion to test the CPU with each stressor.
Prerequisites
- You have root permissions on the system.
Procedure
Print all available stressor mechanisms, use the
whichoption:# stress-ng --cpu-method which cpu-method must be one of: all ackermann bitops callfunc cdouble cfloat clongdouble correlate crc16 decimal32 decimal64 decimal128 dither djb2a double euler explog fft fibonacci float fnv1a gamma gcd gray hamming hanoi hyperbolic idct int128 int64 int32Specify a specific CPU stress method using the
--cpu-methodoption:# stress-ng --cpu 1 --cpu-method fft -t 1m
29.9. Using the verify mode
The verify mode validates the results when a test is active. It sanity checks the memory contents from a test run and reports any unexpected failures.
All stressors do not have the verify mode and enabling one will reduce the bogo operation statistics because of the extra verification step being run in this mode.
Prerequisites
- You have root permissions on the system.
Procedure
To validate a stress test results, use the
--verifyoption:# stress-ng --vm 1 --vm-bytes 2G --verify -vIn this example,
stress-ngprints the output for an exhaustive memory check on a virtually mapped memory using thevmstressor configured with--verifymode. It sanity checks the read and write results on the memory.
Chapter 30. Creating and running containers
This section provides information about creating and running containers with the real-time kernel.
Prerequisites
-
Install
podmanand other container related utilities. - Get familiar with administration and management of Linux containers on RHEL.
-
Install the
kernel-rtpackage and other real-time related packages.
30.1. Creating a container
You can use all the following options with both the real time kernel and the main RHEL kernel. The kernel-rt package brings potential determinism improvements and allows the usual troubleshooting.
Prerequisites
- You have administrator privileges.
Procedure
The following procedure describes how to configure the Linux containers in relation with the real time kernel.
Create the directory you want to use for the container. For example:
# mkdir cyclictestChange into that directory:
# cd cyclictestLog into a host that provides a container registry service:
# podman login registry.redhat.io
Username: my_customer_portal_login
Password: ***
Login Succeeded!
Create the following
Dockerfile:# vim Dockerfile FROM rhel8 RUN subscription-manager repos --enable=rhel-8-for-x86_64-rt-rpm RUN dnf -y install rt-tests ENTRYPOINT cyclictest --smp -p95Build the container image from the directory containing the Dockerfile:
# podman build -t cyclictest .
30.2. Running a container
You can run a container built with a Dockerfile.
Procedure
Run a container using the
podman runcommand:# podman run --device=/dev/cpu_dma_latency --cap-add ipc_lock --cap-add sys_nice --cap-add sys_rawio --rm -ti cyclictest /dev/cpu_dma_latency set to 0us policy: fifo: loadavg: 0.08 0.10 0.09 2/947 15 T: 0 ( 8) P:95 I:1000 C: 3209 Min: 1 Act: 1 Avg: 1 Max: 14 T: 1 ( 9) P:95 I:1500 C: 2137 Min: 1 Act: 2 Avg: 1 Max: 23 T: 2 (10) P:95 I:2000 C: 1601 Min: 1 Act: 2 Avg: 2 Max: 7 T: 3 (11) P:95 I:2500 C: 1280 Min: 1 Act: 2 Avg: 2 Max: 72 T: 4 (12) P:95 I:3000 C: 1066 Min: 1 Act: 1 Avg: 1 Max: 7 T: 5 (13) P:95 I:3500 C: 913 Min: 1 Act: 2 Avg: 2 Max: 87 T: 6 (14) P:95 I:4000 C: 798 Min: 1 Act: 1 Avg: 2 Max: 7 T: 7 (15) P:95 I:4500 C: 709 Min: 1 Act: 2 Avg: 2 Max: 29
This example shows the podman run command with the required, real time-specific options. For example:
-
The first in first out (FIFO) scheduler policy is made available for workloads running inside the container through the
--cap-add=sys_niceoption. This option also allows setting the CPU affinity of threads, another important configuration dimension when tuning a real time workload. The
--device=/dev/cpu_dma_latencyoption makes the host device available inside the container (subsequently used by the cyclictest workload to configure the CPU idle time management). If the specified device is not made available, an error similar to the message below appears:WARN: stat /dev/cpu_dma_latency failed: No such file or directoryWhen confronted with error messages like these, refer to the podman-run(1) manual page. To get a specific workload running inside a container, other
podman-runoptions may be helpful.In some cases, you also need to add the
--device=/dev/cpuoption to add that directory hierarchy, mapping per-CPU device files such as/dev/cpu/*/msr.
30.3. Additional resources
Chapter 31. Displaying the priority for a process
You can display information about the priority of a process and information about the scheduling policy for a process using the sched_getattr attribute.
Prerequisites
- You have administrator privileges.
31.1. The chrt utility
The chrt utility checks and adjusts scheduler policies and priorities. It can start new processes with the desired properties or change the properties of a running process.
Additional resources
-
chrt(1)man page
31.2. Displaying the process priority using the chrt utility
You can display the current scheduling policy and scheduling priority for a specified process.
Procedure
Run the
chrtutility with the-poption, specifying a running process.# chrt -p 468 pid 468's current scheduling policy: SCHED_FIFO pid 468's current scheduling priority: 85 # chrt -p 476 pid 476's current scheduling policy: SCHED_OTHER pid 476's current scheduling priority: 0
31.3. Displaying the process priority using sched_getscheduler()
Real-time processes use a set of functions to control policy and priority. You can use the sched_getscheduler() function to display the scheduler policy for a specified process.
Procedure
Create the
get_sched.csource file and open it in a text editor.$ {EDITOR} get_sched.cAdd the following lines into the file.
#include <sched.h>
#include <unistd.h>
#include <stdio.h>

int main()
{
  int policy;
  pid_t pid = getpid();

  policy = sched_getscheduler(pid);
  printf("Policy for pid %ld is %i.\n", (long) pid, policy);
  return 0;
}
The
policyvariable holds the scheduler policy for the specified process.Compile the program.
$ gcc get_sched.c -o get_schedRun the program with varying policies.
$ chrt -o 0 ./get_sched
Policy for pid 27240 is 0.
$ chrt -r 10 ./get_sched
Policy for pid 27243 is 2.
$ chrt -f 10 ./get_sched
Policy for pid 27245 is 1.
Additional resources
-
sched_getscheduler(2)man page
31.4. Displaying the valid range for a scheduler policy
You can use the sched_get_priority_min() and sched_get_priority_max() functions to check the valid priority range for a given scheduler policy.
Procedure
Create the
sched_get.csource file and open it in a text editor.$ {EDITOR} sched_get.cEnter the following into the file:
#include <stdio.h> #include <unistd.h> #include <sched.h> int main() { printf("Valid priority range for SCHED_OTHER: %d - %d\n", sched_get_priority_min(SCHED_OTHER), sched_get_priority_max(SCHED_OTHER)); printf("Valid priority range for SCHED_FIFO: %d - %d\n", sched_get_priority_min(SCHED_FIFO), sched_get_priority_max(SCHED_FIFO)); printf("Valid priority range for SCHED_RR: %d - %d\n", sched_get_priority_min(SCHED_RR), sched_get_priority_max(SCHED_RR)); return 0; }NoteIf the specified scheduler policy is not known by the system, the function returns
-1anderrnois set toEINVAL.NoteBoth
SCHED_FIFOandSCHED_RRcan be any number within the range of1to99. POSIX is not guaranteed to honor this range, however, and portable programs should use these functions.- Save the file and exit the editor.
Compile the program.
$ gcc sched_get.c -o msched_get
The sched_get program is now ready and can be run from the directory in which it is saved.
Additional resources
-
sched_get_priority_min(2)man page -
sched_get_priority_max(2)man page
31.5. Displaying the timeslice for a process
The SCHED_RR (round-robin) policy differs slightly from the SCHED_FIFO (first-in, first-out) policy. SCHED_RR allocates concurrent processes that have the same priority in a round-robin rotation. In this way, each process is assigned a timeslice. The sched_rr_get_interval() function reports the timeslice allocated to each process.
Though POSIX requires that this function must work only with processes that are configured to run with the SCHED_RR scheduler policy, the sched_rr_get_interval() function can retrieve the timeslice length of any process on Linux.
Timeslice information is returned as a timespec. This is the number of seconds and nanoseconds since the base time of 00:00:00 GMT, 1 January 1970:
struct timespec {
  time_t tv_sec;  /* seconds / long tv_nsec; / nanoseconds */
};
Procedure
Create the
sched_timeslice.csource file and open it in a text editor.$ {EDITOR} sched_timeslice.cAdd the following lines to the
sched_timeslice.cfile.#include <stdio.h> #include <sched.h> int main() { struct timespec ts; int ret; /* real apps must check return values */ ret = sched_rr_get_interval(0, &ts); printf("Timeslice: %lu.%lu\n", ts.tv_sec, ts.tv_nsec); return 0; }- Save the file and exit the editor.
Compile the program.
$ gcc sched_timeslice.c -o sched_timesliceRun the program with varying policies and priorities.
$ chrt -o 0 ./sched_timeslice
Timeslice: 0.38994072
$ chrt -r 10 ./sched_timeslice
Timeslice: 0.99984800
$ chrt -f 10 ./sched_timeslice
Timeslice: 0.0
Additional resources
-
nice(2)man page -
getpriority(2)man page -
setpriority(2)man page
31.6. Displaying the scheduling policy and associated attributes for a process
The sched_getattr() function queries the scheduling policy currently applied to the specified process, identified by PID. If PID equals to zero, the policy of the calling process is retrieved.
The size argument should reflect the size of the sched_attr structure as known to userspace. The kernel fills out sched_attr::size to the size of its sched_attr structure.
If the input structure is smaller, the kernel returns values outside the provided space. As a result, the system call fails with an E2BIG error. The other sched_attr fields are filled out as described in The sched_attr structure.
Procedure
Create the
sched_timeslice.csource file and open it in a text editor.$ {EDITOR} sched_timeslice.cAdd the following lines to the
sched_timeslice.cfile.#define _GNU_SOURCE #include <unistd.h> #include <stdio.h> #include <stdlib.h> #include <string.h> #include <time.h> #include <linux/unistd.h> #include <linux/kernel.h> #include <linux/types.h> #include <sys/syscall.h> #include <pthread.h> #define gettid() syscall(__NR_gettid) #define SCHED_DEADLINE 6 /* XXX use the proper syscall numbers */ #ifdef __x86_64__ #define __NR_sched_setattr 314 #define __NR_sched_getattr 315 #endif struct sched_attr { __u32 size; __u32 sched_policy; __u64 sched_flags; /* SCHED_NORMAL, SCHED_BATCH */ __s32 sched_nice; /* SCHED_FIFO, SCHED_RR */ __u32 sched_priority; /* SCHED_DEADLINE (nsec) */ __u64 sched_runtime; __u64 sched_deadline; __u64 sched_period; }; int sched_getattr(pid_t pid, struct sched_attr *attr, unsigned int size, unsigned int flags) { return syscall(__NR_sched_getattr, pid, attr, size, flags); } int main (int argc, char **argv) { struct sched_attr attr; unsigned int flags = 0; int ret; ret = sched_getattr(0, &attr, sizeof(attr), flags); if (ret < 0) { perror("sched_getattr"); exit(-1); } printf("main thread pid=%ld\n", gettid()); printf("main thread policy=%ld\n", attr.sched_policy); printf("main thread nice=%ld\n", attr.sched_nice); printf("main thread priority=%ld\n", attr.sched_priority); printf("main thread runtime=%ld\n", attr.sched_runtime); printf("main thread deadline=%ld\n", attr.sched_deadline); printf("main thread period=%ld\n", attr.sched_period); return 0; }Compile the
sched_timeslice.cfile.$ gcc sched_timeslice.c -o sched_timesliceCheck the output of the
sched_timesliceprogram.$ ./sched_timeslice main thread pid=321716 main thread policy=6 main thread nice=0 main thread priority=0 main thread runtime=1000000 main thread deadline=9000000 main thread period=10000000
31.7. The sched_attr structure
The sched_attr structure contains or defines a scheduling policy and its associated attributes for a specified thread. The sched_attr structure has the following form:
    struct sched_attr {
     u32 size;
     u32 sched_policy
     u64 sched_flags
     s32 sched_nice
     u32 sched_priority

     /* SCHED_DEADLINE fields */
               u64 sched_runtime
               u64 sched_deadline
               u64 sched_period
           };
sched_attr data structure
- size
The thread size in bytes. If the size of the structure is smaller than the kernel structure, additional fields are then assumed to be
0. If the size is larger than the kernel structure, the kernel verifies all additional fields as0.NoteThe
sched_setattr()function fails withE2BIGerror whensched_attrstructure is larger than the kernel structure and updates size to contain the size of the kernel structure.- sched_policy
- The scheduling policy
- sched_flags
Helps control scheduling behavior when a process forks using the
fork()function. The calling process is referred to as the parent process, and the new process is referred to as the child process. Valid values:-
0: The child process inherits the scheduling policy from the parent process. -
SCHED_FLAG_RESET_ON_FORK: fork(): The child process does not inherit the scheduling policy from the parent process. Instead, it is set to the default scheduling policy(struct sched_attr){ .sched_policy = SCHED_OTHER, }.
-
- sched_nice
-
Specifies the
nicevalue to be set when usingSCHED_OTHERorSCHED_BATCHscheduling policies. Thenicevalue is a number in a range from-20(high priority) to+19(low priority). - sched_priority
-
Specifies the static priority to be set when scheduling
SCHED_FIFOorSCHED_RR. For other policies, specify priority as0.
SCHED_DEADLINE fields must be specified only for deadline scheduling:
-
sched_runtime: Specifies the
runtimeparameter for deadline scheduling. The value is expressed in nanoseconds. -
sched_deadline: Specifies the
deadlineparameter for deadline scheduling. The value is expressed in nanoseconds. -
sched_period: Specifies the
periodparameter for deadline scheduling. The value is expressed in nanoseconds.
Chapter 32. Viewing preemption states
Processes using a CPU can give up the CPU they are using, either voluntarily or involuntarily.
32.1. Preemption
A process can voluntarily yield the CPU either because it has completed, or because it is waiting for an event, such as data from a disk, a key press, or for a network packet.
A process can also involuntarily yield the CPU. This is called preemption and occurs when a higher priority process wants to use the CPU.
Preemption can have a particularly negative impact on system performance, and constant preemption can lead to a state known as thrashing. This problem occurs when processes are constantly preempted, and no process ever runs to completion.
Changing the priority of a task can help reduce involuntary preemption.
32.2. Checking the preemption state of a process
You can check the voluntary and involuntary preemption status for a specified process. The statuses are stored in /proc/PID/status.
Prerequisites
- You have administrator privileges.
Procedure
Display the contents of
/proc/PID/status, wherePIDis the ID of the process. The following displays the preemption statuses for the process with PID 1000.# grep voluntary /proc/1000/status voluntary_ctxt_switches: 194529 nonvoluntary_ctxt_switches: 195338
Chapter 33. Setting the priority for a process with the chrt utility
You can set the priority for a process using the chrt utility.
Prerequisites
- You have administrator privileges.
33.1. Setting the process priority using the chrt utility
The chrt utility checks and adjusts scheduler policies and priorities. It can start new processes with the desired properties, or change the properties of a running process.
Procedure
To set the scheduling policy of a process, run the
chrtcommand with the appropriate command options and parameters. In the following example, the process ID affected by the command is1000, and the priority (-p) is50.# chrt -f -p 50 1000To start an application with a specified scheduling policy and priority, add the name of the application, and the path to it, if necessary, along with the attributes.
# chrt -r -p 50 /bin/my-appFor more information about the
chrtutility options, see The chrt utility options.
33.2. The chrt utility options
The chrt utility options include command options and parameters specifying the process and priority for the command.
Policy options
- -f
-
Sets the scheduler policy to
SCHED_FIFO. - -o
-
Sets the scheduler policy to
SCHED_OTHER. - -r
-
Sets the scheduler policy to
SCHED_RR(round robin). - -d
-
Sets the scheduler policy to
SCHED_DEADLINE. - -p n
Sets the priority of the process to n.
When setting a process to SCHED_DEADLINE, you must specify the
runtime,deadline, andperiodparameters.For example:
# chrt -d --sched-runtime 5000000 --sched-deadline 10000000 --sched-period 16666666 0 video_processing_toolwhere
-
--sched-runtime 5000000is the run time in nanoseconds. -
--sched-deadline 10000000is the relative deadline in nanoseconds. -
--sched-period 16666666is the period in nanoseconds. -
0is a placeholder for unused priority required by thechrtcommand.
-
33.3. Additional resources
-
chrt(1)man page
Chapter 34. Setting the priority for a process with library calls
You can set the priority for a process using the chrt utility.
Prerequisites
- You have administrator privileges.
34.1. Library calls for setting priority
Real-time processes use a different set of library calls to control policy and priority. The following library calls are used to set the priority of non-real-time processes.
-
nice -
setpriority
These functions adjust the nice value of a non-real-time process. The nice value serves as a suggestion to the scheduler on how to order the list of ready-to-run, non-real-time processes to be run on a processor. The processes at the head of the list run before the ones further down the list.
The functions require the inclusion of the sched.h header file. Ensure you always check the return codes from functions.
34.2. Setting the process priority using a library call
The scheduler policy and other parameters can be set using the sched_setscheduler() function. Currently, real-time policies have one parameter, sched_priority. This parameter is used to adjust the priority of the process.
The sched_setscheduler() function requires three parameters, in the form: sched_setscheduler(pid_t pid, int policy, const struct sched_param *sp);.
The sched_setscheduler(2) man page lists all possible return values of sched_setscheduler(), including the error codes.
If the process ID is zero, the sched_setscheduler() function acts on the calling process.
The following code excerpt sets the scheduler policy of the current process to the SCHED_FIFO scheduler policy and the priority to 50:
struct sched_param sp = { .sched_priority = 50 };
int ret;

ret = sched_setscheduler(0, SCHED_FIFO, &sp);
if (ret == -1) {
  perror("sched_setscheduler");
  return 1;
}
34.3. Setting the process priority parameter using a library call
The sched_setparam() function is used to set the scheduling parameters of a particular process. This can then be verified using the sched_getparam() function.
Unlike the sched_getscheduler() function, which only returns the scheduling policy, the sched_getparam() function returns all scheduling parameters for the given process.
Procedure
Use the following code excerpt that reads the priority of a given real-time process and increments it by two:
struct sched_param sp;
int ret;

ret = sched_getparam(0, &sp);
sp.sched_priority += 2;
ret = sched_setparam(0, &sp);
If this code were used in a real application, it would need to check the return values from the function and handle any errors appropriately.
Be careful with incrementing priorities. Continually adding two to the scheduler priority, as in this example, might eventually lead to an invalid priority.
34.4. Setting the scheduling policy and associated attributes for a process
The sched_setattr() function sets the scheduling policy and its associated attributes for an instance ID specified in PID. When pid=0, sched_setattr() acts on the process and attributes of the calling thread.
Procedure
-
Call
sched_setattr()specifying the process ID on which the call acts and one of the following real-time scheduling policies:
Real-time scheduling policies
SCHED_FIFO- Schedules a first-in and first-out policy.
SCHED_RR- Schedules a round-robin policy.
SCHED_DEADLINE- Schedules a deadline scheduling policy.
Linux also supports the following non-real-time scheduling policies:
Non-real-time scheduling policies
SCHED_OTHER- Schedules the standard round-robin time-sharing policy.
SCHED_BATCH- Schedules a “batch" style execution of processes.
SCHED_IDLESchedules very low priority background jobs.
SCHED_IDLEcan be used only at static priority0, and the nice value has no influence for this policy.This policy is intended for running jobs at extremely low priority (lower than a +19 nice value using
SCHED_OTHERorSCHED_BATCHpolicies).
34.5. Additional resources
Chapter 35. Scheduling problems on the real-time kernel and solutions
Scheduling in the real-time kernel might have consequences sometimes. By using the information provided, you can understand the problems on scheduling policies, scheduler throttling, and thread starvation states on the real-time kernel, as well as potential solutions.
35.1. Scheduling policies for the real-time kernel
The real-time scheduling policies share one main characteristic: they run until a higher priority thread interrupts the thread or the threads wait, either by sleeping or performing I/O.
In the case of SCHED_RR, the operating system interrupts a running thread so that another thread of equal SCHED_RR priority can run. In either of these cases, no provision is made by the POSIX specifications that define the policies for allowing lower priority threads to get any CPU time. This characteristic of real-time threads means that it is easy to write an application, which monopolizes 100% of a given CPU. However, this causes problems for the operating system. For example, the operating system is responsible for managing both system-wide and per-CPU resources and must periodically examine data structures describing these resources and perform housekeeping activities with them. But if a core is monopolized by a SCHED_FIFO thread, it cannot perform its housekeeping tasks. Eventually the entire system becomes unstable and can potentially crash.
On the RHEL for Real Time kernel, interrupt handlers run as threads with a SCHED_FIFO priority. The default priority is 50. A cpu-hog thread with a SCHED_FIFO or SCHED_RR policy higher than the interrupt handler threads can prevent interrupt handlers from running. This causes the programs waiting for data signaled by those interrupts to starve and fail.
35.2. Scheduler throttling in the real-time kernel
The real-time kernel includes a safeguard mechanism to enable allocating bandwidth for use by the real-time tasks. The safeguard mechanism is known as real-time scheduler throttling.
The default values for the real-time throttling mechanism define that the real-time tasks can use 95% of the CPU time. The remaining 5% will be devoted to non real-time tasks, such as tasks running under SCHED_OTHER and similar scheduling policies. It is important to note that if a single real-time task occupies the 95% CPU time slot, the remaining real-time tasks on that CPU will not run. Only the non real-time tasks use the remaining 5% of CPU time. The default values can have the following performance impacts:
- The real-time tasks have at most 95% of CPU time available for them, which can affect their performance.
- The real-time tasks do not lock up the system by not allowing non real-time tasks to run.
The real-time scheduler throttling is controlled by the following parameters in the /proc file system:
- The
/proc/sys/kernel/sched_rt_period_usparameter -
Defines the period in
μs(microseconds), which is 100% of the CPU bandwidth. The default value is 1,000,000 μs, which is 1 second. Changes to the period’s value must be carefully considered because a period value that is either very high or low can cause problems. - The
/proc/sys/kernel/sched_rt_runtime_usparameter -
Defines the total bandwidth available for all real-time tasks. The default value is 950,000 μs (0.95 s), which is 95% of the CPU bandwidth. Setting the value to
-1configures the real-time tasks to use up to 100% of CPU time. This is only adequate when the real-time tasks are well engineered and have no obvious caveats, such as unbounded polling loops.
35.3. Thread starvation in the real-time kernel
Thread starvation occurs when a thread is on a CPU run queue for longer than the starvation threshold and does not make progress. A common cause of thread starvation is to run a fixed-priority polling application, such as SCHED_FIFO or SCHED_RR bound to a CPU. Since the polling application does not block for I/O, this can prevent other threads, such as kworkers, from running on that CPU.
An early attempt to reduce thread starvation is called as real-time throttling. In real-time throttling, each CPU has a portion of the execution time dedicated to non real-time tasks. The default setting for throttling is on with 95% of the CPU for real-time tasks and 5% reserved for non real-time tasks. This works if you have a single real-time task causing starvation but does not work if there are multiple real-time tasks assigned to a CPU. You can work around the problem by using:
- The
stalldmechanism The
stalldmechanism is an alternative for real-time throttling and avoids some of the throttling drawbacks.stalldis a daemon to periodically monitor the state of each thread in the system and looks for threads that are on the run queue for a specified length of time without being run.stalldtemporarily changes that thread to use theSCHED_DEADLINEpolicy and allocates the thread a small slice of time on the specified CPU. The thread then runs, and when the time slice is used, the thread returns to its original scheduling policy andstalldcontinues to monitor thread states.Housekeeping CPUs are CPUs that run all daemons, shell processes, kernel threads, interrupt handlers, and all work that can be dispatched from an isolated CPU. For housekeeping CPUs with real-time throttling disabled,
stalldmonitors the CPU that runs the main workload and assigns the CPU with theSCHED_FIFObusy loop, which helps to detect stalled threads and improve the thread priority as required with a previously defined acceptable added noise.stalldcan be a preference if the real-time throttling mechanism causes an unreasonable noise in the main workload.With
stalld, you can more precisely control the noise introduced by boosting starved threads. The shell script/usr/bin/throttlectlautomatically disables real-time throttling whenstalldis run. You can list the current throttling values by using the/usr/bin/throttlectl showscript.- Disabling real-time throttling
The following parameters in the
/procfilesystem control real-time throttling:-
The
/proc/sys/kernel/sched_rt_period_usparameter specifies the number of microseconds in a period and defaults to 1 million, which is 1 second. -
The
/proc/sys/kernel/sched_rt_runtime_usparameter specifies the number of microseconds that can be used by a real-time task before throttling occurs and it defaults to 950,000 or 95% of the available CPU cycles. You can disable throttling by passing a value of-1into thesched_rt_runtime_usfile by using theecho -1 > /proc/sys/kernel/sched_rt_runtime_uscommand.
-
The