
Chapter 4. Optimizing the system performance using the web console
Learn how to set a performance profile in the RHEL web console to optimize the performance of the system for a selected task.
4.1. Performance tuning options in the web console
Red Hat Enterprise Linux 9 provides several performance profiles that optimize the system for the following tasks:
- Systems using the desktop
- Throughput performance
- Latency performance
- Network performance
- Low power consumption
- Virtual machines
The TuneD service optimizes system options to match the selected profile.
In the web console, you can set which performance profile your system uses.
Additional resources
4.2. Setting a performance profile in the web console
Depending on the task you want to perform, you can use the web console to optimize system performance by setting a suitable performance profile.
Prerequisites
- Make sure the web console is installed and accessible. For details, see Installing the web console.
Procedure
- Log into the 9 web console. For details, see Logging in to the web console.
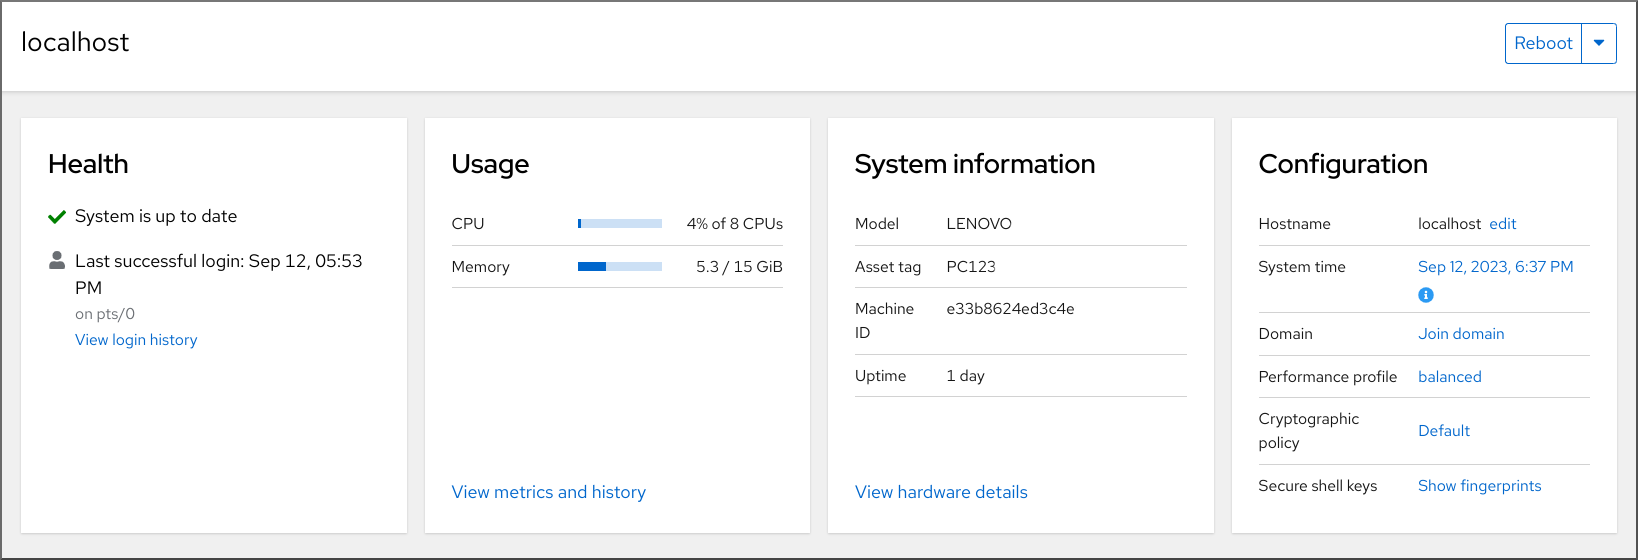
- Click Overview.
In the Configuration section, click the current performance profile.
In the Change Performance Profile dialog box, set the required profile.
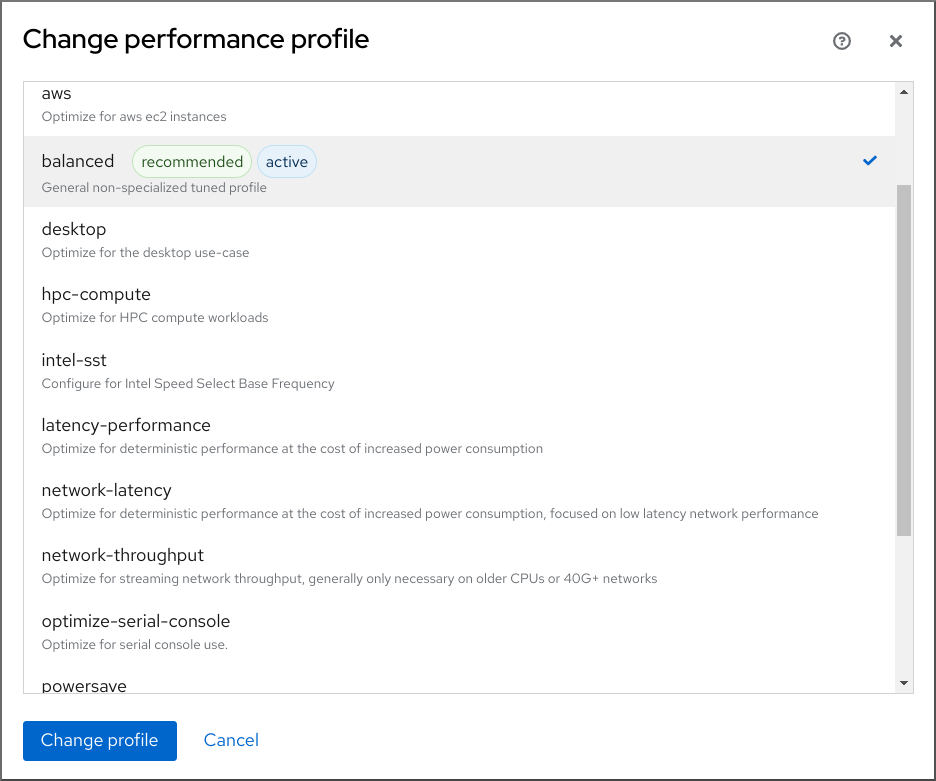
- Click .
Verification steps
- The Overview tab now shows the selected performance profile in the Configuration section.
4.3. Monitoring performance on the local system using the web console
Red Hat Enterprise Linux web console uses the Utilization Saturation and Errors (USE) Method for troubleshooting. The new performance metrics page has a historical view of your data organized chronologically with the newest data at the top.
In the Metrics and history page, you can view events, errors, and graphical representation for resource utilization and saturation.
Prerequisites
- The web console is installed and accessible. For details, see Installing the web console.
The
cockpit-pcppackage, which enables collecting the performance metrics, is installed:To install the package from the web console interface:
- Log in to the web console with administrative privileges. For details, see Logging in to the web console.
- In the Overview page, click View metrics and history.
- Click the button.
- In the Install software dialog window, click Install.
To install the package from the command-line interface, use:
# dnf install cockpit-pcp
The Performance Co-Pilot (PCP) service is enabled:
# systemctl enable --now pmlogger.service pmproxy.service
Procedure
- Log into the 9 web console. For details, see Logging in to the web console.
- Click Overview.
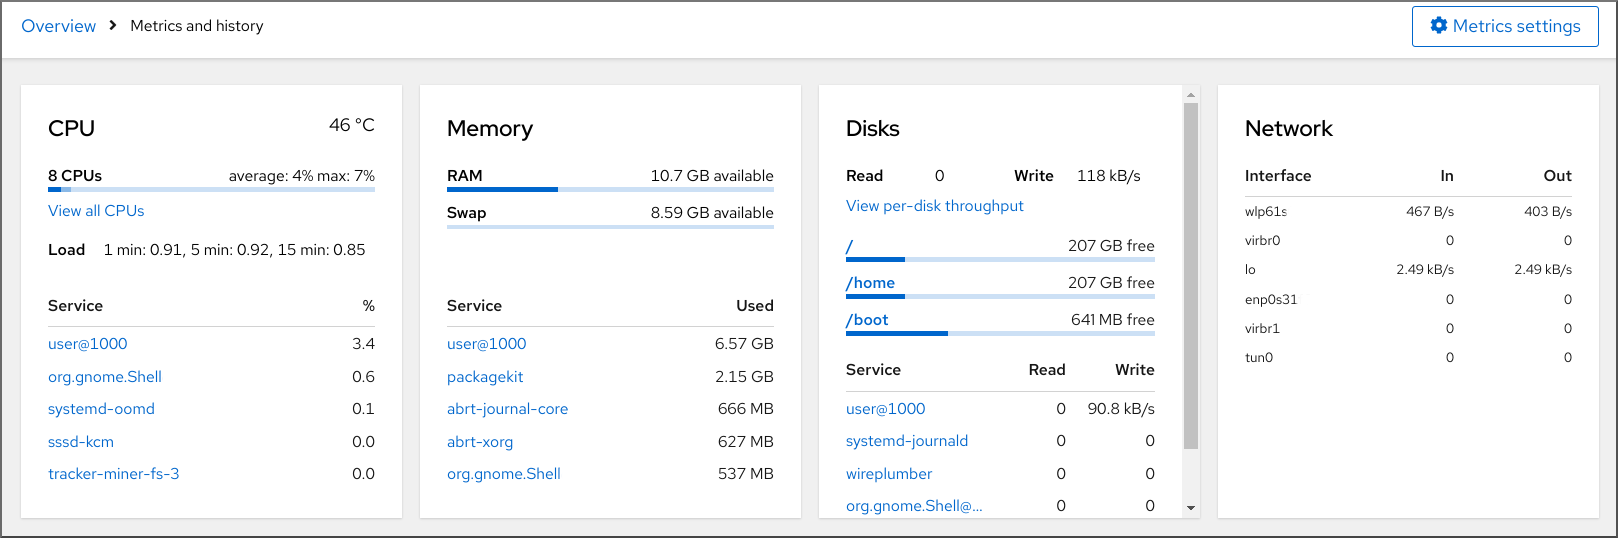
In the Usage section, click View metrics and history.
The Metrics and history section opens:
-
The current system configuration and usage:
-
The performance metrics in a graphical form over a user-specified time interval:
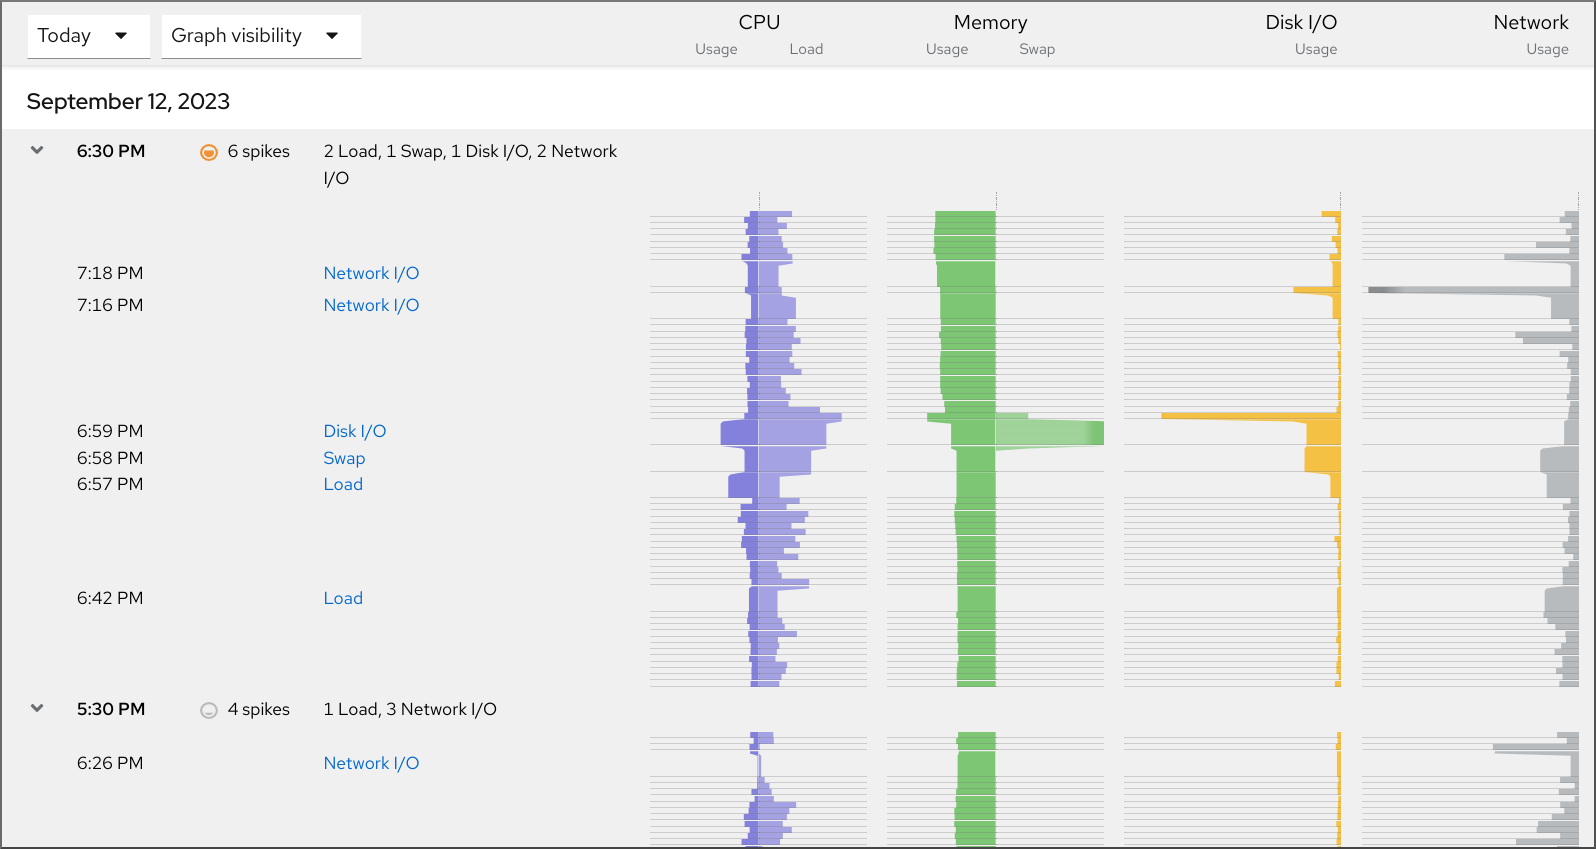
-
The current system configuration and usage:
4.4. Monitoring performance on several systems using the web console and Grafana
Grafana enables you to collect data from several systems at once and review a graphical representation of their collected Performance Co-Pilot (PCP) metrics. You can set up performance metrics monitoring and export for several systems in the web console interface.
Prerequisites
- The web console must be installed and accessible. For details, see link:Installing the web console.
Install the
cockpit-pcppackage.From the web console interface:
- Log in to the web console with administrative privileges. For details, see Logging in to the web console.
- In the Overview page, click View details and history.
- Click the button.
- In the Install software dialog window, click Install.
- Log out and in again to see the metrics history.
To install the package from the command-line interface, use:
# dnf install cockpit-pcp
Enable the PCP service:
# systemctl enable --now pmlogger.service pmproxy.service- Set up Grafana dashboard. For more information, see Setting up a grafana-server.
Install the
redispackage.# dnf install redisAlternatively, you can install the package from the web console interface later in the procedure.
Procedure
- In the Overview page, click View metrics and history in the Usage table.
- Click the button.
Move the Export to network slider to active position.
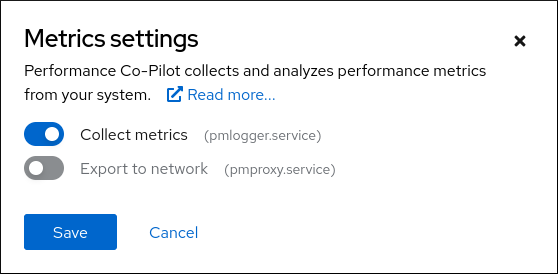
If you do not have the
redispackage installed, the web console prompts you to install it.-
To open the
pmproxyservice, select a zone from a drop-down list and click the button. - Click Save.
Verification
- Click Networking.
- In the Firewall table, click the button.
-
Search for
pmproxyin your selected zone.
Repeat this procedure on all the systems you want to watch.
Additional resources