
Red Hat Training
A Red Hat training course is available for RHEL 8
Chapter 34. Tuning the network performance
Tuning the network settings is a complex process with many factors to consider. For example, this includes the CPU-to-memory architecture, the amount of CPU cores, and more. Red Hat Enterprise Linux uses default settings that are optimized for most scenarios. However, in certain cases, it can be necessary to tune network settings to increase the throughput or latency or to solve problems, such as packet drops.
34.1. Tuning network adapter settings
In high-speed networks with 40 Gbps and faster, certain default values of network adapter-related kernel settings can be a cause of packet drops and performance degradation. Tuning these settings can prevent such problems.
34.1.1. Increasing the ring buffer size to reduce a high packet drop rate by using nmcli
Increase the size of an Ethernet device’s ring buffers if the packet drop rate causes applications to report a loss of data, timeouts, or other issues.
Receive ring buffers are shared between the device driver and network interface controller (NIC). The card assigns a transmit (TX) and receive (RX) ring buffer. As the name implies, the ring buffer is a circular buffer where an overflow overwrites existing data. There are two ways to move data from the NIC to the kernel, hardware interrupts and software interrupts, also called SoftIRQs.
The kernel uses the RX ring buffer to store incoming packets until the device driver can process them. The device driver drains the RX ring, typically by using SoftIRQs, which puts the incoming packets into a kernel data structure called an sk_buff or skb to begin its journey through the kernel and up to the application that owns the relevant socket.
The kernel uses the TX ring buffer to hold outgoing packets which should be sent to the network. These ring buffers reside at the bottom of the stack and are a crucial point at which packet drop can occur, which in turn will adversely affect network performance.
Procedure
Display the packet drop statistics of the interface:
# ethtool -S enp1s0
    ...
    rx_queue_0_drops: 97326
    rx_queue_1_drops: 63783
    ...
Note that the output of the command depends on the network card and the driver.
High values in
discardordropcounters indicate that the available buffer fills up faster than the kernel can process the packets. Increasing the ring buffers can help to avoid such loss.Display the maximum ring buffer sizes:
# ethtool -g enp1s0
 Ring parameters for enp1s0:
 Pre-set maximums:
 RX:             4096
 RX Mini:        0
 RX Jumbo:       16320
 TX:             4096
 Current hardware settings:
 RX:             255
 RX Mini:        0
 RX Jumbo:       0
 TX:             255
If the values in the
Pre-set maximumssection are higher than in theCurrent hardware settingssection, you can change the settings in the next steps.Identify the NetworkManager connection profile that uses the interface:
# nmcli connection show
NAME                UUID                                  TYPE      DEVICE
Example-Connection  a5eb6490-cc20-3668-81f8-0314a27f3f75  ethernet  enp1s0
Update the connection profile, and increase the ring buffers:
To increase the RX ring buffer, enter:
# nmcli connection modify Example-Connection ethtool.ring-rx 4096To increase the TX ring buffer, enter:
# nmcli connection modify Example-Connection ethtool.ring-tx 4096
Reload the NetworkManager connection:
# nmcli connection up Example-ConnectionImportantDepending on the driver your NIC uses, changing in the ring buffer can shortly interrupt the network connection.
Additional resources
34.1.2. Tuning the network device backlog queue to avoid packet drops
When a network card receives packets and before the kernel protocol stack processes them, the kernel stores these packets in backlog queues. The kernel maintains a separate queue for each CPU core.
If the backlog queue for a core is full, the kernel drops all further incoming packets that the netif_receive_skb() kernel function assigns to this queue. If the server contains a 10 Gbps or faster network adapter or multiple 1 Gbps adapters, tune the backlog queue size to avoid this problem.
Prerequisites
- A 10 Gbps or faster or multiple 1 Gbps network adapters
Procedure
Determine whether tuning the backlog queue is needed, display the counters in the
/proc/net/softnet_statfile:# awk '{for (i=1; i<=NF; i++) printf strtonum("0x" $i) (i==NF?"\n":" ")}' /proc/net/softnet_stat | column -t 221951548 0 0 0 0 0 0 0 0 0 0 0 0 192058677 18862 0 0 0 0 0 0 0 0 0 0 1 455324886 0 0 0 0 0 0 0 0 0 0 0 2 ...This
awkcommand converts the values in/proc/net/softnet_statfrom hexadecimal to decimal format and displays them in table format. Each line represents a CPU core starting with core 0.The relevant columns are:
- First column: The total number of received frames
- Second column: The number of dropped frames because of a full backlog queue
- Last column: The CPU core number
If the values in the second column of the
/proc/net/softnet_statfile increment over time, increase the size of the backlog queue:Display the current backlog queue size:
# sysctl net.core.netdev_max_backlog
net.core.netdev_max_backlog = 1000
Create the
/etc/sysctl.d/10-netdev_max_backlog.conffile with the following content:net.core.netdev_max_backlog = 2000Set the
net.core.netdev_max_backlogparameter to a double of the current value.Load the settings from the
/etc/sysctl.d/10-netdev_max_backlog.conffile:# sysctl -p /etc/sysctl.d/10-netdev_max_backlog.conf
Verification
Monitor the second column in the
/proc/net/softnet_statfile:# awk '{for (i=1; i<=NF; i++) printf strtonum("0x" $i) (i==NF?"\n":" ")}' /proc/net/softnet_stat | column -tIf the values still increase, double the
net.core.netdev_max_backlogvalue again. Repeat this process until the packet drop counters no longer increase.
34.1.3. Increasing the transmit queue length of a NIC to reduce the number of transmit errors
The kernel stores packets in a transmit queue before transmitting them. The default length (1000 packets) is typically sufficient for 10 Gbps, and often also for 40 Gbps networks. However, in faster networks, or if you encounter an increasing number of transmit errors on an adapter, increase the queue length.
Procedure
Display the current transmit queue length:
# ip -s link show enp1s0
2: enp1s0: <BROADCAST,MULTICAST,UP,LOWER_UP> mtu 1500 qdisc fq_codel state UP mode DEFAULT group default qlen 1000
...
In this example, the transmit queue length (
qlen) of theenp1s0interface is1000.Monitor the dropped packets counter of a network interface’s software transmit queue:
# tc -s qdisc show dev enp1s0
qdisc fq_codel 0: root refcnt 2 limit 10240p flows 1024 quantum 1514 target 5ms interval 100ms memory_limit 32Mb ecn drop_batch 64
 Sent 16889923 bytes 426862765 pkt (dropped 191980, overlimits 0 requeues 2)
...
If you encounter a high or increasing transmit error count, set a higher transmit queue length:
Identify the NetworkManager connection profile that uses this interface:
# nmcli connection show
NAME                UUID                                  TYPE      DEVICE
Example-Connection  a5eb6490-cc20-3668-81f8-0314a27f3f75  ethernet  enp1s0
Create the
/etc/NetworkManager/dispatcher.d/99-set-tx-queue-length-upNetworkManager dispatcher script with the following content:#!/bin/bash # Set TX queue length on enp1s0 to 2000 if [ "$1" == "enp1s0" ] && [ "$2" == "up" ] ; then ip link set dev enp1s0 txqueuelen 2000 fiSet the executable bit on the
/etc/NetworkManager/dispatcher.d/99-set-tx-queue-length-upfile:# chmod +x /etc/NetworkManager/dispatcher.d/99-set-tx-queue-length-upApply the changes:
# nmcli connection up Example-Connection
Verification
Display the transmit queue length:
# ip -s link show enp1s0
2: enp1s0: <BROADCAST,MULTICAST,UP,LOWER_UP> mtu 1500 qdisc fq_codel state UP mode DEFAULT group default qlen 2000
...
Monitor the dropped packets counter:
# tc -s qdisc show dev enp1s0If the
droppedcounter still increases, double the transmit queue length again. Repeat this process until the counter no longer increases.
34.2. Tuning IRQ balancing
On multi-core hosts, you can increase the performance by ensuring that Red Hat Enterprise Linux balances interrupt queues (IRQs) to distribute the interrupts across CPU cores.
34.2.1. Interrupts and interrupt handlers
When a network interface controller (NIC) receives incoming data, it copies the data into kernel buffers by using Direct Memory Access (DMA). The NIC then notifies the kernel about this data by triggering a hard interrupt. These interrupts are processed by interrupt handlers which do minimal work, as they have already interrupted another task and the handlers cannot interrupt themselves. Hard interrupts can be costly in terms of CPU usage, especially if they use kernel locks.
The hard interrupt handler then leaves the majority of packet reception to a software interrupt request (SoftIRQ) process. The kernel can schedule these processes more fairly.
Example 34.1. Displaying hardware interrupts
The kernel stores the interrupt counters in the /proc/interrupts file. To display the counters for a specific NIC, such as enp1s0, enter:
# egrep "CPU|enp1s0" /proc/interrupts
         CPU0     CPU1     CPU2    CPU3    CPU4   CPU5
 105:  141606        0        0       0       0      0  IR-PCI-MSI-edge      enp1s0-rx-0
 106:       0   141091        0       0       0      0  IR-PCI-MSI-edge      enp1s0-rx-1
 107:       2        0   163785       0       0      0  IR-PCI-MSI-edge      enp1s0-rx-2
 108:       3        0        0  194370       0      0  IR-PCI-MSI-edge      enp1s0-rx-3
 109:       0        0        0       0       0      0  IR-PCI-MSI-edge      enp1s0-tx
Each queue has an interrupt vector in the first column assigned to it. The kernel initializes these vectors when the system boots or when a user loads the NIC driver module. Each receive (RX) and transmit (TX) queue is assigned a unique vector that informs the interrupt handler which NIC or queue the interrupt is coming from. The columns represent the number of incoming interrupts for every CPU core.
34.2.2. Software interrupt requests
Software interrupt requests (SoftIRQs) clear the receive ring buffers of network adapters. The kernel schedules SoftIRQ routines to run at a time when other tasks will not be interrupted. On Red Hat Enterprise Linux, processes named ksoftirqd/cpu-number run these routines and call driver-specific code functions.
To monitor the SoftIRQ counters for each CPU core, enter:
# watch -n1 'egrep "CPU|NET_RX|NET_TX" /proc/softirqs'
                    CPU0       CPU1	  CPU2       CPU3	CPU4	   CPU5       CPU6	 CPU7
      NET_TX:	   49672      52610	 28175      97288      12633	  19843      18746     220689
      NET_RX:         96       1615        789         46         31	   1735       1315     470798
The command dynamically updates the output. Press Ctrl+C to interrupt the output.
34.2.3. NAPI Polling
New API (NAPI) is an extension to the device driver packet processing framework to improve the efficiency of incoming network packets. Hard interrupts are expensive because they usually cause a context switch from the kernel space to the user space and back again, and cannot interrupt themselves. Even with interrupt coalescence, the interrupt handler monopolizes a CPU core completely. With NAPI, the driver can use a polling mode instead of being hard-interrupted by the kernel for every packet that is received.
Under normal operation, the kernel issues an initial hard interrupt, followed by a soft interrupt request (SoftIRQ) handler that polls the network card using NAPI routines. To prevent SoftIRQs from monopolizing a CPU core, the polling routine has a budget that determines the CPU time the SoftIRQ can consume. On completion of the SoftIRQ poll routine, the kernel exits the routine and schedules it to run again at a later time to repeat the process of receiving packets from the network card.
34.2.4. The irqbalance service
On systems both with and without Non-Uniform Memory Access (NUMA) architecture, the irqbalance service balances interrupts effectively across CPU cores, based on system conditions. The irqbalance service runs in the background and monitors the CPU load every 10 seconds. The service moves interrupts to other CPU cores when a CPU’s load is too high. As a result, the system performs well and handles load more efficiently.
If irqbalance is not running, usually the CPU core 0 handles most of the interrupts. Even at moderate load, this CPU core can become busy trying to handle the workload of all the hardware in the system. As a consequence, interrupts or interrupt-based work can be missed or delayed. This can result in low network and storage performance, packet loss, and potentially other issues.
Disabling irqbalance can negatively impact the network throughput.
On systems with only a single CPU core, the irqbalance service provides no benefit and exits on its own.
By default, the irqbalance service is enabled and running on Red Hat Enterprise Linux. To re-enable the service if you disabled it, enter:
# systemctl enable --now irqbalanceAdditional resources
- Do we need irqbalance? solution
- How should I configure network interface IRQ channels? solution
34.2.5. Increasing the time SoftIRQs can run on the CPU
If SoftIRQs do not run long enough, the rate of incoming data could exceed the kernel’s capability to drain the buffer fast enough. As a result, the network interface controller (NIC) buffers overflow and packets are lost.
If softirqd processes could not retrieve all packets from interfaces in one NAPI polling cycle, it is an indicator that the SoftIRQs do not have enough CPU time. This could be the case on hosts with fast NICs, such as 10 Gbps and faster. If you increase the values of the net.core.netdev_budget and net.core.netdev_budget_usecs kernel parameters, you can control the time and number of packets softirqd can process in a polling cycle.
Procedure
To determine whether tuning the
net.core.netdev_budgetparameter is needed, display the counters in the/proc/net/softnet_statfile:# awk '{for (i=1; i<=NF; i++) printf strtonum("0x" $i) (i==NF?"\n":" ")}' /proc/net/softnet_stat | column -t 221951548 0 0 0 0 0 0 0 0 0 0 0 0 192058677 0 20380 0 0 0 0 0 0 0 0 0 1 455324886 0 0 0 0 0 0 0 0 0 0 0 2 ...This
awkcommand converts the values in/proc/net/softnet_statfrom hexadecimal to decimal format and displays them in the table format. Each line represents a CPU core starting with core 0.The relevant columns are:
- First column: The total number of received frames.
-
Third column: The number times
softirqdprocesses that could not retrieve all packets from interfaces in one NAPI polling cycle. - Last column: The CPU core number.
If the counters in the third column of the
/proc/net/softnet_statfile increment over time, tune the system:Display the current values of the
net.core.netdev_budget_usecsandnet.core.netdev_budgetparameters:# sysctl net.core.netdev_budget_usecs net.core.netdev_budget net.core.netdev_budget_usecs = 2000 net.core.netdev_budget = 300With these settings,
softirqdprocesses have up to 2000 microseconds to process up to 300 messages from the NIC in one polling cycle. Polling ends based on which condition is met first.Create the
/etc/sysctl.d/10-netdev_budget.conffile with the following content:net.core.netdev_budget = 600 net.core.netdev_budget_usecs = 4000
Set the parameters to a double of their current values.
Load the settings from the
/etc/sysctl.d/10-netdev_budget.conffile:# sysctl -p /etc/sysctl.d/10-netdev_budget.conf
Verification
Monitor the third column in the
/proc/net/softnet_statfile:# awk '{for (i=1; i<=NF; i++) printf strtonum("0x" $i) (i==NF?"\n":" ")}' /proc/net/softnet_stat | column -tIf the values still increase, set
net.core.netdev_budget_usecsandnet.core.netdev_budgetto higher values. Repeat this process until the counters no longer increase.
34.3. Improving the network latency
CPU power management features can cause unwanted delays in time-sensitive application processing. You can disable some or all of these power management features to improve the network latency.
For example, if the latency is higher when the server is idle than under heavy load, CPU power management settings could influence the latency.
Disabling CPU power management features can cause a higher power consumption and heat loss.
34.3.1. How the CPU power states influence the network latency
The consumption state (C-states) of CPUs optimize and reduce the power consumption of computers. The C-states are numbered, starting at C0. In C0, the processor is fully powered and executing. In C1, the processor is fully powered but not executing. The higher the number of the C-state, the more components the CPU turns off.
Whenever a CPU core is idle, the built-in power saving logic steps in and attempts to move the core from the current C-state to a higher one by turning off various processor components. If the CPU core must process data, Red Hat Enterprise Linux (RHEL) sends an interrupt to the processor to wake up the core and set its C-state back to C0.
Moving out of deep C-states back to C0 takes time due to turning power back on to various components of the processor. On multi-core systems, it can also happen that many of the cores are simultaneously idle and, therefore, in deeper C-states. If RHEL tries to wake them up at the same time, the kernel can generate a large number of Inter-Processor Interrupts (IPIs) while all cores return from deep C-states. Due to locking that is required while processing interrupts, the system can then stall for some time while handling all the interrupts. This can result in large delays in the application response to events.
Example 34.2. Displaying times in C-state per core
The Idle Stats page in the PowerTOP application displays how much time the CPU cores spend in each C-state:
           Pkg(HW)  |            Core(HW) |            CPU(OS) 0   CPU(OS) 4
                    |                     | C0 active   2.5%        2.2%
                    |                     | POLL        0.0%    0.0 ms  0.0%    0.1 ms
                    |                     | C1          0.1%    0.2 ms  0.0%    0.1 ms
C2 (pc2)   63.7%    |                     |
C3 (pc3)    0.0%    | C3 (cc3)    0.1%    | C3          0.1%    0.1 ms  0.1%    0.1 ms
C6 (pc6)    0.0%    | C6 (cc6)    8.3%    | C6          5.2%    0.6 ms  6.0%    0.6 ms
C7 (pc7)    0.0%    | C7 (cc7)   76.6%    | C7s         0.0%    0.0 ms  0.0%    0.0 ms
C8 (pc8)    0.0%    |                     | C8          6.3%    0.9 ms  5.8%    0.8 ms
C9 (pc9)    0.0%    |                     | C9          0.4%    3.7 ms  2.2%    2.2 ms
C10 (pc10)  0.0%    |                     |
                    |                     | C10        80.8%    3.7 ms 79.4%    4.4 ms
                    |                     | C1E         0.1%    0.1 ms  0.1%    0.1 ms
...
Additional resources
34.3.2. C-state settings in the EFI firmware
In most systems with an EFI firmware, you can enable and disable the individual consumption states (C-states). However, on Red Hat Enterprise Linux (RHEL), the idle driver determines whether the kernel uses the settings from the firmware:
-
intel_idle: This is the default driver on hosts with an Intel CPU and ignores the C-state settings from the EFI firmware. -
acpi_idle: RHEL uses this driver on hosts with CPUs from vendors other than Intel and ifintel_idleis disabled. By default, theacpi_idledriver uses the C-state settings from the EFI firmware.
Additional resources
-
/usr/share/doc/kernel-doc-<version>/Documentation/admin-guide/pm/cpuidle.rstprovided by thekernel-docpackage
34.3.3. Disabling C-states by using a custom TuneD profile
The TuneD service uses the Power Management Quality of Service (PMQOS) interface of the kernel to set consumption states (C-states) locking. The kernel idle driver can communicate with this interface to dynamically limit the C-states. This prevents that administrators must hard code a maximum C-state value by using kernel command line parameters.
Prerequisites
-
The
tunedpackage is installed. -
The
tunedservice is enabled and running.
Procedure
Display the active profile:
# tuned-adm active
Current active profile: network-latency
Create a directory for the custom TuneD profile:
# mkdir /etc/tuned/network-latency-custom/Create the
/etc/tuned/network-latency-custom/tuned.conffile with the following content:[main] include=network-latency [cpu] force_latency=cstate.id:1|2
This custom profile inherits all settings from the
network-latencyprofile. Theforce_latencyTuneD parameter specifies the latency in microseconds (µs). If the C-state latency is higher than the specified value, the idle driver in Red Hat Enterprise Linux prevents the CPU from moving to a higher C-state. Withforce_latency=cstate.id:1|2, TuneD first checks if the/sys/devices/system/cpu/cpu_<number>_/cpuidle/state_<cstate.id>_/directory exists. In this case, TuneD reads the latency value from thelatencyfile in this directory. If the directory does not exist, TuneD uses 2 microseconds as a fallback value.Activate the
network-latency-customprofile:# tuned-adm profile network-latency-custom
Additional resources
34.3.4. Disabling C-states by using a kernel command line option
The processor.max_cstate and intel_idle.max_cstat kernel command line parameters configure the maximum consumption states (C-state) CPU cores can use. For example, setting the parameters to 1 ensures that the CPU will never request a C-state below C1.
Use this method to test whether the latency of applications on a host are being affected by C-states. To not hard code a specific state, consider using a more dynamic solution. See Disabling C-states by using a custom TuneD profile.
Prerequisites
-
The
tunedservice is not running or configured to not update C-state settings.
Procedure
Display the idle driver the system uses:
# cat /sys/devices/system/cpu/cpuidle/current_driver
intel_idle
If the host uses the
intel_idledriver, set theintel_idle.max_cstatekernel parameter to define the highest C-state that CPU cores should be able to use:# grubby --update-kernel=ALL --args="intel_idle.max_cstate=0"Setting
intel_idle.max_cstate=0disables theintel_idledriver. Consequently, the kernel uses theacpi_idledriver that uses the C-state values set in the EFI firmware. For this reason, also setprocessor.max_cstateto override these C-state settings.On every host, independent from the CPU vendor, set the highest C-state that CPU cores should be able to use:
# grubby --update-kernel=ALL --args="processor.max_cstate=0"ImportantIf you set
processor.max_cstate=0in addition tointel_idle.max_cstate=0, theacpi_idledriver overrides the value ofprocessor.max_cstateand sets it to1. As a result, withprocessor.max_cstate=0 intel_idle.max_cstate=0, the highest C-state the kernel will use is C1, not C0.Restart the host for the changes to take effect:
# reboot
Verification
Display the maximum C-state:
# cat /sys/module/processor/parameters/max_cstate
1
If the host uses the
intel_idledriver, display the maximum C-state:# cat /sys/module/intel_idle/parameters/max_cstate 0
Additional resources
- What are CPU "C-states" and how to disable them if needed?
-
/usr/share/doc/kernel-doc-<version>/Documentation/admin-guide/pm/cpuidle.rstprovided by thekernel-docpackage
34.4. Improving the throughput of large amounts of contiguous data streams
According to the IEEE 802.3 standard, a default Ethernet frame without Virtual Local Area Network (VLAN) tag has a maximum size of 1518 bytes. Each of these frames includes an 18 bytes header, leaving 1500 bytes for payload. Consequently, for every 1500 bytes of data the server transmits over the network, 18 bytes (1.2%) Ethernet frame header are overhead and transmitted as well. Headers from layer 3 and 4 protocols increase the overhead per packet further.
Consider employing jumbo frames to save overhead if hosts on your network often send numerous contiguous data streams, such as backup servers or file servers hosting numerous huge files. Jumbo frames are non-standardized frames that have a larger Maximum Transmission Unit (MTU) than the standard Ethernet payload size of 1500 bytes. For example, if you configure jumbo frames with the maximum allowed MTU of 9000 bytes payload, the overhead of each frame reduces to 0.2%.
Depending on the network and services, it can be beneficial to enable jumbo frames only in specific parts of a network, such as the storage backend of a cluster. This avoids packet fragmentation.
34.4.1. Considerations before configuring jumbo frames
Depending on your hardware, applications, and services in your network, jumbo frames can have different impacts. Decide carefully whether enabling jumbo frames provides a benefit in your scenario.
Prerequisites
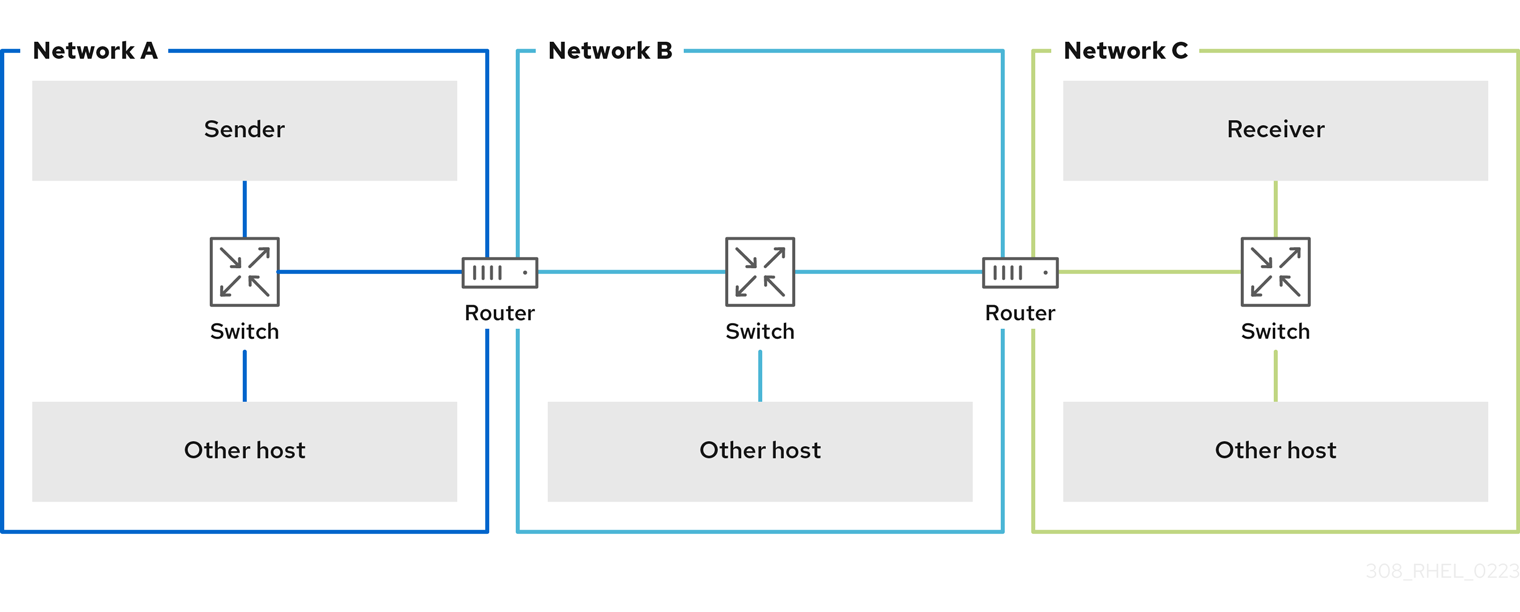
All network devices on the transmission path must support jumbo frames and use the same Maximum Transmission Unit (MTU) size. In the opposite case, you can face the following problems:
- Dropped packets.
- Higher latency due to fragmented packets.
- Increased risk of packet loss caused by fragmentation. For example, if a router fragments a single 9000-bytes frame into six 1500-bytes frames, and any of those 1500-byte frames are lost, the whole frame is lost because it cannot be reassembled.
In the following diagram, all hosts in the three subnets must use the same MTU if a host from network A sends a packet to a host in network C:
Benefits of jumbo frames
- Higher throughput: Each frame contains more user data while the protocol overhead is fixed.
- Lower CPU utilization: Jumbo frames cause fewer interrupts and, therefore, save CPU cycles.
Drawbacks of jumbo frames
- Higher latency: Larger frames delay packets that follow.
- Increased memory buffer usage: Larger frames can fill buffer queue memory more quickly.
34.4.2. Configuring the MTU in an existing NetworkManager connection profile
If your network requires a different Maximum Transmission Unit (MTU) than the default, you can configure this setting in the corresponding NetworkManager connection profile.
Jumbo frames are network packets with a payload of between 1500 and 9000 bytes. All devices in the same broadcast domain have to support those frames.
Prerequisites
- All devices in the broadcast domain use the same MTU.
- You know the MTU of the network.
- You already configured a connection profile for the network with the divergent MTU.
Procedure
Optional: Display the current MTU:
# ip link show
...
3: enp1s0: <BROADCAST,MULTICAST,UP,LOWER_UP> mtu 1500 qdisc fq_codel state UP mode DEFAULT group default qlen 1000
    link/ether 52:54:00:74:79:56 brd ff:ff:ff:ff:ff:ff
...
Optional: Display the NetworkManager connection profiles:
# nmcli connection show
NAME     UUID                                  TYPE      DEVICE
Example  f2f33f29-bb5c-3a07-9069-be72eaec3ecf  ethernet  enp1s0
...
Set the MTU in the profile that manages the connection to the network with the divergent MTU:
# nmcli connection modify Example mtu 9000Reactivate the connection:
# nmcli connection up Example
Verification
Display the MTU setting:
# ip link show
...
3: enp1s0: <BROADCAST,MULTICAST,UP,LOWER_UP> mtu 9000 qdisc fq_codel state UP mode DEFAULT group default qlen 1000
    link/ether 52:54:00:74:79:56 brd ff:ff:ff:ff:ff:ff
...
Verify that no host on the transmission paths fragments the packets:
On the receiver side, display the IP reassembly statistics of the kernel:
# nstat -az IpReasm*
#kernel
IpReasmTimeout 0 0.0
IpReasmReqds 0 0.0
IpReasmOKs 0 0.0
IpReasmFails 0 0.0
If the counters return
0, packets were not reassembled.On the sender side, transmit an ICMP request with the prohibit-fragmentation-bit:
# ping -c1 -Mdo -s 8972 destination_hostIf the command succeeds, the packet was not fragmented.
Calculate the value for the
-spacket size option as follows: MTU size - 8 bytes ICMP header - 20 bytes IPv4 header = packet size
34.5. Tuning TCP connections for high throughput
Tune TCP-related settings on Red Hat Enterprise Linux to increase the throughput, reduce the latency, or prevent problems, such as packet loss.
34.5.1. Testing the TCP throughput using iperf3
The iperf3 utility provides a server and client mode to perform network throughput tests between two hosts.
The throughput of applications depends on many factors, such as the buffer sizes that the application uses. Therefore, the results measured with testing utilities, such as iperf3, can be significantly different from those of applications on a server under production workload.
Prerequisites
-
The
iperf3package is installed on both the client and server. - No other services on either host cause network traffic that substantially affects the test result.
- For 40 Gbps and faster connections, the network card supports Accelerated Receive Flow Steering (ARFS) and the feature is enabled on the interface.
Procedure
Optional: Display the maximum network speed of the network interface controller (NIC) on both the server and client:
# ethtool enp1s0 | grep "Speed"
   Speed: 100000Mb/s
On the server:
Temporarily open the default
iperf3TCP port 5201 in thefirewalldservice:# firewall-cmd --add-port=5201/tcp # firewall-cmd --reload
Start
iperf3in server mode:# iperf3 --serverThe service now is waiting for incoming client connections.
On the client:
Start measuring the throughput:
# iperf3 --time 60 --zerocopy --client 192.0.2.1--time <seconds>: Defines the time in seconds when the client stops the transmission.Set this parameter to a value that you expect to work and increase it in later measurements. If the server sends packets at a faster rate than the devices on the transmit path or the client can process, packets can be dropped.
-
--zerocopy: Enables a zero copy method instead of using thewrite()system call. You require this option only if you want to simulate a zero-copy-capable application or to reach 40 Gbps and more on a single stream. -
--client <server>: Enables the client mode and sets the IP address or name of the server that runs theiperf3server.
Wait until
iperf3completes the test. Both the server and the client display statistics every second and a summary at the end. For example, the following is a summary displayed on a client:[ ID] Interval Transfer Bitrate Retr [ 5] 0.00-60.00 sec 101 GBytes 14.4 Gbits/sec 0 sender [ 5] 0.00-60.04 sec 101 GBytes 14.4 Gbits/sec receiver
In this example, the average bitrate was 14.4 Gbps.
On the server:
-
Press Ctrl+C to stop the
iperf3server. Close the TCP port 5201 in
firewalld:# firewall-cmd --remove-port=5201/tcp # firewall-cmd --reload
-
Press Ctrl+C to stop the
Additional resources
-
iperf3(1)man page
34.5.2. The system-wide TCP socket buffer settings
Socket buffers temporarily store data that the kernel has received or should send:
- The read socket buffer holds packets that the kernel has received but which the application has not read yet.
- The write socket buffer holds packets that an application has written to the buffer but which the kernel has not passed to the IP stack and network driver yet.
If a TCP packet is too large and exceeds the buffer size or packets are sent or received at a too fast rate, the kernel drops any new incoming TCP packet until the data is removed from the buffer. In this case, increasing the socket buffers can prevent packet loss.
Both the net.ipv4.tcp_rmem (read) and net.ipv4.tcp_wmem (write) socket buffer kernel settings contain three values:
net.ipv4.tcp_rmem = 4096  131072  6291456
net.ipv4.tcp_wmem = 4096  16384   4194304
The displayed values are in bytes and Red Hat Enterprise Linux uses them in the following way:
- The first value is the minimum buffer size. New sockets cannot have a smaller size.
- The second value is the default buffer size. If an application sets no buffer size, this is the default value.
-
The third value is the maximum size of automatically tuned buffers. Using the
setsockopt()function with theSO_SNDBUFsocket option in an application disables this maximum buffer size.
Note that the net.ipv4.tcp_rmem and net.ipv4.tcp_wmem parameters set the socket sizes for both the IPv4 and IPv6 protocols.
34.5.3. Increasing the system-wide TCP socket buffers
The system-wide TCP socket buffers temporarily store data that the kernel has received or should send. Both net.ipv4.tcp_rmem (read) and net.ipv4.tcp_wmem (write) socket buffer kernel settings each contain three settings: A minimum, default, and maximum value.
Setting too large buffer sizes wastes memory. Each socket can be set to the size that the application requests, and the kernel doubles this value. For example, if an application requests a 256 KiB socket buffer size and opens 1 million sockets, the system can use up to 512 GB RAM (512 KiB x 1 million) only for the potential socket buffer space.
Additionally, a too large value for the maximum buffer size can increase the latency.
Prerequisites
- You encountered a significant rate of dropped TCP packets.
Procedure
Determine the latency of the connection. For example, ping from the client to server to measure the average Round Trip Time (RTT):
# ping -c 10 server.example.com
...
--- server.example.com ping statistics ---
10 packets transmitted, 10 received, 0% packet loss, time 9014ms
rtt min/avg/max/mdev = 117.208/117.056/119.333/0.616 ms
In this example, the latency is 117 ms.
Use the following formula to calculate the Bandwidth Delay Product (BDP) for the traffic you want to tune:
connection speed in bytes * latency in ms = BDP in bytes
For example, to calculate the BDP for a 10 Gbps connection that has a 117 ms latency:
(10 * 1000 * 1000 * 1000 / 8) * 117 = 10683760 bytes
Create the
/etc/sysctl.d/10-tcp-socket-buffers.conffile and either set the maximum read or write buffer size, or both, based on your requirements:net.ipv4.tcp_rmem = 4096 262144 21367520 net.ipv4.tcp_wmem = 4096 24576 21367520
Specify the values in bytes. Use the following rule of thumb when you try to identify optimized values for your environment:
-
Default buffer size (second value): Increase this value only slightly or set it to
524288(512 KiB) at most. A too high default buffer size can cause buffer collapsing and, consequently, latency spikes. - Maximum buffer size (third value): A value double to triple of the BDP is often sufficient.
-
Default buffer size (second value): Increase this value only slightly or set it to
Load the settings from the
/etc/sysctl.d/10-tcp-socket-buffers.conffile:# sysctl -p /etc/sysctl.d/10-tcp-socket-buffers.confConfigure your applications to use a larger socket buffer size. The third value in the
net.ipv4.tcp_rmemandnet.ipv4.tcp_wmemparameters defines the maximum buffer size that thesetsockopt()function in an application can request.For further details, see the documentation of the programming language of your application. If you are not the developer of the application, contact the developer.
If you have changed the second value in the
net.ipv4.tcp_rmemornet.ipv4.tcp_wmemparameter, restart the applications to use the new TCP buffer sizes.If you have changed only the third value, you do not need to restart the application because auto-tuning applies these settings dynamically.
Verification
- Optional: Test the TCP throughput using iperf3.
Monitor the packet drop statistics using the same method that you used when you encountered the packet drops.
If packet drops still occur but at a lower rate, increase the buffer sizes further.
Additional resources
- What are the implications of changing socket buffer sizes? solution
-
tcp(7)man page -
socket(7)man page
34.5.4. TCP Window Scaling
The TCP Window Scaling feature, which is enabled by default in Red Hat Enterprise Linux, is an extension of the TCP protocol that significantly improves the throughput.
For example, on a 1 Gbps connection with 1.5 ms Round Trip Time (RTT):
- With TCP Window Scaling enabled, approximately 630 Mbps are realistic.
- With TCP Window Scaling disabled, the throughput goes down to 380 Mbps.
One of the features TCP provides is flow control. With flow control, a sender can send as much data as the receiver can receive, but no more. To achieve this, the receiver advertises a window value, which is the amount of data a sender can send.
TCP originally supported window sizes up to 64 KiB, but at high Bandwidth Delay Products (BDP), this value becomes a restriction because the sender cannot send more than 64 KiB at a time. High-speed connections can transfer much more than 64 KiB of data at a given time. For example, a 10 Gbps link with 1 ms of latency between systems can have more than 1 MiB of data in transit at a given time. It would be inefficient if a host sends only 64 KiB, then pauses until the other host receives that 64 KiB.
To remove this bottleneck, the TCP Window Scaling extension allows the TCP window value to be arithmetically shifted left to increase the window size beyond 64 KiB. For example, the largest window value of 65535 shifted 7 places to the left, resulting in a window size of almost 8 MiB. This enables transferring much more data at a given time.
TCP Window Scaling is negotiated during the three-way TCP handshake that opens every TCP connection. Both sender and receiver must support TCP Window Scaling for the feature to work. If either or both participants do not advertise window scaling ability in their handshake, the connection reverts to using the original 16-bit TCP window size.
By default, TCP Window Scaling is enabled in Red Hat Enterprise Linux:
# sysctl net.ipv4.tcp_window_scaling
net.ipv4.tcp_window_scaling = 1
If TCP Window Scaling is disabled (0) on your server, revert the setting in the same way as you set it.
Additional resources
34.5.5. How TCP SACK reduces the packet drop rate
The TCP Selective Acknowledgment (TCP SACK) feature, which is enabled by default in Red Hat Enterprise Linux (RHEL), is an enhancement of the TCP protocol and increases the efficiency of TCP connections.
In TCP transmissions, the receiver sends an ACK packet to the sender for every packet it receives. For example, a client sends the TCP packets 1-10 to the server but the packets number 5 and 6 get lost. Without TCP SACK, the server drops packets 7-10, and the client must retransmit all packets from the point of loss, which is inefficient. With TCP SACK enabled on both hosts, the client must re-transmit only the lost packets 5 and 6.
Disabling TCP SACK decreases the performance and causes a higher packet drop rate on the receiver side in a TCP connection.
By default, TCP SACK is enabled in RHEL. To verify:
# sysctl net.ipv4.tcp_sack
1
If TCP SACK is disabled (0) on your server, revert the setting in the same way as you set it.
34.6. Tuning UDP connections
Before you start tuning Red Hat Enterprise Linux to improve the throughput of UDP traffic, it is important to have the realistic expectations. UDP is a simple protocol. Compared to TCP, UDP does not contain features, such as flow control, congestion control, and data reliability. This makes it difficult to reach reliable communication over UDP with a throughput rate that is close to the maximum speed of the network interface controller (NIC).
34.6.1. Detecting packet drops
There are multiple levels in the network stack in which the kernel can drop packets. Red Hat Enterprise Linux provides different utilities to display statistics of these levels. Use them to identify potential problems.
Note that you can ignore a very small rate of dropped packets. However, if you encounter a significant rate, consider tuning measures.
The kernel drops network packets if the networking stack cannot handle the incoming traffic.
Procedure
Identify if the network interface controller (NIC) drops packets:
Display the NIC and driver-specific statistics:
# ethtool -S enp1s0
NIC statistics:
     ...
     rx_queue_0_drops: 17657
     ...
The naming of the statistics and if they are available depend on the NIC and the driver.
Display the interface statistics:
# ip -s link show enp1s0
2: enp1s0: <BROADCAST,MULTICAST,UP,LOWER_UP> mtu 1500 qdisc fq_codel state UP mode DEFAULT group default qlen 1000
    link/ether 52:54:00:74:79:56 brd ff:ff:ff:ff:ff:ff
    RX:   bytes  packets errors dropped  missed   mcast_
    84697611107 56866482      0   10904       0       0
    TX:   bytes  packets errors dropped carrier collsns_
     5540028184  3722234      0       0       0       0
RXrepresents the statistics of received packets andTXof transmitted packets.
Identify UDP protocol-specific packet drops due to too small socket buffers or slow application processing:
# nstat -az UdpSndbufErrors UdpRcvbufErrors
#kernel
UdpSndbufErrors           4    0.0
UdpRcvbufErrors    45716659    0.0
The second column in the output lists the counters.
Additional resources
34.6.2. Testing the UDP throughput using iperf3
The iperf3 utility provides a server and client mode to perform network throughput tests between two hosts.
The throughput of applications depend on many factors, such as the buffer sizes that the application uses. Therefore, the results measured with testing utilities, such as iperf3, can significantly be different from those of applications on a server under production workload.
Prerequisites
-
The
iperf3package is installed on both the client and server. - No other services on both hosts cause network traffic that substantially affects the test result.
- Optional: You increased the maximum UDP socket sizes on both the server and the client. For details, see Increasing the system-wide UDP socket buffers.
Procedure
Optional: Display the maximum network speed of the network interface controller (NIC) on both the server and client:
# ethtool enp1s0 | grep "Speed"
   Speed: 10000Mb/s
On the server:
Display the maximum UDP socket read buffer size, and note the value:
# sysctl net.core.rmem_max
net.core.rmem_max = 16777216
The displayed value is in bytes.
Temporarily open the default
iperf3port 5201 in thefirewalldservice:# firewall-cmd --add-port=5201/tcp --add-port=5201/udp # firewall-cmd --reload
Note that,
iperf3opens only a TCP socket on the server. If a clients wants to use UDP, it first connects to this TCP port, and then the server opens a UDP socket on the same port number for performing the UDP traffic throughput test. For this reason, you must open port 5201 for both the TCP and UDP protocol in the local firewall.Start
iperf3in server mode:# iperf3 --serverThe service now waits for incoming client connections.
On the client:
Display the Maximum Transmission Unit (MTU) of the interface that the client will use for the connection to the server, and note the value:
# ip link show enp1s0
2: enp1s0: <BROADCAST,MULTICAST,UP,LOWER_UP> mtu 1500 qdisc fq_codel state UP mode DEFAULT group default qlen 1000
...
Display the maximum UDP socket write buffer size, and note the value:
# sysctl net.core.wmem_max
net.core.wmem_max = 16777216
The displayed value is in bytes.
Start measuring the throughput:
# iperf3 --udp --time 60 --window 16777216 --length 1472 --bitrate 2G --client 192.0.2.1-
--udp: Use the UDP protocol for the test. -
--time <seconds>: Defines the time in seconds when the client stops the transmission. -
--window <size>: Sets the UDP socket buffer size. Ideally, the sizes are the same on both the client and server. In case that they are different, set this parameter to the value that is smaller:net.core.wmem_maxon the client ornet.core.rmem_maxon the server. -
--length <size>: Sets the length of the buffer to read and write. Set this option to the largest unfragmented payload. Calculate the ideal value as follows: MTU - IP header (20 bytes for IPv4 and 40 bytes for IPv6) - 8 bytes UDP header. --bitrate <rate>: Limits the bit rate to the specified value in bits per second. You can specify units, such as2Gfor 2 Gbps.Set this parameter to a value that you expect to work and increase it in later measurements. If the server sends packets at a faster rate than the devices on the transmit path or the client can process them, packets can be dropped.
-
--client <server>: Enables the client mode and sets the IP address or name of the server that runs theiperf3server.
-
Wait until
iperf3completes the test. Both the server and the client display statistics every second and a summary at the end. For example, the following is a summary displayed on a client:[ ID] Interval Transfer Bitrate Jitter Lost/Total Datagrams [ 5] 0.00-60.00 sec 14.0 GBytes 2.00 Gbits/sec 0.000 ms 0/10190216 (0%) sender [ 5] 0.00-60.04 sec 14.0 GBytes 2.00 Gbits/sec 0.002 ms 0/10190216 (0%) receiver
In this example, the average bit rate was 2 Gbps, and no packets were lost.
On the server:
-
Press Ctrl+C to stop the
iperf3server. Close port 5201 in
firewalld:# firewall-cmd --remove-port=5201/tcp --remove-port=5201/udp # firewall-cmd --reload
-
Press Ctrl+C to stop the
Additional resources
-
iperf3(1)man page
34.6.3. Impact of the MTU size on UDP traffic throughput
If your application uses a large UDP message size, using jumbo frames can improve the throughput. According to the IEEE 802.3 standard, a default Ethernet frame without Virtual Local Area Network (VLAN) tag has a maximum size of 1518 bytes. Each of these frames includes an 18 bytes header, leaving 1500 bytes for payload. Consequently, for every 1500 bytes of data the server transmits over the network, 18 bytes (1.2%) are overhead.
Jumbo frames are non-standardized frames that have a larger Maximum Transmission Unit (MTU) than the standard Ethernet payload size of 1500 bytes. For example, if you configure jumbo Frames with the maximum allowed MTU of 9000 bytes payload, the overhead of each frame reduces to 0.2%.
All network devices on the transmission path and the involved broadcast domains must support jumbo frames and use the same MTU. Packet fragmentation and reassembly due to inconsistent MTU settings on the transmission path reduces the network throughput.
Different connection types have certain MTU limitations:
- Ethernet: the MTU is limited to 9000 bytes.
- IP over InfiniBand (IPoIB) in datagram mode: The MTU is limited to 4 bytes less than the InfiniBand MTU.
- In-memory networking commonly supports larger MTUs. For details, see the respective documentation.
34.6.4. Impact of the CPU speed on UDP traffic throughput
In bulk transfers, the UDP protocol is much less efficient than TCP, mainly due to the missing packet aggregation in UDP. By default, the Generic Receive Offload (GRO) and Transmit Segmentation Offload (TSO) features are not enabled. Consequently, the CPU frequency can limit the UDP throughput for bulk transfer on high speed links.
For example, on a tuned host with a high Maximum Transmission Unit (MTU) and large socket buffers, a 3 GHz CPU can process the traffic of a 10 GBit NIC that sends or receives UDP traffic at full speed. However, you can expect about 1-2 Gbps speed loss for every 100 MHz CPU speed under 3 GHz when you transmit UDP traffic. Also, if a CPU speed of 3 GHz can closely achieve 10 Gbps, the same CPU restricts UDP traffic on a 40 GBit NIC to roughly 20-25 Gbps.
34.6.5. Increasing the system-wide UDP socket buffers
Socket buffers temporarily store data that the kernel has received or should send:
- The read socket buffer holds packets that the kernel has received but which the application has not read yet.
- The write socket buffer holds packets that an application has written to the buffer but which the kernel has not passed to the IP stack and network driver yet.
If a UDP packet is too large and exceeds the buffer size or packets are sent or received at a too fast rate, the kernel drops any new incoming UDP packet until the data is removed from the buffer. In this case, increasing the socket buffers can prevent packet loss.
Setting too large buffer sizes wastes memory. Each socket can be set to the size that the application requests, and the kernel doubles this value. For example, if an application requests a 256 KiB socket buffer size and opens 1 million sockets, the system requires 512 GB RAM (512 KiB x 1 million) only for the potential socket buffer space.
Prerequisites
- You encountered a significant rate of dropped UDP packets.
Procedure
Create the
/etc/sysctl.d/10-udp-socket-buffers.conffile and either set the maximum read or write buffer size, or both, based on your requirements:net.core.rmem_max = 16777216 net.core.wmem_max = 16777216
Specify the values in bytes. The values in this example set the maximum size of buffers to 16 MiB. The default values of both parameters are
212992bytes (208 KiB).Load the settings from the
/etc/sysctl.d/10-udp-socket-buffers.conffile:# sysctl -p /etc/sysctl.d/10-udp-socket-buffers.confConfigure your applications to use the larger socket buffer sizes.
The
net.core.rmem_maxandnet.core.wmem_maxparameters define the maximum buffer size that thesetsockopt()function in an application can request. Note that, if you configure your application to not use thesetsockopt()function, the kernel uses the values from thermem_defaultandwmem_defaultparameters.For further details, see the documentation of the programming language of your application. If you are not the developer of the application, contact the developer.
- Restart the applications to use the new UDP buffer sizes.
Verification
Monitor the packet drop statistics using the same method as you used when you encountered the packet drops.
If packet drops still occur but at a lower rate, increase the buffer sizes further.
Additional resources
- What are the implications of changing socket buffer sizes? solution
-
udp(7)man page -
socket(7)man page
34.7. Identifying application read socket buffer bottlenecks
If TCP applications do not clear the read socket buffers frequently enough, performance can suffer and packets can be lost. Red Hat Enterprise Linux provides different utilities to identify such problems.
34.7.1. Identifying receive buffer collapsing and pruning
When the data in the receive queue exceeds the receive buffer size, the TCP stack tries to free some space by removing unnecessary metadata from the socket buffer. This step is known as collapsing.
If collapsing fails to free sufficient space for additional traffic, the kernel prunes new data that arrives. This means that the kernel removes the data from the memory and the packet is lost.
To avoid collapsing and pruning operations, monitor whether TCP buffer collapsing and pruning happens on your server and, in this case, tune the TCP buffers.
Procedure
Use the
nstatutility to query theTcpExtTCPRcvCollapsedandTcpExtRcvPrunedcounters:# nstat -az TcpExtTCPRcvCollapsed TcpExtRcvPruned #kernel TcpExtRcvPruned 0 0.0 TcpExtTCPRcvCollapsed 612859 0.0Wait some time and re-run the
nstatcommand:# nstat -az TcpExtTCPRcvCollapsed TcpExtRcvPruned #kernel TcpExtRcvPruned 0 0.0 TcpExtTCPRcvCollapsed 620358 0.0If the values of the counters have increased compared to the first run, tuning is required:
-
If the application uses the
setsockopt(SO_RCVBUF)call, consider removing it. With this call, the application only uses the receive buffer size specified in the call and turns off the socket’s ability to auto-tune its size. -
If the application does not use the
setsockopt(SO_RCVBUF)call, tune the default and maximum values of the TCP read socket buffer.
-
If the application uses the
Display the receive backlog queue (
Recv-Q):# ss -nti State Recv-Q Send-Q Local Address:Port Peer Address:Port Process ESTAB 0 0 192.0.2.1:443 192.0.2.125:41574 :7,7 ... lastrcv:543 ... ESTAB 78 0 192.0.2.1:443 192.0.2.56:42612 :7,7 ... lastrcv:658 ... ESTAB 88 0 192.0.2.1:443 192.0.2.97:40313 :7,7 ... lastrcv:5764 ... ...Run the
ss -ntcommand multiple times with a few seconds waiting time between each run.If the output lists only one case of a high value in the
Recv-Qcolumn, the application was between two receive operations. However, if the values inRecv-Qstays constant whilelastrcvcontinually grows, orRecv-Qcontinually increases over time, one of the following problems can be the cause:- The application does not check its socket buffers often enough. Contact the application vendor for details about how you can solve this problem.
The application does not get enough CPU time. To further debug this problem:
Display on which CPU cores the application runs:
# ps -eo pid,tid,psr,pcpu,stat,wchan:20,comm
    PID     TID PSR %CPU STAT WCHAN                COMMAND
...
  44594   44594   5  0.0 Ss   do_select            httpd
  44595   44595   3  0.0 S    skb_wait_for_more_pa httpd
  44596   44596   5  0.0 Sl   pipe_read            httpd
  44597   44597   5  0.0 Sl   pipe_read            httpd
  44602   44602   5  0.0 Sl   pipe_read            httpd
...
The
PSRcolumn displays the CPU cores the process is currently assigned to.- Identify other processes running on the same cores and consider assigning them to other cores.
Additional resources
34.8. Tuning applications with a large number of incoming requests
If you run an application that handles a large number of incoming requests, such as web servers, it can be necessary to tune Red Hat Enterprise Linux to optimize the performance.
34.8.1. Tuning the TCP listen backlog to process a high number of TCP connection attempts
When an application opens a TCP socket in LISTEN state, the kernel limits the number of accepted client connections this socket can handle. If clients try to establish more connections than the application can process, the new connections get lost or the kernel sends SYN cookies to the client.
If the system is under normal workload and too many connections from legitimate clients cause the kernel to send SYN cookies, tune Red Hat Enterprise Linux (RHEL) to avoid them.
Prerequisites
-
RHEL logs
possible SYN flooding on port <ip_address>:<port_number>error messages in the Systemd journal. - The high number of connection attempts are from valid sources and not caused by an attack.
Procedure
To verify whether tuning is required, display the statistics for the affected port:
# ss -ntl '( sport = :443 )'
State    Recv-Q   Send-Q   Local Address:Port   Peer Address:Port  Process
LISTEN   650      500      192.0.2.1:443        0.0.0.0:*
If the current number of connections in the backlog (
Recv-Q) is larger than the socket backlog (Send-Q), the listen backlog is still not large enough and tuning is required.Optional: Display the current TCP listen backlog limit:
# sysctl net.core.somaxconn
net.core.somaxconn = 4096
Create the
/etc/sysctl.d/10-socket-backlog-limit.conffile, and set a larger listen backlog limit:net.core.somaxconn = 8192Note that applications can request a larger listen backlog than specified in the
net.core.somaxconnkernel parameter but the kernel limits the application to the number you set in this parameter.Load the setting from the
/etc/sysctl.d/10-socket-backlog-limit.conffile:# sysctl -p /etc/sysctl.d/10-socket-backlog-limit.confReconfigure the application to use the new listen backlog limit:
-
If the application provides a config option for the limit, update it. For example, the Apache HTTP Server provides the
ListenBacklogconfiguration option to set the listen backlog limit for this service. - If you cannot configure the limit, recompile the application.
-
If the application provides a config option for the limit, update it. For example, the Apache HTTP Server provides the
- Restart the application.
Verification
-
Monitor the Systemd journal for further occurrences of
possible SYN flooding on port <port_number>error messages. Monitor the current number of connections in the backlog and compare it with the socket backlog:
# ss -ntl '( sport = :443 )'
State    Recv-Q   Send-Q   Local Address:Port   Peer Address:Port  Process
LISTEN   0        500      192.0.2.1:443        0.0.0.0:*
If the current number of connections in the backlog (
Recv-Q) is larger than the socket backlog (Send-Q), the listen backlog is not large enough and further tuning is required.
Additional resources
- kernel: Possible SYN flooding on port #. Sending cookies solution
- Listening TCP server ignores SYN or ACK for new connection handshake solution
-
listen(2)man page
34.9. Avoiding listen queue lock contention
Queue lock contention can cause packet drops and higher CPU usage and, consequently, a higher latency. You can avoid queue lock contention on the receive (RX) and transmit (TX) queue by tuning your application and using transmit packet steering.
34.9.1. Avoiding RX queue lock contention: The SO_REUSEPORT and SO_REUSEPORT_BPF socket options
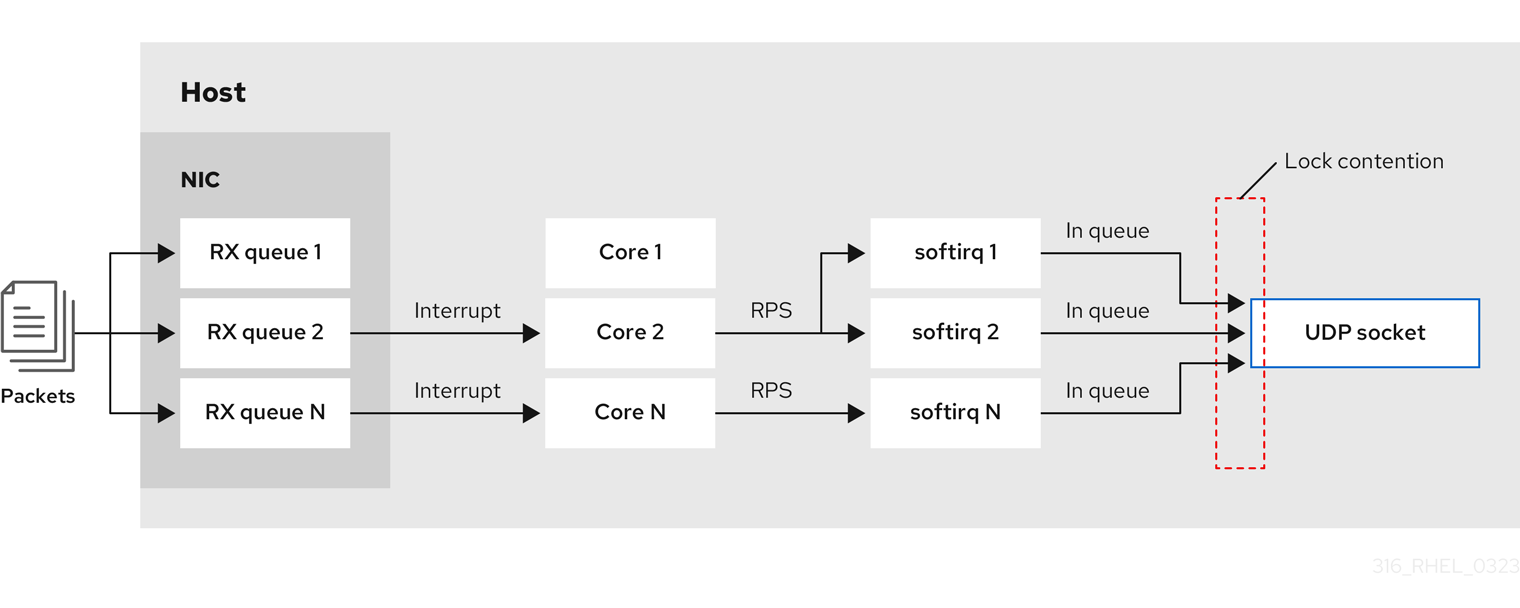
On a multi-core system, you can improve the performance of multi-threaded network server applications if the application opens the port by using the SO_REUSEPORT or SO_REUSEPORT_BPF socket option. If the application does not use one of these socket options, all threads are forced to share a single socket to receive the incoming traffic. Using a single socket causes:
- Significant contention on the receive buffer, which can cause packet drops and higher CPU usage.
- A significant increase of CPU usage
- Possibly packet drops
With the SO_REUSEPORT or SO_REUSEPORT_BPF socket option, multiple sockets on one host can bind to the same port:
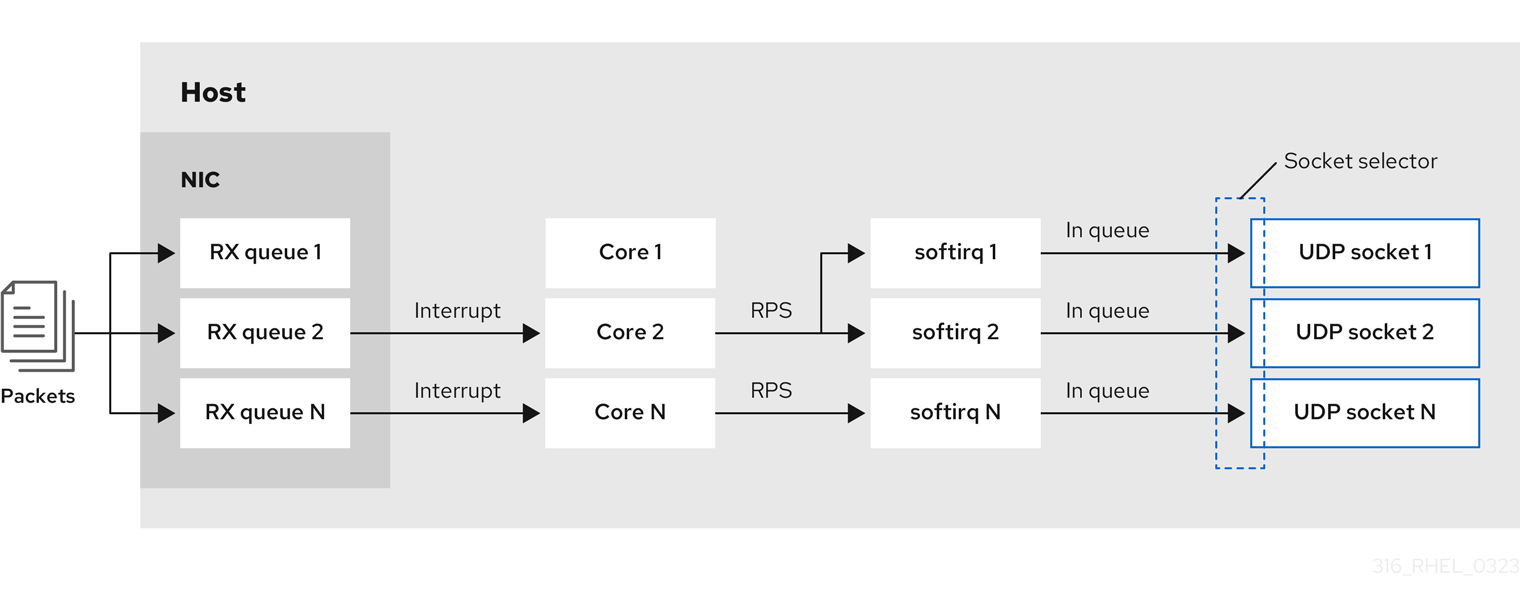
Red Hat Enterprise Linux provides a code example of how to use the SO_REUSEPORT socket options in the kernel sources. To access the code example:
Enable the
rhel-8-for-x86_64-baseos-debug-rpmsrepository:# subscription-manager repos --enable rhel-8-for-x86_64-baseos-debug-rpmsInstall the
kernel-debuginfo-common-x86_64package:# yum install kernel-debuginfo-common-x86_64-
The code example is now available in the
/usr/src/debug/kernel-<version>/linux-<version>/tools/testing/selftests/net/reuseport_bpf_cpu.cfile.
Additional resources
-
socket(7)man page -
/usr/src/debug/kernel-<version>/linux-<version>/tools/testing/selftests/net/reuseport_bpf_cpu.c
34.9.2. Avoiding TX queue lock contention: Transmit packet steering
In hosts with a network interface controller (NIC) that supports multiple queues, transmit packet steering (XPS) distributes the processing of outgoing network packets among several queues. This enables multiple CPUs to process the outgoing network traffic and to avoid transmit queue lock contention and, consequently, packet drops.
Certain drivers, such as ixgbe, i40e, and mlx5 automatically configure XPS. To identify if the driver supports this capability, consult the documentation of your NIC driver. Consult your NIC driver’s documentation to identify if the driver supports this capability. If the driver does not support XPS auto-tuning, you can manually assign CPU cores to the transmit queues.
Red Hat Enterprise Linux does not provide an option to permanently assign transmit queues to CPU cores. Use the commands in a script and run it when the system boots.
Prerequisites
- The NIC supports multiple queues.
-
The
numactlpackage is installed.
Procedure
Display the count of available queues:
# ethtool -l enp1s0
Channel parameters for enp1s0:
Pre-set maximums:
RX:		0
TX:		0
Other:		0
Combined:	4
Current hardware settings:
RX:		0
TX:		0
Other:		0
Combined:	1
The
Pre-set maximumssection shows the total number of queues andCurrent hardware settingsthe number of queues that are currently assigned to the receive, transmit, other, or combined queues.Optional: If you require queues on specific channels, assign them accordingly. For example, to assign the 4 queues to the
Combinedchannel, enter:# ethtool -L enp1s0 combined 4Display to which Non-Uniform Memory Access (NUMA) node the NIC is assigned:
# cat /sys/class/net/enp1s0/device/numa_node
0
If the file is not found or the command returns
-1, the host is not a NUMA system.If the host is a NUMA system, display which CPUs are assigned to which NUMA node:
# lscpu | grep NUMA
NUMA node(s):       2
NUMA node0 CPU(s):  0-3
NUMA node1 CPU(s):  4-7
In the example above, the NIC has 4 queues and the NIC is assigned to NUMA node 0. This node uses the CPU cores 0-3. Consequently, map each transmit queue to one of the CPU cores from 0-3:
# echo 1 > /sys/class/net/enp1s0/queues/tx-0/xps_cpus
# echo 2 > /sys/class/net/enp1s0/queues/tx-1/xps_cpus
# echo 4 > /sys/class/net/enp1s0/queues/tx-2/xps_cpus
# echo 8 > /sys/class/net/enp1s0/queues/tx-3/xps_cpus
If the number of CPU cores and transmit (TX) queues is the same, use a 1 to 1 mapping to avoid any kind of contention on the TX queue. Otherwise, if you map multiple CPUs on the same TX queue, transmit operations on different CPUs will cause TX queue lock contention and negatively impacts the transmit throughput.
Note that you must pass the bitmap, containing the CPU’s core numbers, to the queues. Use the following command to calculate the bitmap:
# printf %x $((1 << <core_number> ))
Verification
Identify the process IDs (PIDs) of services that send traffic:
# pidof <process_name>
12345 98765
Pin the PIDs to cores that use XPS:
# numactl -C 0-3 12345 98765Monitor the
requeuescounter while the process send traffic:# tc -s qdisc qdisc fq_codel 0: dev enp10s0u1 root refcnt 2 limit 10240p flows 1024 quantum 1514 target 5ms interval 100ms memory_limit 32Mb ecn drop_batch 64 Sent 125728849 bytes 1067587 pkt (dropped 0, overlimits 0 requeues 30) backlog 0b 0p requeues 30 ...
If the
requeuescounter no longer increases at a significant rate, TX queue lock contention no longer happens.
Additional resources
-
/usr/share/doc/kernel-doc-_<version>/Documentation/networking/scaling.rst
34.9.3. Disabling the Generic Receive Offload feature on servers with high UDP traffic
Applications that use high-speed UDP bulk transfer should enable and use UDP Generic Receive Offload (GRO) on the UDP socket. However, you can disable GRO to increase the throughput if the following conditions apply:
- The application does not support GRO and the feature cannot be added.
TCP throughput is not relevant.
WarningDisabling GRO significantly reduces the receive throughput of TCP traffic. Therefore, do not disable GRO on hosts where TCP performance is relevant.
Prerequisites
- The host mainly processes UDP traffic.
- The application does not use GRO.
- The host does not use UDP tunnel protocols, such as VXLAN.
- The host does not run virtual machines (VMs) or containers.
Procedure
Optional: Display the NetworkManager connection profiles:
# nmcli connection show
NAME     UUID                                  TYPE      DEVICE
example  f2f33f29-bb5c-3a07-9069-be72eaec3ecf  ethernet  enp1s0
Disable GRO support in the connection profile:
# nmcli connection modify example ethtool.feature-gro offReactivate the connection profile:
# nmcli connection up example
Verification
Verify that GRO is disabled:
# ethtool -k enp1s0 | grep generic-receive-offload generic-receive-offload: off- Monitor the throughput on the server. Re-enable GRO in the NetworkManager profile if the setting has negative side effects to other applications on the host.
Additional resources
34.10. Tuning the device driver and NIC
In RHEL, kernel modules provide drivers for network interface controllers (NICs). These modules support parameters to tune and optimize the device driver and the NIC. For example, if the driver supports delaying the generation of receive interrupts, you can reduce the value of the corresponding parameter to avoid running out of receive descriptors.
Not all modules support custom parameters, and the features depend on the hardware, as well as the driver and firmware version.
34.10.1. Configuring custom NIC driver parameters
Many kernel modules support setting parameters to tune the driver and the network interface controller (NIC). You can customize the settings according to the hardware and the driver.
If you set parameters on a kernel module, RHEL applies these settings to all devices that use this driver.
Prerequisites
- A NIC is installed in the host.
- The kernel module that provides the driver for the NIC supports the required tuning feature.
- You are logged in locally or using a network interface that is different from the one that uses the driver for which you want to change the parameters.
Procedure
Identify the driver:
# ethtool -i enp0s31f6
driver: e1000e
version: ...
firmware-version: ...
...
Note that certain features can require a specific driver and firmware version.
Display the available parameters of the kernel module:
# modinfo -p e1000e
...
SmartPowerDownEnable:Enable PHY smart power down (array of int)
parm:RxIntDelay:Receive Interrupt Delay (array of int)
For further details on the parameters, see the kernel module’s documentation. For modules in RHEL, see the documentation in the
/usr/share/doc/kernel-doc-<version>/Documentation/networking/device_drivers/directory that is provided by thekernel-docpackage.Create the
/etc/modprobe.d/nic-parameters.conffile and specify the parameters for the module:options <module_name> <parameter1>=<value> <parameter2>=<value>
For example, to enable the port power saving mechanism and set the generation of receive interrupts to 4 units, enter:
options e1000e SmartPowerDownEnable=1 RxIntDelay=4Unload the module:
# modprobe -r e1000eWarningUnloading a module that an active network interface uses, immediately terminates the connection and you can lock yourself out of the server.
Load the module:
# modprobe e1000eReactivate the network connections:
# nmcli connection up <profile_name>
Verification
Display the kernel messages:
# dmesg
...
[35309.225765] e1000e 0000:00:1f.6: Transmit Interrupt Delay set to 16
[35309.225769] e1000e 0000:00:1f.6: PHY Smart Power Down Enabled
...
Note that not all modules log parameter settings to the kernel ring buffer.
Certain kernel modules create files for each module parameter in the
/sys/module/<driver>/parameters/directory. Each of these files contain the current value of this parameter. You can display these files to verify a setting:# cat /sys/module/<driver_name>/parameters/<parameter_name>
34.11. Configuring network adapter offload settings
To reduce CPU load, certain network adapters use offloading features which move the network processing load to the network interface controller (NIC). For example, with Encapsulating Security Payload (ESP) offload, the NIC performs ESP operations to accelerate IPsec connections and reduce CPU load.
By default, most offloading features in Red Hat Enterprise Linux are enabled. Only disable them in the following cases:
- Temporarily disable offload features for troubleshooting purposes.
- Permanently disable offload features when a specific feature negatively impacts your host.
If a performance-related offload feature is not enabled by default in a network driver, you can enable it manually.
34.11.1. Temporarily setting an offload feature
If you expect that an offload feature causes problems or reduces the performance of your host, you can attempt to narrow down the cause by temporarily enabling or disabling it, depending on its current state.
If you temporarily enable or disable an offload feature, it returns to its previous value on the next reboot.
Prerequisites
- The network card supports offload features.
Procedure
Display the interface’s available offload features and their current state:
# ethtool -k enp1s0
...
esp-hw-offload: on
ntuple-filters: off
rx-vlan-filter: off [fixed]
...
The output depends on the capabilities of the hardware and its driver. Note that you cannot change the state of features that are flagged with
[fixed].Temporarily disable an offload feature:
# ethtool -K <interface> <feature> [on|off]For example, to temporarily disable IPsec Encapsulating Security Payload (ESP) offload on the
enp10s0u1interface, enter:# ethtool -K enp10s0u1 esp-hw-offload offFor example, to temporarily enable accelerated Receive Flow Steering (aRFS) filtering on the
enp10s0u1interface, enter:# ethtool -K enp10s0u1 ntuple-filters on
Verification
Display the states of the offload features:
# ethtool -k enp1s0
...
esp-hw-offload: off
ntuple-filters: on
...
Test whether the problem you encountered before changing the offload feature still exists.
If the problem no longer exists after changing a specific offload feature:
- Contact Red Hat Support and report the problem.
- Consider permanently setting the offload feature until a fix is available.
If the problem still exists after disabling a specific offload feature:
-
Reset the setting to its previous state by using the
ethtool -K <interface> <feature> [on|off]command. - Enable or disable a different offload feature to narrow down the problem.
-
Reset the setting to its previous state by using the
Additional resources
-
ethtool(8)man page
34.11.2. Permanently setting an offload feature
If you have identified a specific offload feature that limits the performance on your host, you can permanently enable or disable it, depending on its current state.
If you permanently enable or disable an offload feature, NetworkManager ensures that the feature still has this state after a reboot.
Prerequisites
- You identified a specific offload feature to limit the performance on your host.
Procedure
Identify the connection profile that uses the network interface on which you want to change the state of the offload feature:
# nmcli connection show
NAME     UUID                                  TYPE      DEVICE
Example  a5eb6490-cc20-3668-81f8-0314a27f3f75  ethernet  enp1ss0
...
Permanently change the state of the offload feature:
# nmcli connection modify <connection_name> <feature> [on|off]For example, to permanently disable IPsec Encapsulating Security Payload (ESP) offload in the
Exampleconnection profile, enter:# nmcli connection modify Example ethtool.feature-esp-hw-offload offFor example, to permanently enable accelerated Receive Flow Steering (aRFS) filtering in the
Exampleconnection profile, enter:# nmcli connection modify Example ethtool.feature-ntuple on
Reactivate the connection profile:
# nmcli connection up Example
Verification
Display the output states of the offload features:
# ethtool -k enp1s0
...
esp-hw-offload: off
ntuple-filters: on
...
Additional resources
-
nm-settings-nmcli(5)man page
34.12. Tuning interrupt coalescence settings
Interrupt coalescence is a mechanism for reducing the number of interrupts generated by a network card. Generally, fewer interrupts can enhance the latency and overall performance of your network.
Tuning the interrupt coalescence settings involves adjusting the parameters that control:
- The number of packets that are combined into a single interrupt.
- The delay before generating an interrupt.
The optimal coalescence settings depend on the specific network conditions and hardware in use. Therefore, it might take several attempts to find the settings that work best for your environment and needs.
34.12.1. Optimizing RHEL for latency or throughput-sensitive services
The goal of coalesce tuning is to minimize the number of interrupts required for a given workload. In high-throughput situations, the goal is to have as few interrupts as possible while maintaining a high data rate. In low-latency situations, more interrupts can be used to handle traffic quickly.
You can adjust the settings on your network card to increase or decrease the number of packets that are combined into a single interrupt. As a result, you can achieve improved throughput or latency for your traffic.
Procedure
Identify the network interface that is experiencing the bottleneck:
# ethtool -S enp1s0
NIC statistics:
     rx_packets: 1234
     tx_packets: 5678
     rx_bytes: 12345678
     tx_bytes: 87654321
     rx_errors: 0
     tx_errors: 0
     rx_missed: 0
     tx_dropped: 0
     coalesced_pkts: 0
     coalesced_events: 0
     coalesced_aborts: 0
Identify the packet counters containing "drop", "discard", or "error" in their name. These particular statistics measure the actual packet loss at the network interface card (NIC) packet buffer, which can be caused by NIC coalescence.
Monitor values of packet counters you identified in the previous step.
Compare them to the expected values for your network to determine whether any particular interface experiences a bottleneck. Some common signs of a network bottleneck include, but are not limited to:
- Many errors on a network interface
- High packet loss
Heavy usage of the network interface
NoteOther important factors are for example CPU usage, memory usage, and disk I/O when identifying a network bottleneck.
View the current coalescence settings:
# ethtool enp1s0
Settings for enp1s0:
        Supported ports: [ TP ]
        Supported link modes:   10baseT/Half 10baseT/Full
                                100baseT/Half 100baseT/Full
                                1000baseT/Full
        Supported pause frame use: No
        Supports auto-negotiation: Yes
        Advertised link modes:  10baseT/Half 10baseT/Full
                                100baseT/Half 100baseT/Full
                                1000baseT/Full
        Advertised pause frame use: No
        Advertised auto-negotiation: Yes
        Speed: 1000Mb/s
        Duplex: Full
        Port: Twisted Pair
        PHYAD: 0
        Transceiver: internal
        Auto-negotiation: on
        MDI-X: Unknown
        Supports Wake-on: g
        Wake-on: g
        Current message level: 0x00000033 (51)
                               drv probe link
        Link detected: yes
In this output, monitor the
SpeedandDuplexfields. These fields display information about the network interface operation and whether it is running at its expected values.Check the current interrupt coalescence settings:
# ethtool -c enp1s0 Coalesce parameters for enp1s0: Adaptive RX: off Adaptive TX: off RX usecs: 100 RX frames: 8 RX usecs irq: 100 RX frames irq: 8 TX usecs: 100 TX frames: 8 TX usecs irq: 100 TX frames irq: 8-
The
usecsvalues refer to the number of microseconds that the receiver or transmitter waits before generating an interrupt. -
The
framesvalues refer to the number of frames that the receiver or transmitter waits before generating an interrupt. The
irqvalues are used to configure the interrupt moderation when the network interface is already handling an interrupt.NoteNot all network interface cards support reporting and changing all values from the example output.
-
The
Adaptive RX/TXvalue represents the adaptive interrupt coalescence mechanism, which adjusts the interrupt coalescence settings dynamically. Based on the packet conditions, the NIC driver auto-calculates coalesce values whenAdaptive RX/TXare enabled (the algorithm differs for every NIC driver).
-
The
Modify the coalescence settings as needed. For example:
While
ethtool.coalesce-adaptive-rxis disabled, configureethtool.coalesce-rx-usecsto set the delay before generating an interrupt to 100 microseconds for the RX packets:# nmcli connection modify enp1s0 ethtool.coalesce-rx-usecs 100Enable
ethtool.coalesce-adaptive-rxwhileethtool.coalesce-rx-usecsis set to its default value:# nmcli connection modify enp1s0 ethtool.coalesce-adaptive-rx onRed Hat recommends that modifying the Adaptive-RX setting as follows:
-
Users concerned with low latency (sub-50us) should not enable
Adaptive-RX. -
Users concerned with throughput can probably enable
Adaptive-RXwith no harm. If they do not want to use the adaptive interrupt coalescence mechanism, they can try setting large values like 100us, or 250us toethtool.coalesce-rx-usecs. - Users unsure about their needs should not modify this setting until an issue occurs.
-
Users concerned with low latency (sub-50us) should not enable
Re-activate the connection:
# nmcli connection up enp1s0
Verification steps
Monitor the network performance and check for dropped packets:
# ethtool -S enp1s0
NIC statistics:
     rx_packets: 1234
     tx_packets: 5678
     rx_bytes: 12345678
     tx_bytes: 87654321
     rx_errors: 0
     tx_errors: 0
     rx_missed: 0
     tx_dropped: 0
     coalesced_pkts: 12
     coalesced_events: 34
     coalesced_aborts: 56
...
The value of the
rx_errors,rx_dropped,tx_errors, andtx_droppedfields should be 0 or close to it (up to few hundreds, depending on the network traffic and system resources). A high value in these fields indicates a network problem. Your counters can have different names. Closely monitor packet counters containing "drop", "discard", or "error" in their name.The value of the
rx_packets,tx_packets,rx_bytes, andtx_bytesshould increase over time. If the values do not increase, there might be a network problem. The packet counters can have different names, depending on your NIC driver.ImportantThe
ethtoolcommand output can vary depending on the NIC and driver in use.Users with focus on extremely low latency can use application-level metrics or the kernel packet time-stamping API for their monitoring purposes.
34.13. Benefits of TCP Timestamps
TCP Timestamps are optional information in the TCP header and an extension of the TCP protocol. By default, TCP Timestamps are enabled in Red Hat Enterprise Linux, and the kernel uses TCP Timestamps to better estimate the round trip time (RTT) in TCP connections. This results in more accurate TCP window and buffer calculations.
Additionally, TCP Timestamps provide an alternative method to determine the age and order of a segment, and protect against wrapped sequence numbers. TCP packet headers record the sequence number in a 32-bit field. On a 10 Gbps connection, the value of this field can wrap after 1.7 seconds. Without TCP Timestamps, the receiver could not determine whether a segment with a wrapped sequence number is a new segment or an old duplicate. With TCP Timestamps, however, the receiver can make the correct choice to receive or discard the segment. Therefore, enabling TCP Timestamps on systems with fast network interfaces is essential.
The net.ipv4.tcp_timestamps kernel parameter can have one of the following values:
-
0: TCP Timestamps are disabled. -
1: TCP Timestamps are enabled (default). 2: TCP Timestamps are enabled but without random offsets.ImportantWithout random offsets for each connection, it is possible to approximately determine the host’s uptime and fingerprint and use this information in attacks.
By default, TCP Timestamps are enabled in Red Hat Enterprise Linux and use random offsets for each connection instead of only storing the current time:
# sysctl net.ipv4.tcp_timestamps
net.ipv4.tcp_timestamps = 1
If the net.ipv4.tcp_timestamps parameter has a different value than the default (1), revert the setting in the same way as you set it.
Additional resources
34.14. Flow control for Ethernet networks
On an Ethernet link, continuous data transmission between a network interface and a switch port can lead to full buffer capacity. Full buffer capacity results in network congestion. In this case, when the sender transmits data at a higher rate than the processing capacity of the receiver, packet loss can occur due to the lower data processing capacity of a network interface on the other end of the link which is a switch port.
The flow control mechanism manages data transmission across the Ethernet link where each sender and receiver has different sending and receiving capacities. To avoid packet loss, the Ethernet flow control mechanism temporarily suspends the packet transmission to manage a higher transmission rate from a switch port. Note that routers do not forward pause frames beyond a switch port.
When receive (RX) buffers become full, a receiver sends pause frames to the transmitter. The transmitter then stops data transmission for a short sub-second time frame, while continuing to buffer incoming data during this pause period. This duration provides enough time for the receiver to empty its interface buffers and prevent buffer overflow.
Either end of the Ethernet link can send pause frames to another end. If the receive buffers of a network interface are full, the network interface will send pause frames to the switch port. Similarly, when the receive buffers of a switch port are full, the switch port sends pause frames to the network interface.
By default, most of the network drivers in Red Hat Enterprise Linux have pause frame support enabled. To display the current settings of a network interface, enter:
# ethtool --show-pause enp1s0
Pause parameters for enp1s0:
...
RX:     on
TX:     on
...
Verify with your switch vendor to confirm if your switch supports pause frames.
Additional resources