
Chapter 2. Tracking Server and Database Performance
Red Hat Directory Server has two methods of recording and tracking performance data: performance counters and logs. Counters are used to determine how well the Directory Server performing, particularly in database performance; logs are used to diagnose any problem areas with server and LDAP operations and configuration.
Performance counters focus on the operations and information of the Directory Server for the server, all configured databases, and database links (chaining databases).
There are three types of logs: access (for client connections), errors (for errors, warnings, and details of events), and audit (changes to Directory Server configuration). The access and error logs run by default (and the errors log is required for the server to run). Audit logging, because of the overhead, must be enabled manually.
Note
The access log is buffered. This allows full access logging even with highly loaded servers, but there is a time lag between when the event occurs in the server and when the event is written to the log.
2.1. Monitoring Server Activity
The Directory Server's current activities can be monitored from either the Web Console or the command line. It is also possible to monitor the activity of the caches for all of the database.
Note
Some of the counters for Directory Server database attributes monitored by server use 64-bit integers, even on 32-bit systems (total connections, operations initiated, operations completed, entries sent, and bytes sent). On high-volume systems, this keeps the counters from rolling too quickly and skewing monitoring data.
2.1.1. Monitoring the Directory Server Using the Command Line
To monitor the server using the command line:
# dsconf -D "cn=Directory Manager" ldap://server.example.com monitor server
The following table describes the attributes the command returns:
Table 2.1. Server Monitoring Attributes
| Attribute | Description | ||||||
|---|---|---|---|---|---|---|---|
| version | Identifies the directory's current version number. | ||||||
| threads | The current number of active threads used for handling requests. Additional threads may be created by internal server tasks, such as replication or chaining. | ||||||
| connection | Provides the following summary information for each open connection (only available if you bind to the directory as Directory Manager):
| ||||||
| currentconnections | Identifies the number of connections currently in service by the directory. | ||||||
| totalconnections | Identifies the number of connections handled by the directory since it started. | ||||||
| currentconnectionsatmaxthreads | Displays all connections that are currently in a max thread state. | ||||||
| maxthreadsperconnhits | Displays how many times a connection hit max thread. | ||||||
| dtablesize | Shows the number of file descriptors available to the directory. Each connection requires one file descriptor: one for every open index, one for log file management, and one for ns-slapd itself. Essentially, this value shows how many additional concurrent connections can be serviced by the directory. For more information on file descriptors, see the operating system documentation. | ||||||
| readwaiters | Identifies the number of threads waiting to read data from a client. | ||||||
| opsinitiated | Identifies the number of operations the server has initiated since it started. | ||||||
| opscompleted | Identifies the number of operations the server has completed since it started. | ||||||
| entriessent | Identifies the number of entries sent to clients since the server started. | ||||||
| bytessent | Identifies the number of bytes sent to clients since the server started. | ||||||
| currenttime | Identifies the time when this snapshot of the server was taken. The time is displayed in Greenwich Mean Time (GMT) in UTC format. | ||||||
| starttime | Identifies the time when the server started. The time is displayed in Greenwich Mean Time (GMT) in UTC format. | ||||||
| nbackends | Identifies the number of back ends (databases) the server services. |
2.1.2. Monitoring the Server Using the Web Console
To monitor the server using the web console:
- Open the Directory Server user interface in the web console. For details, see Logging Into Directory Server Using the Web Console section in the Red Hat Directory Server Administration Guide.
- Select the instance.
- On the tab, select Server Statistics.
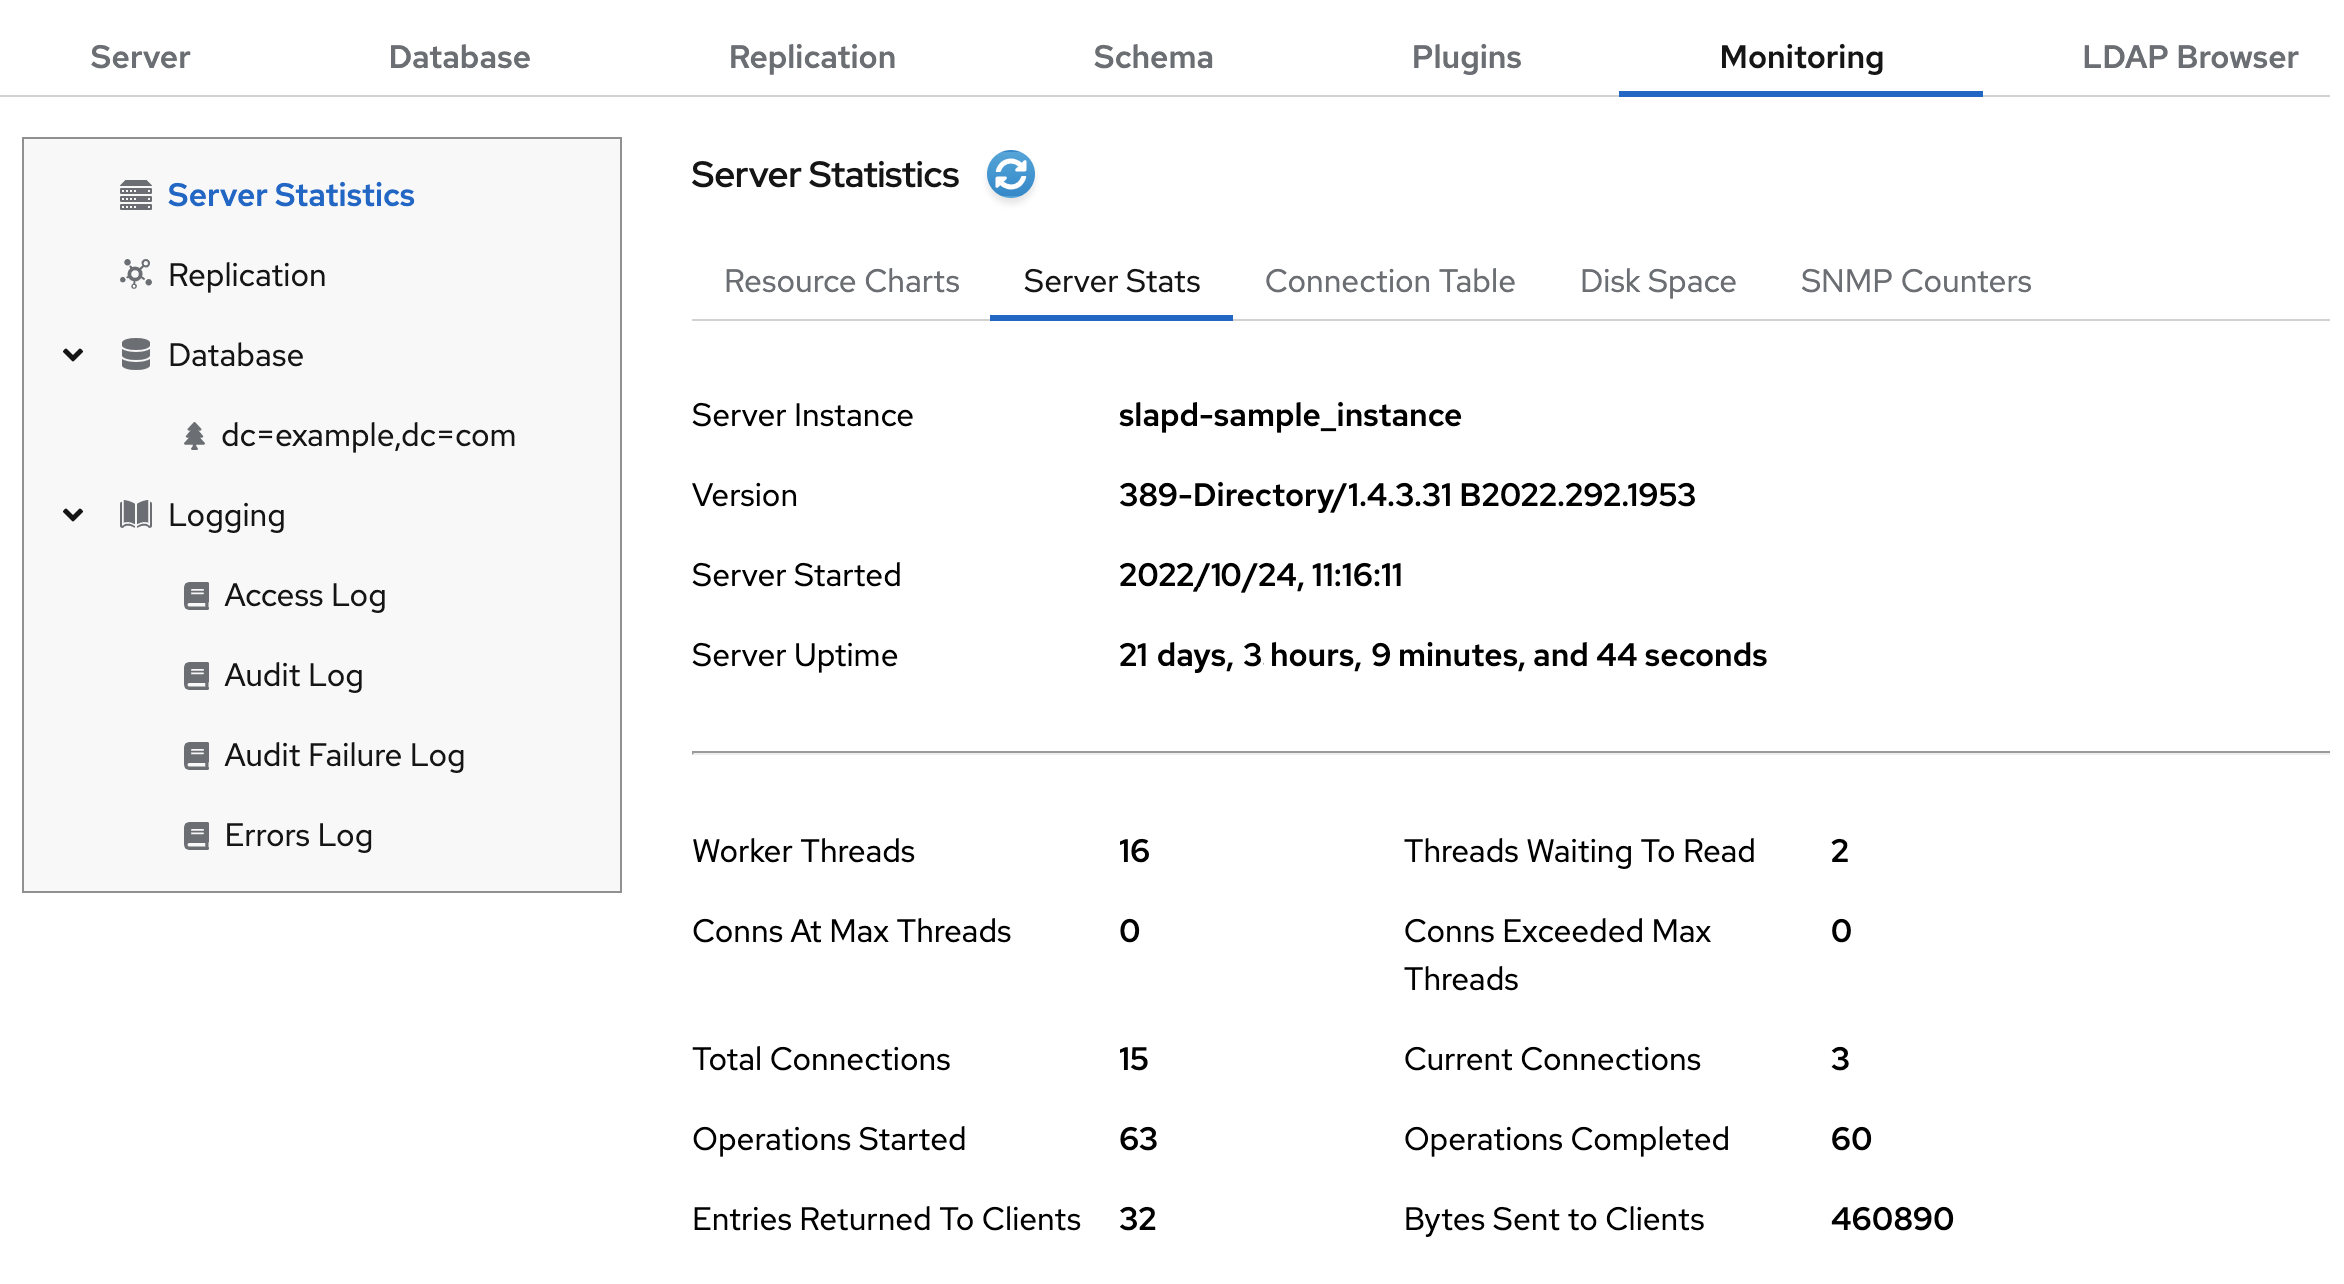 The following table describes the fields visible in this menu:
Table 2.2. General Information (Server)
Field Description Server Instance Displays the name of the Directory Server instance. Version Identifies the current server version. Server Started The date and time the server was started. Server Uptime The time the instance is running. Worker Threads The current number of active threads used for handling requests. Additional threads may be created by internal server tasks, such as replication or chaining. Threads Waiting To Read The total number of threads waiting to read from the client. Threads may not be immediately read if the server starts to receive a request from the client, and then the transmission of that request is halted for some reason. Generally, threads waiting to read are an indication of a slow network or client. Conns At Max Threads Displays all connections that are currently in a max threadstate.Conns Hit Max Threads Displays how many times a connection hit max thread.Total Connections The total number of connections established to this Directory Server instance. Current Connections The total number of open connections. Each connection can account for multiple operations, and therefore multiple threads. Operations Started The number of operations initiated by this connection. Operations Completed The number of operations completed by the server for this connection. Entries Returned to Clients The number of entries sent to clients since the server started. Bytes Sent to Clients The number of bytes sent to clients since the server started.