
Chapter 11. The Health Check API
11.1. The Health Check API
The Health Check API allows users to monitor the health of the cluster, and the caches contained within. This information is particularly important when working in a cloud environment, as it provides a method of querying to report the status of the cluster or cache.
This API exposes the following information:
- The name of the cluster.
- The number of machines in the cluster.
The overall status of the cluster or cache, represented in one of three values:
- Healthy - The entity is healthy.
- Unhealthy - The entity is unhealthy. This value indicates that one or more caches are in a degraded state.
- Rebalancing - The entity is operational, but a rebalance is in progress. Cluster nodes should not be adjusted when this value is reported.
- The status of each cache.
- A tail of the server log.
For information on using the Health Check API programmatically, refer to the JBoss Data Grid Developer Guide.
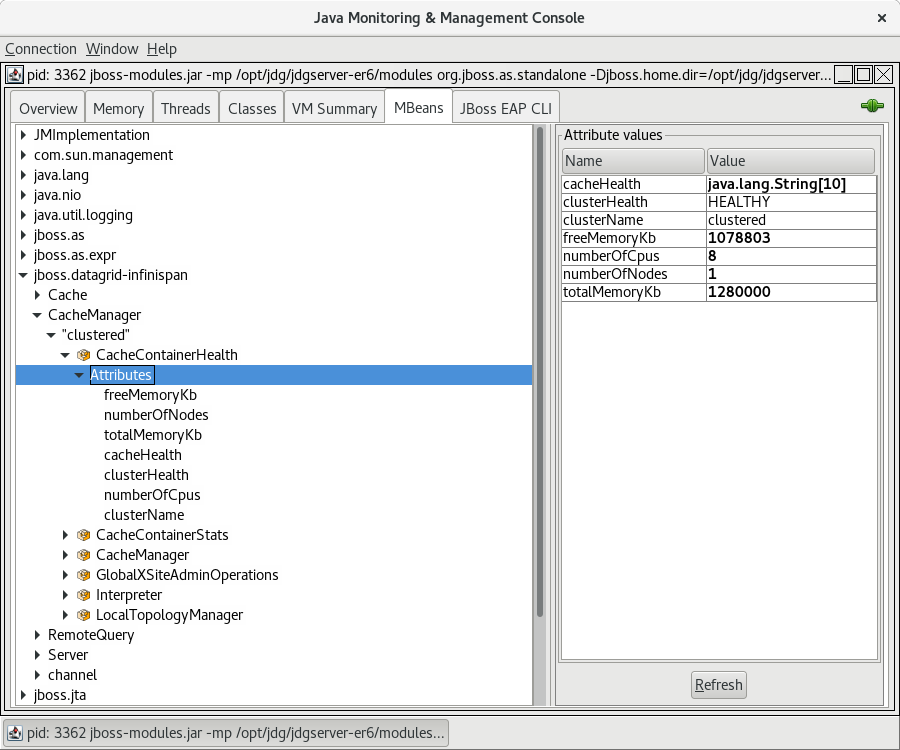
11.2. Accessing the Health API using JMX
The Health Check API may be accessed through JMX, as seen in the following steps:
- Connect to the JBoss Data Grid node using JMX, such as by Connecting to JDG via JConsole.
-
Expand
jboss.datagrid-infinispan. -
Expand
CacheManager. -
Select the desired cache manager. By default the cache manager will be named
local, if the server was started in local mode, orclustered, if the server was started in a clustered mode. -
Expand the
CacheContainerHealthobject. - The Health Check API attributes are now available to be viewed.
An example of this using JConsole is seen below:
11.3. Accessing the Health Check API using the CLI
The Health Check API may be accessed using the included CLI. Once connected to the server use the following command, substituting the desired cache container for CONTAINERNAME:
/subsystem=datagrid-infinispan/cache-container=CONTAINERNAME/health=HEALTH:read-resource(include-runtime=true)
The following demonstrates sample output from the above command, using the clustered cache-container:
[standalone@localhost:9990 health=HEALTH] /subsystem=datagrid-infinispan/cache-container=clustered/health=HEALTH:read-resource(include-runtime=true)
{
    "outcome" => "success",
    "result" => {
        "cache-health" => [
            "default",
            "HEALTHY",
            "_protobuf_metadata", "HEALTHY", "memcachedCache", "HEALTHY", "repl", "HEALTHY", "_script_cache",
            "HEALTHY"
        ],
        "cluster-health" => "HEALTHY",
        "cluster-name" => "clustered",
        "free-memory" => 936823L,
        "log-tail" => [
            "2018-03-04 16:22:28,138 INFO  [org.infinispan.server.endpoint] (MSC service thread 1-7) DGENDPT10001: MemcachedServer listening on 127.0.0.1:11211",
            "2018-03-04 16:22:28,146 INFO  [org.infinispan.server.endpoint] (MSC service thread 1-3) DGENDPT10000: REST starting",
            "2018-03-04 16:22:28,188 INFO  [org.jboss.as.clustering.infinispan] (MSC service thread 1-3) DGISPN0001: Started _protobuf_metadata cache from clustered container", "2018-03-04 16:22:28,195 INFO [org.jboss.as.clustering.infinispan] (MSC service thread 1-3) DGISPN0001: Started _script_cache cache from clustered container",
            "2018-03-04 16:22:28,515 INFO  [org.jboss.as.clustering.infinispan] (MSC service thread 1-4) DGISPN0001: Started ___hotRodTopologyCache cache from clustered container",
            "2018-03-04 16:22:28,552 INFO  [org.infinispan.rest.NettyRestServer] (MSC service thread 1-3) ISPN012003: REST server starting, listening on 127.0.0.1:8080",
            "2018-03-04 16:22:28,552 INFO  [org.infinispan.server.endpoint] (MSC service thread 1-3) DGENDPT10002: REST mapped to /rest",
            "2018-03-04 16:22:28,613 INFO  [org.jboss.as] (Controller Boot Thread) WFLYSRV0060: Http management interface listening on http://127.0.0.1:9990/management",
            "2018-03-04 16:22:28,613 INFO  [org.jboss.as] (Controller Boot Thread) WFLYSRV0051: Admin console listening on http://127.0.0.1:9990",
            "2018-03-04 16:22:28,613 INFO  [org.jboss.as] (Controller Boot Thread) WFLYSRV0025: Data Grid 7.2.0 (WildFly Core 2.1.10.Final-redhat-1) started in 7608ms - Started 196 of 235 services (119 services are lazy, passive or on-demand)"
        ],
        "number-of-cpus" => 8,
        "number-of-nodes" => 1,
        "total-memory" => 1280000L
    }
}
11.4. Accessing the Health Check API using the Management REST Interface
The Health Check API is integrated into the Management REST interface as Metrics (read-only runtime resources).
Due to the metrics being exposed in runtime a HTTP POST method must be used instead of the typical HTTP GET.
To access these Metrics a HTTP POST method must be sent that contains valid user credentials. The following command demonstrates one such request:
curl --digest -L -D - "http://JDGADDRESS:_JDGPORT_/management/subsystem/datagrid-infinispan/cache-container/CONTAINERNAME/health/HEALTH?operation=resource&include-runtime=true&json.pretty=1" --header "Content-Type: application/json" -u username:password
The following properties should be substituted from the above command:
- JDGADDRESS - This should be the hostname or IP address where the JBoss Data Grid server is located.
- JDGPORT - This should be the port where the management interface is listening. By default this is 9990.
-
CONTAINERNAME - This should be the name of the cache container to query. By default the cache manager will be named
local, if the server was started in local mode, orclustered, if the server was started in a clustered mode. - username - The username for accessing the Administration Console.
- password - The associated password for accessing the Administration Console.
If successful, a 200 response should be received along with the health status, such as seen below:
HTTP/1.1 401 Unauthorized
Connection: keep-alive
WWW-Authenticate: Digest realm="ManagementRealm",domain="/management",nonce="n1btFIY4yugNMTQ4ODY2NDY3NjUxMy4utKorhon/y+zSHie9V58=",opaque="00000000000000000000000000000000",algorithm=MD5,qop="auth"
X-Frame-Options: SAMEORIGIN
Content-Length: 77
Content-Type: text/html
Date: Sat, 04 Mar 2018 21:57:56 GMT

HTTP/1.1 200 OK
Connection: keep-alive
X-Frame-Options: SAMEORIGIN
Authentication-Info: nextnonce="n1btFIY4yugNMTQ4ODY2NDY3NjUxMy4utKorhon/y+zSHie9V58=",qop="auth",rspauth="09ab5888ea71413b56dd724c13825a08",cnonce="MzdjOTMyZWQ2OTk5Y2Q0NmNlYzcxYzE2Zjg5NzdjZDE=",nc=00000001
Content-Type: application/json; charset=utf-8
Content-Length: 2108
Date: Sat, 04 Mar 2018 21:57:56 GMT

{
    "cache-health" : [
        "default",
        "HEALTHY",
        "___protobuf_metadata",
        "HEALTHY",
        "memcachedCache",
        "HEALTHY",
        "repl",
        "HEALTHY",
        "___script_cache",
        "HEALTHY"
    ],
    "cluster-health" : "HEALTHY",
    "cluster-name" : "clustered",
    "free-memory" : 1198983,
    "log-tail" : [
        "2018-03-04 16:22:28,138 INFO  [org.infinispan.server.endpoint] (MSC service thread 1-7) DGENDPT10001: MemcachedServer listening on 127.0.0.1:11211",
        "2018-03-04 16:22:28,146 INFO  [org.infinispan.server.endpoint] (MSC service thread 1-3) DGENDPT10000: REST starting",
        "2018-03-04 16:22:28,188 INFO  [org.jboss.as.clustering.infinispan] (MSC service thread 1-3) DGISPN0001: Started ___protobuf_metadata cache from clustered container",
        "2018-03-04 16:22:28,195 INFO  [org.jboss.as.clustering.infinispan] (MSC service thread 1-3) DGISPN0001: Started ___script_cache cache from clustered container",
        "2018-03-04 16:22:28,515 INFO  [org.jboss.as.clustering.infinispan] (MSC service thread 1-4) DGISPN0001: Started ___hotRodTopologyCache cache from clustered container",
        "2018-03-04 16:22:28,552 INFO  [org.infinispan.rest.NettyRestServer] (MSC service thread 1-3) ISPN012003: REST server starting, listening on 127.0.0.1:8080",
        "2018-03-04 16:22:28,552 INFO  [org.infinispan.server.endpoint] (MSC service thread 1-3) DGENDPT10002: REST mapped to /rest",
        "2018-03-04 16:22:28,613 INFO  [org.jboss.as] (Controller Boot Thread) WFLYSRV0060: Http management interface listening on http://127.0.0.1:9990/management",
        "2018-03-04 16:22:28,613 INFO  [org.jboss.as] (Controller Boot Thread) WFLYSRV0051: Admin console listening on http://127.0.0.1:9990",
        "2018-03-04 16:22:28,613 INFO  [org.jboss.as] (Controller Boot Thread) WFLYSRV0025: Data Grid 7.2.0 (WildFly Core 2.1.10.Final-redhat-1) started in 7608ms - Started 196 of 235 services (119 services are lazy, passive or on-demand)"
    ],
    "number-of-cpus" : 8,
    "number-of-nodes" : 1,
    "total-memory" : 1280000