
Chapter 24. Set Up JBoss Operations Network (JON)
24.1. About JBoss Operations Network (JON)
The JBoss Operations Network (JON) is JBoss' administration and management platform used to develop, test, deploy and monitor the application life cycle. JBoss Operations Network is JBoss' enterprise management solution and is recommended for the management of multiple Red Hat JBoss Data Grid instances across servers. JBoss Operations Network’s agent and auto discovery features facilitate monitoring the Cache Manager and Cache instances in JBoss Data Grid. JBoss Operations Network presents graphical views of key runtime parameters and statistics and allows administrators to set thresholds and be notified if usage exceeds or falls under the set thresholds.
In Red Hat JBoss Data Grid Remote Client-Server mode, statistics are enabled by default. While statistics are useful in assessing the status of JBoss Data Grid, they adversely affect performance and must be disabled if they are not required. In JBoss Data Grid Library mode, statistics are disabled by default and must be explicitly enabled when required.
To achieve full functionality of JBoss Operations Network library plugin for JBoss Data Grid’s Library mode, upgrade to JBoss Operations Network 3.3.0 with patch Update 04 or higher. For information on upgrading the JBoss Operations Network, see the Upgrading JBoss ON section in the JBoss Operations Network Installation Guide .
JBoss Data Grid will support the JON plugin until its end of life in June 2019.
24.2. Download JBoss Operations Network (JON)
24.2.1. Prerequisites for Installing JBoss Operations Network (JON)
In order to install JBoss Operations Network in Red Hat JBoss Data Grid, the following is required:
- A Linux, Windows, or Mac OSX operating system, and an x86_64, i686, or ia64 processor.
- Java 6 or higher is required to run both the JBoss Operations Network Server and the JBoss Operations Network Agent.
- Synchronized clocks on JBoss Operations Network Servers and Agents.
- An external database must be installed.
24.2.2. Download JBoss Operations Network
Use the following procedure to download Red Hat JBoss Operations Network (JON) from the Customer Portal:
Download JBoss Operations Network
- To access the Red Hat Customer Portal, navigate to https://access.redhat.com/home in a browser.
- Click Downloads.
- In the section labeled JBoss Development and Management , click Red Hat JBoss Data Grid.
- Enter the relevant credentials in the Red Hat Login and Password fields and click Log In.
- Select the appropriate version in the Version drop down menu list.
- Click the Download button next to the desired download file.
24.2.3. Remote JMX Port Values
A port value must be provided to allow Red Hat JBoss Data Grid instances to be located. The value itself can be any available port.
Provide unique (and available) remote JMX ports to run multiple JBoss Data Grid instances on a single machine. A locally running JBoss Operations Network agent can discover each instance using the remote port values.
24.2.4. Download JBoss Operations Network (JON) Plugin
Download Installation Files
- Open http://access.redhat.com in a web browser.
- Click Downloads in the menu across the top of the page.
-
Click Red Hat JBoss Operations Network in the list under
JBoss Development and Management. Enter your login information.
You are taken to the Software Downloads page.
Download the JBoss Operations Network Plugin
If you intend to use the JBoss Operations Network plugin for JBoss Data Grid, select
JBoss ON for Data Gridfrom either the Product drop-down box, or the menu on the left.If you intend to use the JBoss Operations Network plugin for JBoss Enterprise Web Server, select
JBoss ON for Web Serverfrom either the Product drop-down box, or the menu on the left.- Click the Red Hat JBoss Operations Network VERSION Base Distribution Download button.
- Repeat the steps to download the Data Grid Management Plugin Pack for JBoss ON VERSION
24.3. JBoss Operations Network Server Installation
The core of JBoss Operations Network is the server, which communicates with agents, maintains the inventory, manages resource settings, interacts with content providers, and provides a central management UI.
For more detailed information about configuring JBoss Operations Network, see the JBoss Operations Network Installation Guide .
24.4. JBoss Operations Network Agent
The JBoss Operations Network Agent is a standalone Java application. Only one agent is required per machine, regardless of how many resources you require the agent to manage.
The JBoss Operations Network Agent does not ship fully configured. Once the agent has been installed and configured it can be run as a Windows service from a console, or run as a daemon or init.d script in a UNIX environment.
A JBoss Operations Network Agent must be installed on each of the machines being monitored in order to collect data.
The JBoss Operations Network Agent is typically installed on the same machine on which Red Hat JBoss Data Grid is running, however where there are multiple machines an agent must be installed on each machine.
For more detailed information about configuring JBoss Operations Network agents, see the JBoss Operations Network Installation Guide .
24.5. JBoss Operations Network for Remote Client-Server Mode
24.5.1. JBoss Operations Network for Remote Client-Server Mode
In Red Hat JBoss Data Grid’s Remote Client-Server mode, the JBoss Operations Network plug-in is used to
- initiate and perform installation and configuration operations.
- monitor resources and their metrics.
In Remote Client-Server mode, the JBoss Operations Network plug-in uses JBoss Enterprise Application Platform’s management protocol to obtain metrics and perform operations on the JBoss Data Grid server.
24.5.2. Installing the JBoss Operations Network Plug-in (Remote Client-Server Mode)
The following procedure details how to install the JBoss Operations Network plug-ins for Red Hat JBoss Data Grid’s Remote Client-Server mode.
Install the plug-ins
- Copy the JBoss Data Grid server rhq plug-in to $JON_SERVER_HOME/plugins .
- Copy the JBoss Enterprise Application Platform plug-in to $JON_SERVER_HOME/plugins .
The server will automatically discover plug-ins here and deploy them. The plug-ins will be removed from the plug-ins directory after successful deployment.
Obtain plug-ins
Obtain all available plug-ins from the JBoss Operations Network server. To do this, type the following into the agent’s console:
plugins update
List installed plug-ins
Ensure the JBoss Enterprise Application Platform plug-in and the JBoss Data Grid server rhq plug-in are installed correctly using the following:
plugins info
JBoss Operation Network can now discover running JBoss Data Grid servers.
24.6. JBoss Operations Network Remote-Client Server Plugin
24.6.1. JBoss Operations Network Plugin Metrics
Table 24.1. JBoss Operations Network Traits for the Cache Container (Cache Manager)
| Trait Name | Display Name | Description |
|---|---|---|
| cache-manager-status | Cache Container Status | The current runtime status of a cache container. |
| cluster-name | Cluster Name | The name of the cluster. |
| members | Cluster Members | The names of the members of the cluster. |
| coordinator-address | Coordinator Address | The coordinator node’s address. |
| local-address | Local Address | The local node’s address. |
| version | Version | The cache manager version. |
| defined-cache-names | Defined Cache Names | The caches that have been defined for this manager. |
Table 24.2. JBoss Operations Network Metrics for the Cache Container (Cache Manager)
| Metric Name | Display Name | Description |
|---|---|---|
| cluster-size | Cluster Size | How many members are in the cluster. |
| defined-cache-count | Defined Cache Count | How many caches that have been defined for this manager. |
| running-cache-count | Running Cache Count | How many caches are running under this manager. |
| created-cache-count | Created Cache Count | How many caches have actually been created under this manager. |
Table 24.3. JBoss Operations Network Traits for the Cache
| Trait Name | Display Name | Description |
|---|---|---|
| cache-status | Cache Status | The current runtime status of a cache. |
| cache-name | Cache Name | The current name of the cache. |
| version | Version | The cache version. |
Table 24.4. JBoss Operations Network Metrics for the Cache
| Metric Name | Display Name | Description |
|---|---|---|
| cache-status | Cache Status | The current runtime status of a cache. |
| number-of-locks-available | [LockManager] Number of locks available | The number of exclusive locks that are currently available. |
| concurrency-level | [LockManager] Concurrency level | The LockManager’s configured concurrency level. |
| average-read-time | [Statistics] Average read time | Average number of milliseconds required for a read operation on the cache to complete. |
| hit-ratio | [Statistics] Hit ratio | The result (in percentage) when the number of hits (successful attempts) is divided by the total number of attempts. |
| elapsed-time | [Statistics] Seconds since cache started | The number of seconds since the cache started. |
| read-write-ratio | [Statistics] Read/write ratio | The read/write ratio (in percentage) for the cache. |
| average-write-time | [Statistics] Average write time | Average number of milliseconds a write operation on a cache requires to complete. |
| hits | [Statistics] Number of cache hits | Number of cache hits. |
| evictions | [Statistics] Number of cache evictions | Number of cache eviction operations. |
| remove-misses | [Statistics] Number of cache removal misses | Number of cache removals where the key was not found. |
| time-since-reset | [Statistics] Seconds since cache statistics were reset | Number of seconds since the last cache statistics reset. |
| number-of-entries | [Statistics] Number of current cache entries | Number of entries currently in the cache. |
| stores | [Statistics] Number of cache puts | Number of cache put operations |
| remove-hits | [Statistics] Number of cache removal hits | Number of cache removal operation hits. |
| misses | [Statistics] Number of cache misses | Number of cache misses. |
| success-ratio | [RpcManager] Successful replication ratio | Successful replications as a ratio of total replications in numeric double format. |
| replication-count | [RpcManager] Number of successful replications | Number of successful replications |
| replication-failures | [RpcManager] Number of failed replications | Number of failed replications |
| average-replication-time | [RpcManager] Average time spent in the transport layer | The average time (in milliseconds) spent in the transport layer. |
| commits | [Transactions] Commits | Number of transaction commits performed since the last reset. |
| prepares | [Transactions] Prepares | Number of transaction prepares performed since the last reset. |
| rollbacks | [Transactions] Rollbacks | Number of transaction rollbacks performed since the last reset. |
| invalidations | [Invalidation] Number of invalidations | Number of invalidations. |
| passivations | [Passivation] Number of cache passivations | Number of passivation events. |
| activations | [Activations] Number of cache entries activated | Number of activation events. |
| cache-loader-loads | [Activation] Number of cache store loads | Number of entries loaded from the cache store. |
| cache-loader-misses | [Activation] Number of cache store misses | Number of entries that did not exist in the cache store. |
| cache-loader-stores | [CacheStore] Number of cache store stores | Number of entries stored in the cache stores. |
Gathering of some of these statistics is disabled by default.
JBoss Operations Network Metrics for Connectors
The metrics provided by the JBoss Operations Network (JON) plugin for Red Hat JBoss Data Grid are for REST and Hot Rod endpoints only. For the REST protocol, the data must be taken from the Web subsystem metrics. For details about each of these endpoints, see the Getting Started Guide.
Table 24.5. JBoss Operations Network Metrics for the Connectors
| Metric Name | Display Name | Description |
|---|---|---|
| bytesRead | Bytes Read | Number of bytes read. |
| bytesWritten | Bytes Written | Number of bytes written. |
Gathering of these statistics is disabled by default.
24.6.2. JBoss Operations Network Plugin Operations
Table 24.6. JBoss ON Plugin Operations for the Cache
| Operation Name | Description |
|---|---|
| Start Cache | Starts the cache. |
| Stop Cache | Stops the cache. |
| Clear Cache | Clears the cache contents. |
| Reset Statistics | Resets statistics gathered by the cache. |
| Reset Activation Statistics | Resets activation statistics gathered by the cache. |
| Reset Invalidation Statistics | Resets invalidations statistics gathered by the cache. |
| Reset Passivation Statistics | Resets passivation statistics gathered by the cache. |
| Reset Rpc Statistics | Resets replication statistics gathered by the cache. |
| Remove Cache | Removes the given cache from the cache-container. |
| Record Known Global Keyset | Records the global known keyset to a well-known key for retrieval by the upgrade process. |
| Synchronize Data | Synchronizes data from the old cluster to this using the specified migrator. |
| Disconnect Source | Disconnects the target cluster from the source cluster according to the specified migrator. |
JBoss Operations Network Plugin Operations for the Cache Backups
The cache backups used for these operations are configured using cross-datacenter replication. In the JBoss Operations Network (JON) User Interface, each cache backup is the child of a cache. For more information about cross-datacenter replication, see Set Up Cross-Datacenter Replication.
Table 24.7. JBoss Operations Network Plugin Operations for the Cache Backups
| Operation Name | Description |
|---|---|
| status | Display the site status. |
| bring-site-online | Brings the site online. |
| take-site-offline | Takes the site offline. |
Cache (Transactions)
Red Hat JBoss Data Grid does not support using Transactions in Remote Client-Server mode. As a result, none of the endpoints can use transactions.
24.6.3. JBoss Operations Network Plugin Attributes
Table 24.8. JBoss ON Plugin Attributes for the Cache (Transport)
| Attribute Name | Type | Description |
|---|---|---|
| cluster | string | The name of the group communication cluster. |
| executor | string | The executor used for the transport. |
| lock-timeout | long |
The timeout period for locks on the transport. The default value is |
| machine | string | A machine identifier for the transport. |
| rack | string | A rack identifier for the transport. |
| site | string | A site identifier for the transport. |
| stack | string | The JGroups stack used for the transport. |
24.6.4. Create a New Cache Using JBoss Operations Network (JON)
Use the following steps to create a new cache using JBoss Operations Network (JON) for Remote Client-Server mode.
Creating a new cache in Remote Client-Server mode
Log into the JBoss Operations Network Console.
- From the JBoss Operations Network console, click Inventory.
- Select Servers from the Resources list on the left of the console.
Select the specific Red Hat JBoss Data Grid server from the servers list.
- Below the server name, click infinispan and then Cache Containers.
Select the desired cache container that will be parent for the newly created cache.
- Right-click the selected cache container. For example, clustered.
- In the context menu, navigate to Create Child and select Cache.
Create a new cache in the resource create wizard.
- Enter the new cache name and click Next.
- Set the cache attributes in the Deployment Options and click Finish.
Refresh the view of caches in order to see newly added resource. It may take several minutes for the Resource to show up in the Inventory.
24.7. JBoss Operations Network for Library Mode
24.7.1. JBoss Operations Network for Library Mode
In Red Hat JBoss Data Grid’s Library mode, the JBoss Operations Network plug-in is used to
- initiate and perform installation and configuration operations.
- monitor resources and their metrics.
In Library mode, the JBoss Operations Network plug-in uses JMX to obtain metrics and perform operations on an application using the JBoss Data Grid library.
24.7.2. Installing the JBoss Operations Network Plug-in (Library Mode)
Use the following procedure to install the JBoss Operations Network plug-in for Red Hat JBoss Data Grid’s Library mode.
Install JBoss Operations Network Library Mode Plug-in
Open the JBoss Operations Network Console
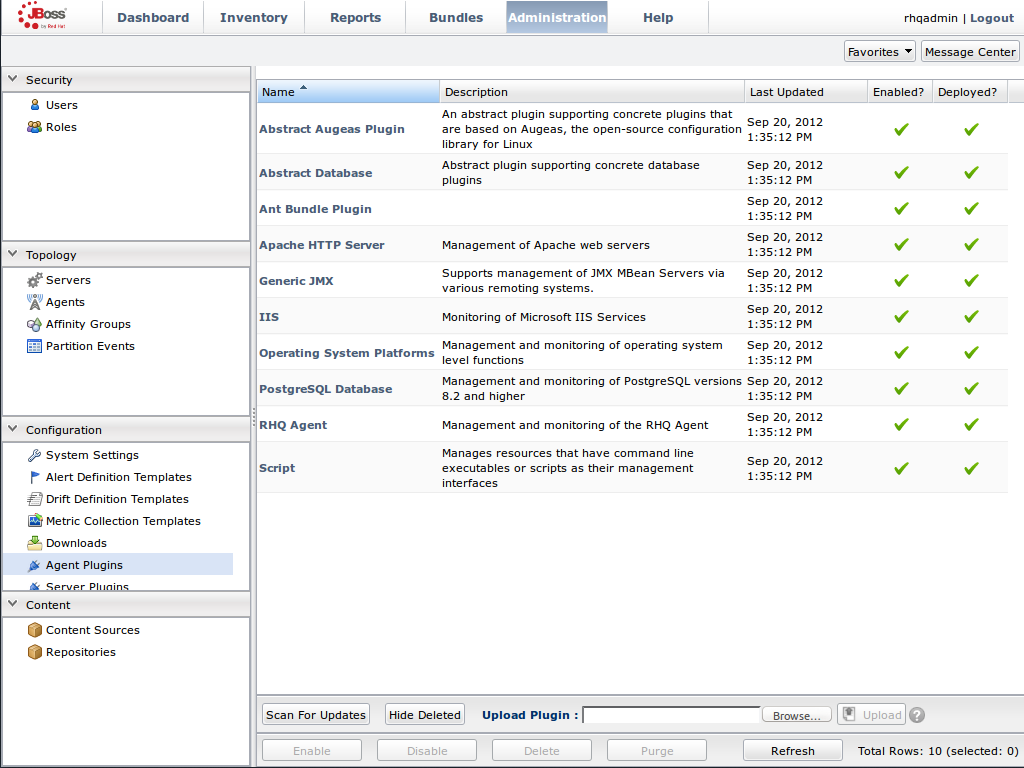
- From the JBoss Operations Network console, select Administration.
- Select Agent Plugins from the Configuration options on the left side of the console.
Figure 24.1. JBoss Operations Network Console for JBoss Data Grid
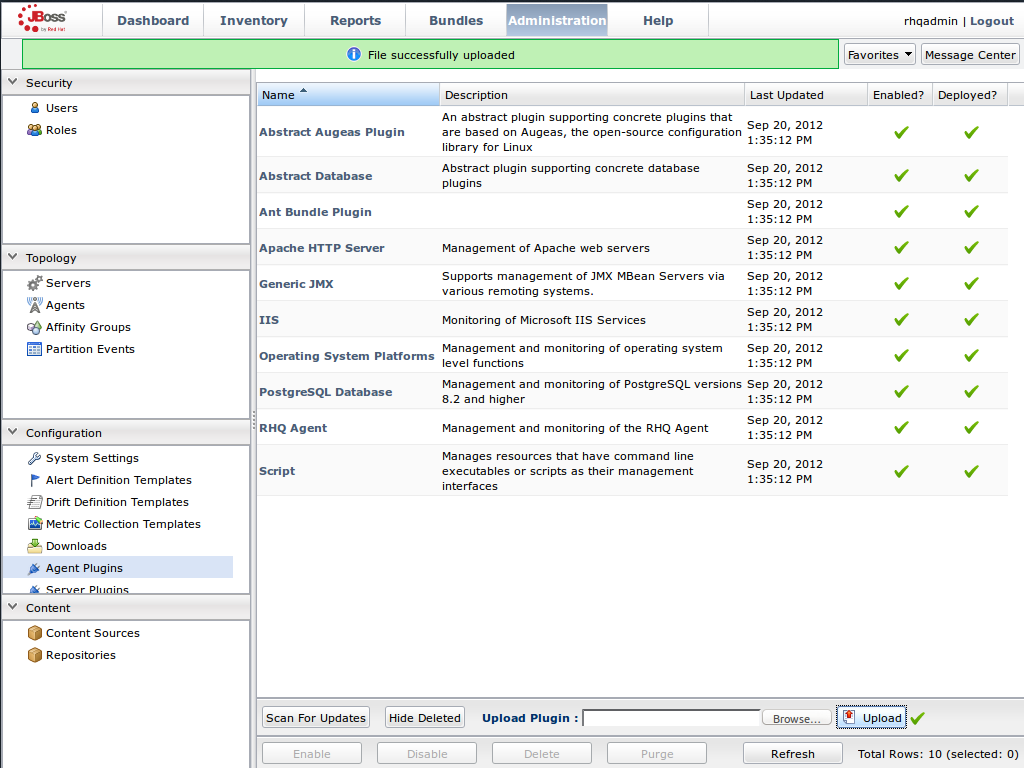
Upload the Library Mode Plug-in
- Click Browse, locate the InfinispanPlugin on your local file system.
- Click Upload to add the plug-in to the JBoss Operations Network Server.
Figure 24.2. Upload the InfinispanPlugin.
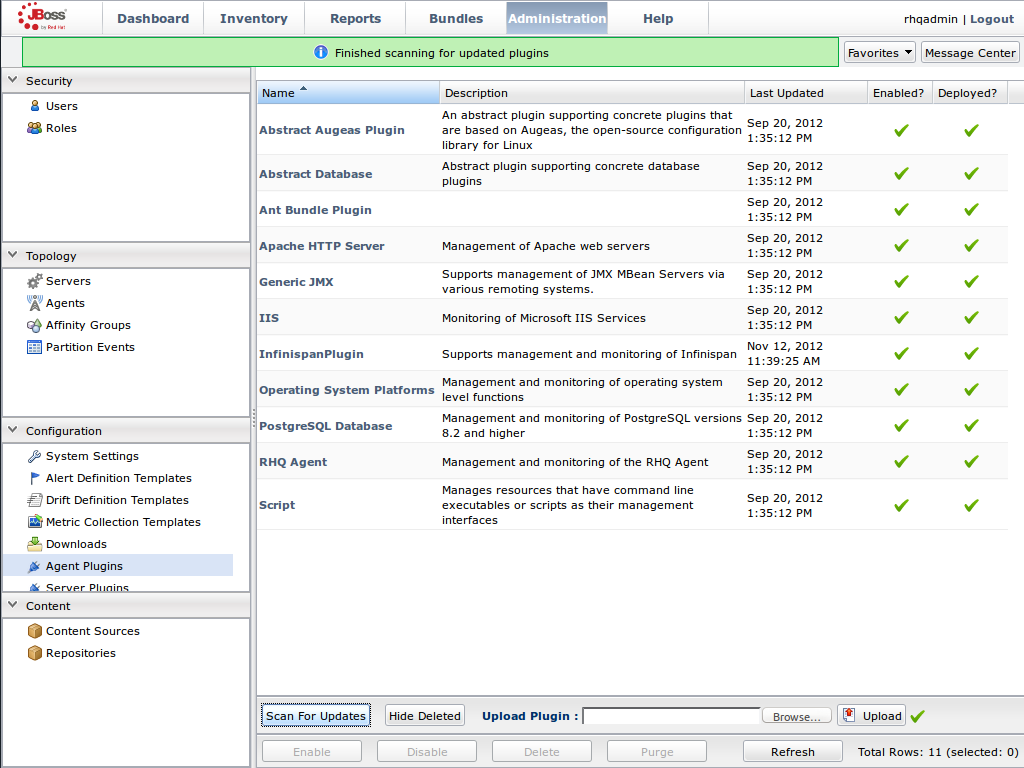
Scan for Updates
- Once the file has successfully uploaded, click Scan For Updates at the bottom of the screen.
- The InfinispanPlugin will now appear in the list of installed plug-ins.
Figure 24.3. Scan for Updated Plug-ins.
24.7.3. Monitoring of JBoss Data Grid Instances in Library Mode
24.7.3.1. Prerequisites
The following is a list of common prerequisites for Monitor an Application Deployed in Standalone Mode, Monitor an Application Deployed in Domain Mode, and Manually Adding JBoss Data Grid Instances in Library Mode.
- A correctly configured instance of JBoss Operations Network (JON) 3.2.0 with patch Update 02 or higher version.
- A running instance of JON Agent on the server where the application will run. For more information, see JBoss Operations Network Agent.
-
An operational instance of the RHQ agent with a full JDK. Ensure that the agent has access to the tools.jar file from the JDK in particular. In the JON agent’s environment file (bin/rhq-env.sh ), set the value of the
RHQ_AGENT_JAVA_HOMEproperty to point to a full JDK home. - The RHQ agent must have been initiated using the same user as the JBoss Enterprise Application Platform instance. As an example, running the JON agent as a user with root privileges and the JBoss Enterprise Application Platform process under a different user does not work as expected and must be avoided.
- An installed JON plugin for JBoss Data GridLibrary Mode. For more information, see Installing the JBoss Operations Network Plug-in (Library Mode)
- Generic JMX plugin from JBoss Operation Networks 3.2.0 with patch Update 02 or better version in use.
- A custom application using Red Hat JBoss Data Grid’s Library mode with enabled JMX statistics for library mode caches in order to make statistics and monitoring working. For details how to enable JMX statistics for cache instances, see Enable JMX for Cache Instances and to enable JMX for cache managers see Enable JMX for CacheManagers.
- The Java Virtual Machine (JVM) must be configured to expose the JMX MBean Server. For the Oracle/Sun JDK, see http://docs.oracle.com/javase/1.5.0/docs/guide/management/agent.html
- A correctly added and configured management user for JBoss Enterprise Application Platform.
24.7.3.2. Manually Adding JBoss Data Grid Instances in Library Mode
To add Red Hat JBoss Data Grid instances to JBoss Operations Network manually, use the following procedure in the JBoss Operations Network interface.
Add JBoss Data Grid Instances in Library Mode
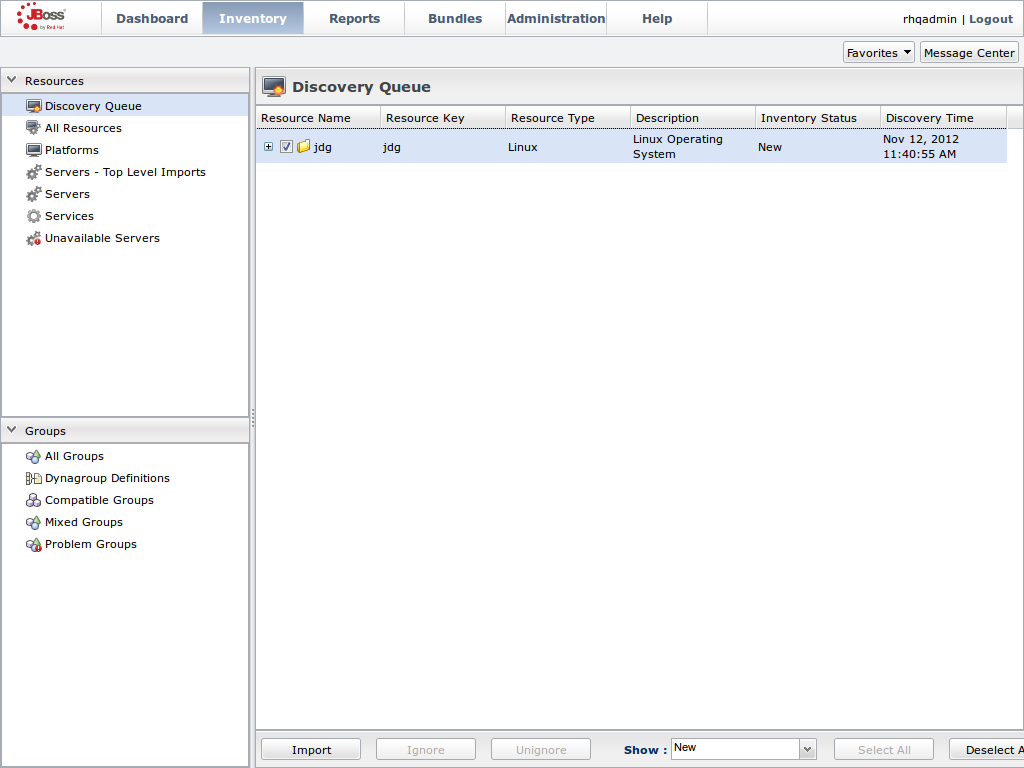
Import the Platform
- Navigate to the Inventory and select Discovery Queue from the Resources list on the left of the console.
- Select the platform on which the application is running and click Import at the bottom of the screen.
Figure 24.4. Import the Platform from the menu:Discovery Queue[].
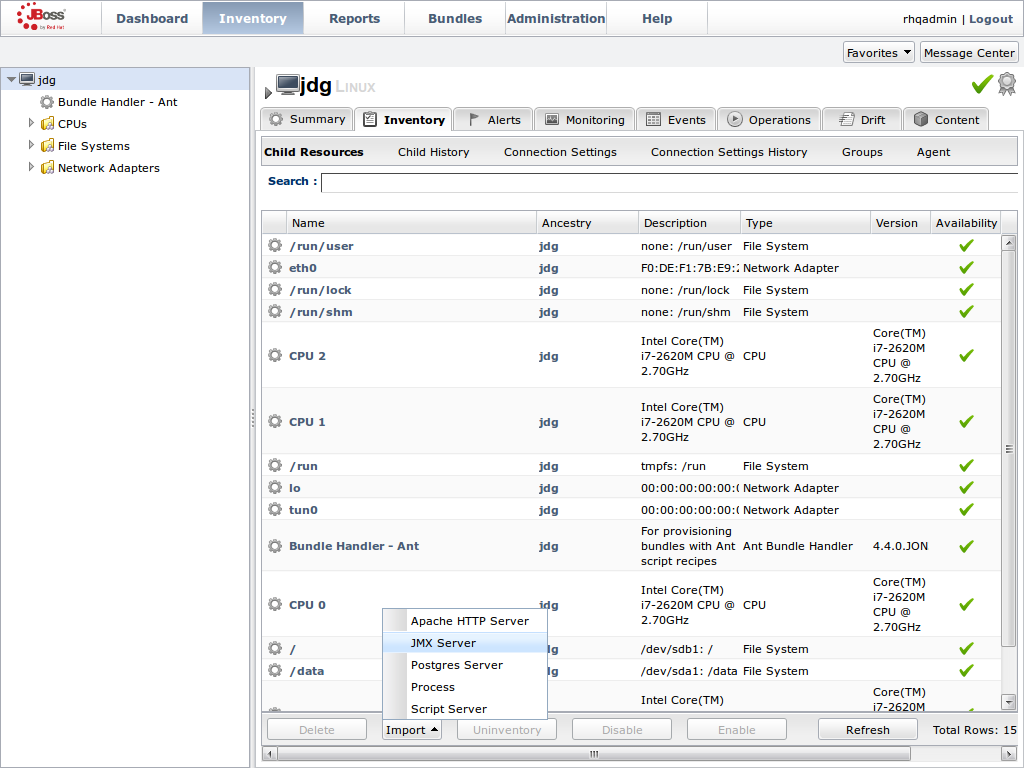
Access the Servers on the Platform
-
The
jdgPlatform now appears in the Platforms list. - Click on the Platform to access the servers that are running on it.
Figure 24.5. Open the
jdgPlatform to view the list of servers.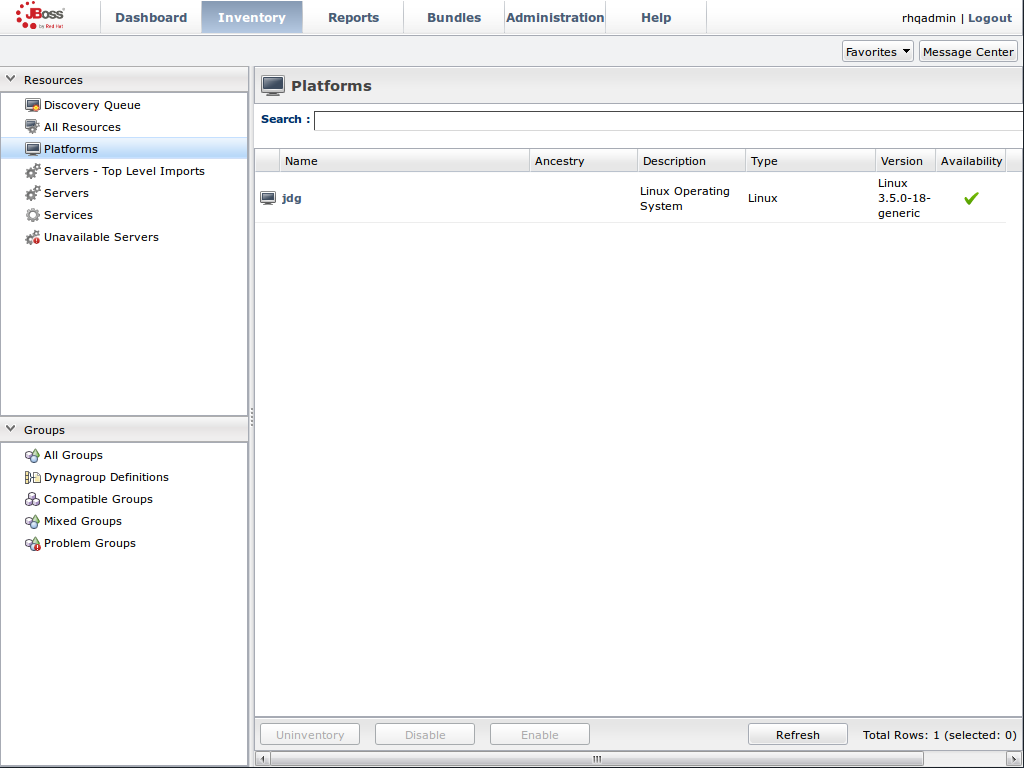
-
The
Import the JMX Server
- From the Inventory tab, select Child Resources.
- Click the Import button at the bottom of the screen and select the JMX Server** option from the list.
Figure 24.6. Import the JMX Server
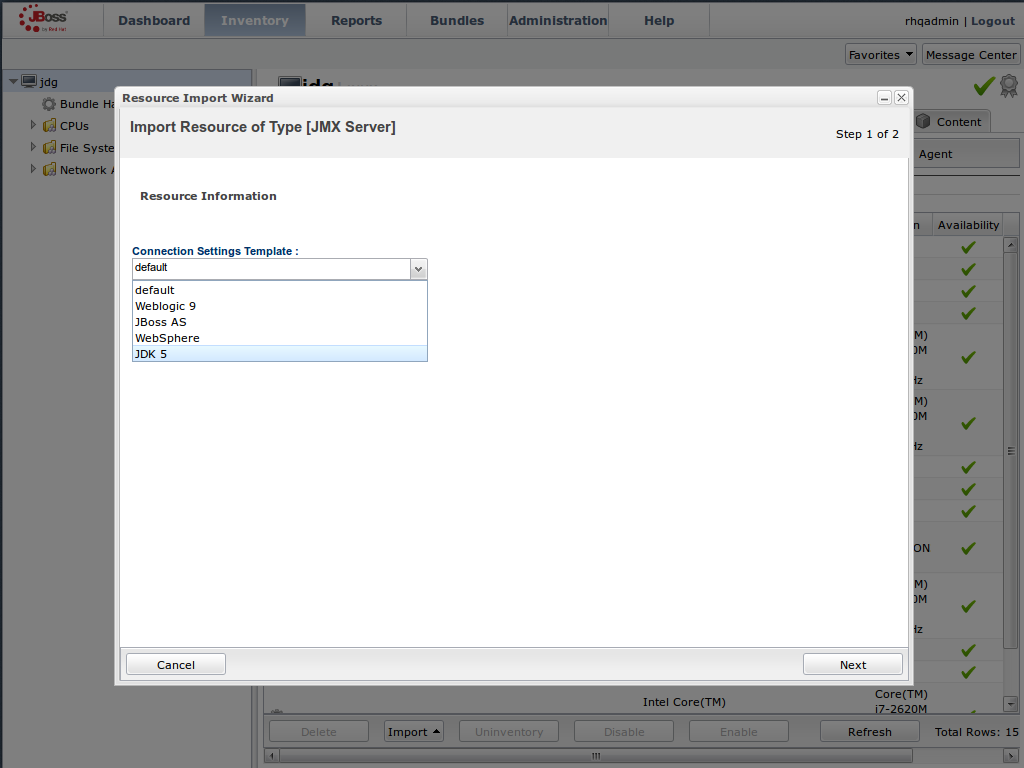
Enable JDK Connection Settings
- In the Resource Import Wizard window, specify JDK 8 from the list of Connection Settings Template options.
Figure 24.7. Select the JDK 5 Template.
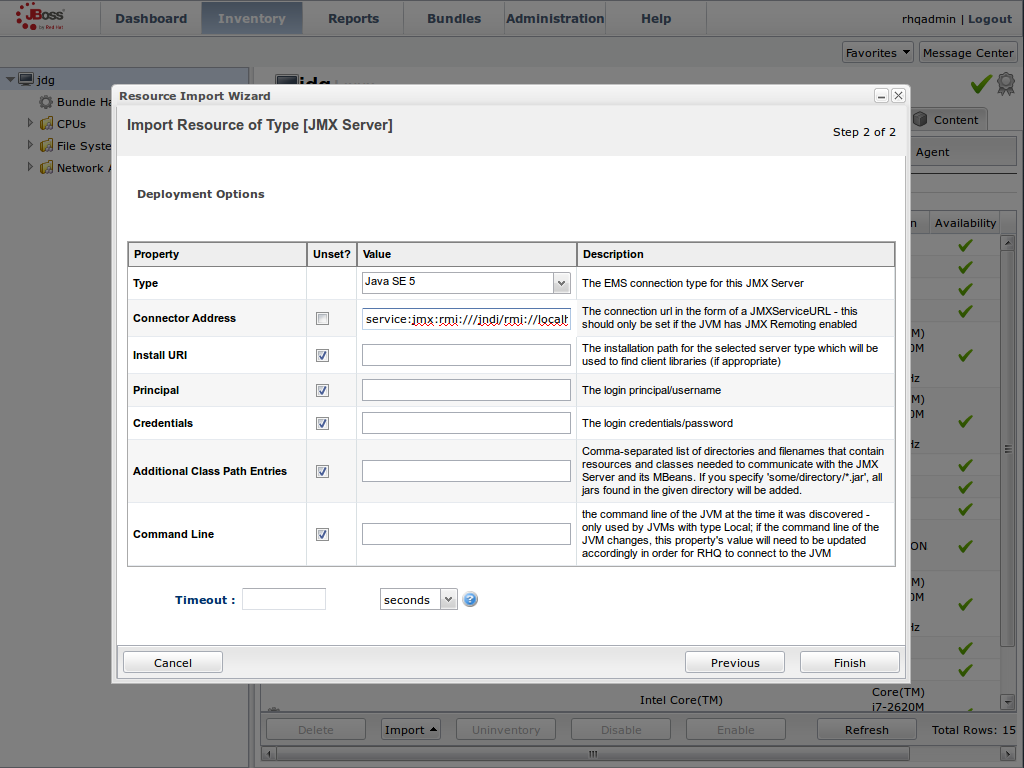
Modify the Connector Address
- In the Deployment Options menu, modify the supplied Connector Address with the hostname and JMX port of the process containing the Infinispan Library.
Enter the JMX connector address of the new JBoss Data Grid instance you want to monitor. For example:
Connector Address:
service:jmx:rmi://127.0.0.1/jndi/rmi://127.0.0.1:7997/jmxrmi
NoteThe connector address varies depending on the host and the JMX port assigned to the new instance. In this case, instances require the following system properties at start up:
-Dcom.sun.management.jmxremote.port=7997 -Dcom.sun.management.jmxremote.ssl=false -Dcom.sun.management.jmxremote.authenticate=false
- Specify the Principal and Credentials information if required.
- Click Finish.
Figure 24.8. Modify the values in the Deployment Options screen.
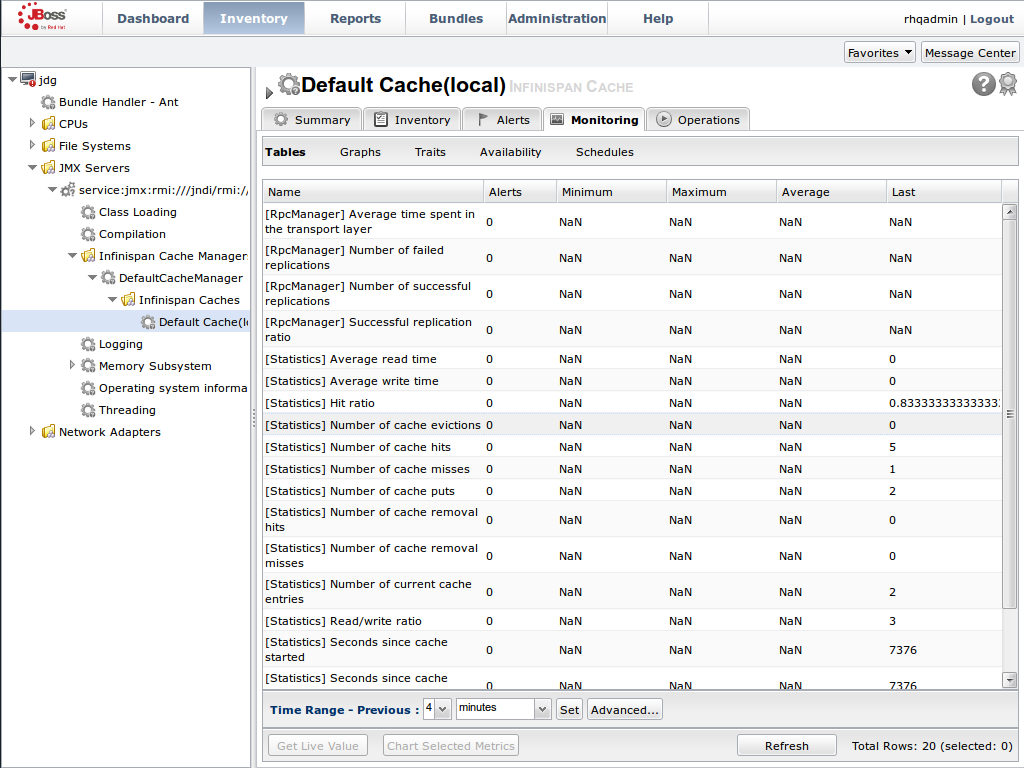
View Cache Statistics and Operations
- Click Refresh to refresh the list of servers.
- The JMX Servers tree in the panel on the left side of the screen contains the Infinispan Cache Managers node, which contains the available cache managers. The available cache managers contain the available caches.
- Select a cache from the available caches to view metrics.
- Select the Monitoring tab.
- The Tables view shows statistics and metrics.
- The Operations tab provides access to the various operations that can be performed on the services.
Figure 24.9. Metrics and operational data relayed through JMX is now available in the JBoss Operations Network console.
24.7.3.3. Monitor Custom Applications Using Library Mode Deployed On JBoss Enterprise Application Platform
24.7.3.3.1. Monitor an Application Deployed in Standalone Mode
Use the following instructions to monitor an application deployed in JBoss Enterprise Application Platform using its standalone mode:
Monitor an Application Deployed in Standalone Mode
Start the JBoss Enterprise Application Platform Instance
Start the JBoss Enterprise Application Platform instance as follows:
Enter the following command at the command line or change standalone configuration file (/bin/standalone.conf ) respectively:
JAVA_OPTS="$JAVA_OPTS -Dorg.rhq.resourceKey=MyEAP"
Start the JBoss Enterprise Application Platform instance in standalone mode as follows:
$JBOSS_HOME/bin/standalone.sh
Deploy the Red Hat JBoss Data Grid Application
Deploy the
WARfile that contains the JBoss Data Grid Library mode application withglobalJmxStatisticsandjmxStatisticsenabled.Run JBoss Operations Network (JON) Discovery
Run the
discovery --fullcommand in the JBoss Operations Network (JON) agent.Locate Application Server Process
In the JBoss Operations Network (JON) web interface, the JBoss Enterprise Application Platform process is listed as a JMX server.
Import the Process Into Inventory
Import the process into the JBoss Operations Network (JON) inventory.
Optional: Run Discovery Again
If required, run the
discovery --fullcommand again to discover the new resources.
24.7.3.3.2. Monitor an Application Deployed in Domain Mode
Use the following instructions to monitor an application deployed in JBoss Enterprise Application Platform 6 using its domain mode:
Monitor an Application Deployed in Domain Mode
Edit the Host Configuration
Edit the domain/configuration/host.xml file to replace the
serverelement with the following configuration:<servers> <server name="server-one" group="main-server-group"> <jvm name="default"> <jvm-options> <option value="-Dorg.rhq.resourceKey=EAP1"/> </jvm-options> </jvm> </server> <server name="server-two" group="main-server-group" auto-start="true"> <socket-bindings port-offset="150"/> <jvm name="default"> <jvm-options> <option value="-Dorg.rhq.resourceKey=EAP2"/> </jvm-options> </jvm> </server> </servers>
Start JBoss Enterprise Application Platform 6
Start JBoss Enterprise Application Platform 6 in domain mode:
$JBOSS_HOME/bin/domain.sh
Deploy the Red Hat JBoss Data Grid Application
Deploy the
WARfile that contains the JBoss Data Grid Library mode application withglobalJmxStatisticsandjmxStatisticsenabled.Run Discovery in JBoss Operations Network (JON)
If required, run the
discovery --fullcommand for the JBoss Operations Network (JON) agent to discover the new resources.
24.8. JBoss Operations Network Plug-in Quickstart
For testing or demonstrative purposes with a single JBoss Operations Network agent, upload the plug-in to the server then type "plugins update" at the agent command line to force a retrieval of the latest plugins from the server.
24.9. Other Management Tools and Operations
24.9.1. Other Management Tools and Operations
Managing Red Hat JBoss Data Grid instances requires exposing significant amounts of relevant statistical information. This information allows administrators to get a clear view of each JBoss Data Grid node’s state. A single installation can comprise of tens or hundreds of JBoss Data Grid nodes and it is important to provide this information in a clear and concise manner. JBoss Operations Network is one example of a tool that provides runtime visibility. Other tools, such as JConsole can be used where JMX is enabled.
24.9.2. Accessing Data via URLs
Caches that have been configured with a REST interface have access to Red Hat JBoss Data Grid using RESTful HTTP access.
The RESTful service only requires a HTTP client library, eliminating the need for tightly coupled client libraries and bindings. For more information about how to retrieve data using the REST interface, refer to the JBoss Data Grid Developer Guide .
HTTP put() and post() methods place data in the cache, and the URL used determines the cache name and key(s) used. The data is the value placed into the cache, and is placed in the body of the request.
A Content-Type header must be set for these methods. GET and HEAD methods are used for data retrieval while other headers control cache settings and behavior.
It is not possible to have conflicting server modules interact with the data grid. Caches must be configured with a compatible interface in order to have access to JBoss Data Grid.
24.9.3. Limitations of Map Methods
Specific Map methods, such as size(), values(), keySet() and entrySet(), can be used with certain limitations with Red Hat JBoss Data Grid as they are unreliable. These methods do not acquire locks (global or local) and concurrent modification, additions and removals are excluded from consideration in these calls.
The listed methods have a significant impact on performance. As a result, it is recommended that these methods are used for informational and debugging purposes only.
Performance Concerns
In JBoss Data Grid 7.2 the map methods size(), values(), keySet(), and entrySet() include entries in the cache loader by default. The cache loader in use will determine the performance of these commands; for instance, when using a database these methods will run a complete scan of the table where data is stored, which may result in slower processing. To not load entries from the cache loader, and avoid any potential performance hit, use Cache.getAdvancedCache().withFlags(Flag.SKIP_CACHE_LOAD) before executing the desired method.
Understanding the size() Method (Embedded Caches)
In JBoss Data Grid 7.2 the Cache.size() method provides a count of all elements in both this cache and cache loader across the entire cluster. When using a loader or remote entries, only a subset of entries is held in memory at any given time to prevent possible memory issues, and the loading of all entries may be slow.
In this mode of operation, the result returned by the size() method is affected by the flags org.infinispan.context.Flag#CACHE_MODE_LOCAL, to force it to return the number of entries present on the local node, and org.infinispan.context.Flag#SKIP_CACHE_LOAD, to ignore any passivated entries. Either of these flags may be used to increase performance of this method, at the cost of not returning a count of all elements across the entire cluster.
Understanding the size() Method (Remote Caches)
In JBoss Data Grid 7.2 the Hot Rod protocol contain a dedicated SIZE operation, and the clients use this operation to calculate the size of all entries.