
Chapter 26. Red Hat JBoss Data Grid Administration Console
26.1. About JBoss Data Grid Administration Console
The Red Hat JBoss Data Grid Administration Console allows administrators to monitor caches and JBoss Data Grid clusters, while providing a web interface for making dynamic changes to caches, cache-containers, and cluster nodes.
26.2. Red Hat JBoss Data Grid Administration Console Prerequisites
The Red Hat JBoss Data Grid Administration Console is only available in Remote Client-Server Mode.
26.3. Red Hat JBoss Data Grid Administation Console Getting Started
26.3.1. Red Hat JBoss Data Grid Administration Console Getting Started
The Administration Console is started automatically when JBoss Data Grid is running in Remote Client-Server Mode. A management user must be added to the server instance, which will then be used to access the web console.
26.3.2. Adding Management User
In order to use the JBoss Data Grid Administration Console, a new management user must be created. To add a new user, execute the add-user.sh utility script within the bin folder of your JBoss Data Grid Server installation and enter the requested information.
The following procedure outlines the steps to add a new management user:
Adding a Management User
Run the add-user script within the bin folder as follows:
./add-user.sh
-
Select the option for the type of user to be added. For management user, select option
a. - Set the Username and password as per the listed recommendations.
Enter the name of the group or groups in which the user has to be added. Leave blank for no group.
NoteSee the Download and Install JBoss Data Grid section in the Red Hat JBoss Data Grid Getting Started Guide for download and installation details.
Confirm if you need the user to be used for Application Server process connection.
NoteBefore proceeding, make sure $JBOSS_HOME is not set to a different installation. Otherwise, you may get unpredictable results.
26.3.3. Logging in the JBoss Data Grid Administration Console
Once the JBoss Data Grid server is running, in either domain or standalone mode, the JBoss Data Grid Administration Console may be accessed at the following login page:
http://${jboss.bind.address.management}:9990/console/index.htmlFigure 26.1. JBoss Data Grid Administration Console Login Screen
Enter the user credentials to log in. After logging in, the cache container view is displayed.
26.4. Dashboard View
26.4.1. Dashboard View
The Dashboard view is split into 3 tabs namely:
- Caches
- Clusters
- Status Events
The Clusters and Status Events tabs are not available when running JBoss Data Grid in standalone non-clustered mode.
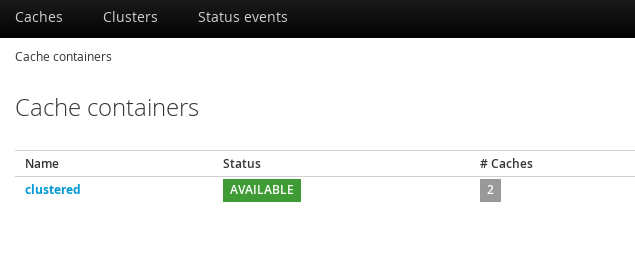
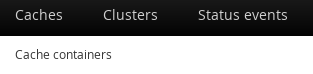
26.4.2. Cache Containers View
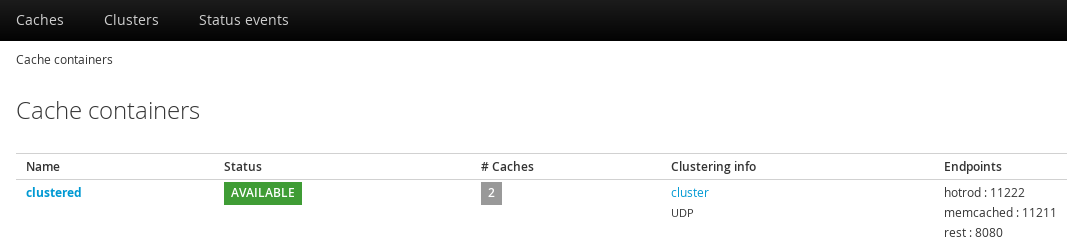
The first default view after logging in is the Cache Container list. A Cache Container is the primary mechanism for treating a cache instance and is used as a starting point for using a cache itself.
Cache centric view presents the list of configured caches. It is used for viewing and adding caches to clusters, adding and adjusting new cache configurations, adding and configuring endpoints and other cache related administrative tasks.
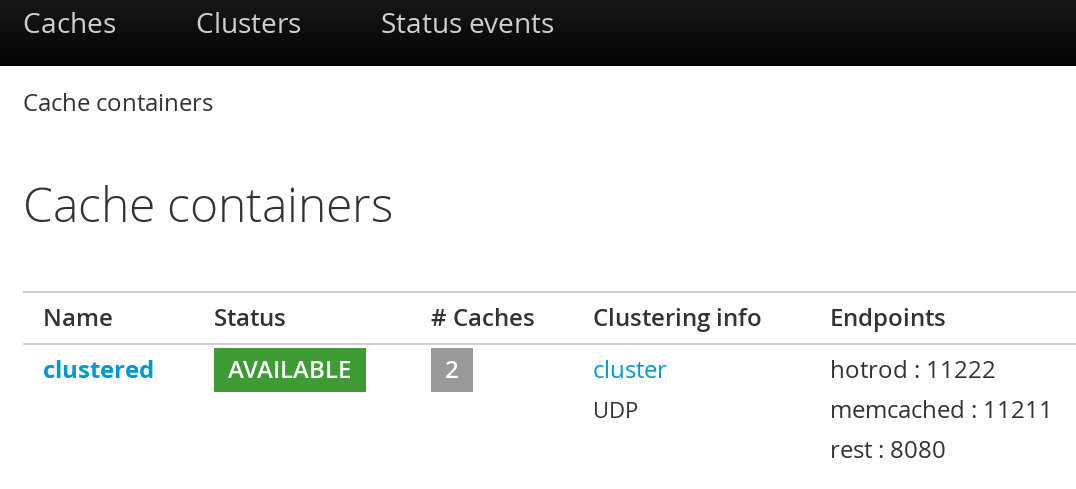
Figure 26.2. Cache Containers View
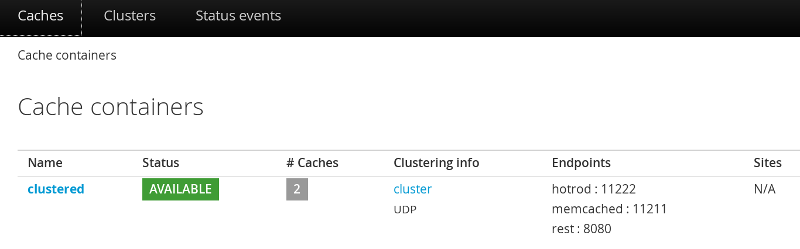
In this instance, there is one cache container with the name clustered with two caches deployed on the cluster group with UDP transport and three Endpoints attached to it. There are no remote sites configured for this cache container.
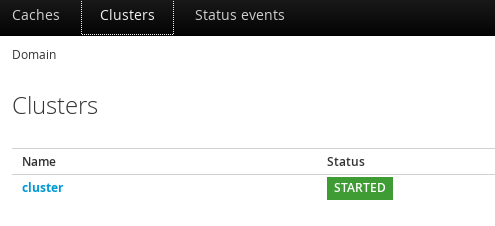
26.4.3. Clusters View
The Cluster tab presents the summary of the clusters along with the current status, number of hosts and number of nodes.
Figure 26.3. Clusters View
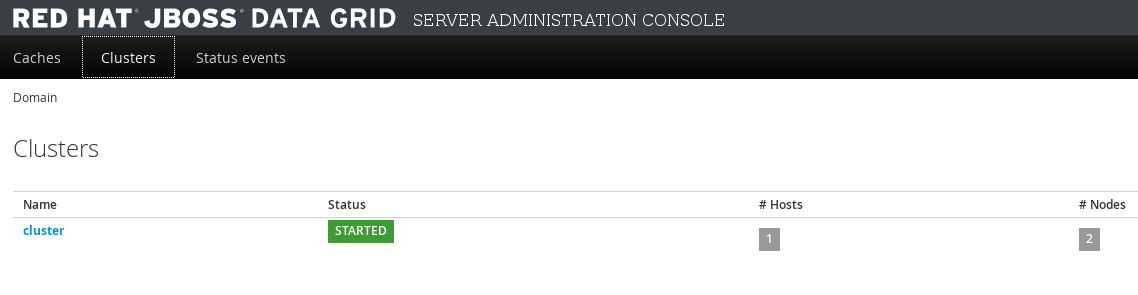
The Cluster view will not appear when the server is running in standalone non-clustered mode.
26.4.4. Status Events View
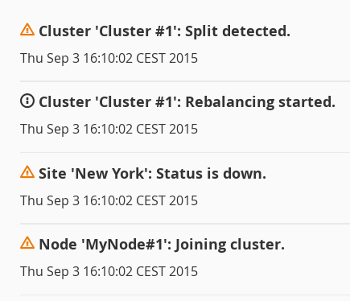
The JBoss Data Grid Administration Console displays the cluster wide events such as local rebalancing, cluster start and stop, cluster-split and cluster-merge events in a consolidated section. To view the detailed status events, navigate to the Status Events tab from the Dashboard.
Figure 26.4. Status Events View
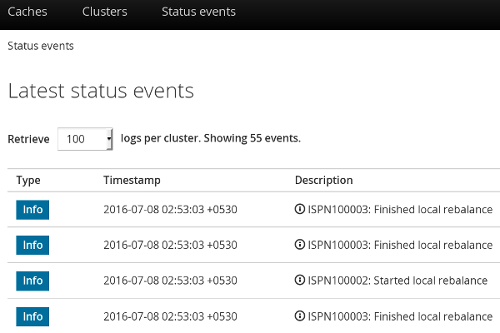
The status events are displayed with the associated timestamp and the event description.
The Status Events view will not appear when the server is running in standalone non-clustered mode.
26.5. Cache Administration
26.5.1. Adding a New Cache
To add a new cache, follow these steps:
Adding a New Cache
In the Cache Containers view, click on the name of the cache container.
Figure 26.5. Cache Containers View
The Caches view is displayed listing all the configured caches. Click Add Cache to add and configure a new cache. The new cache creation window is opened.
Figure 26.6. Add Cache
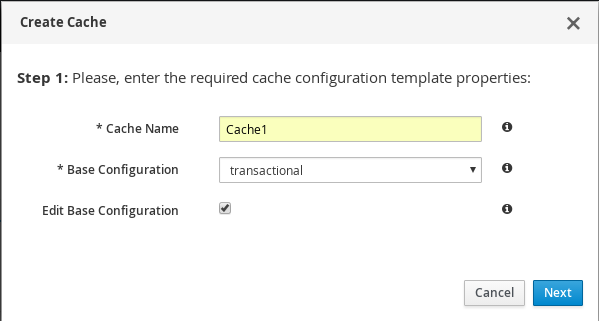
Enter the new cache name, select the base configuration template from the drop-down menu, check the Edit button, and click Next. If the Edit button is not selected then the cache will be immediately created using the selected template.
Figure 26.7. Cache Properties
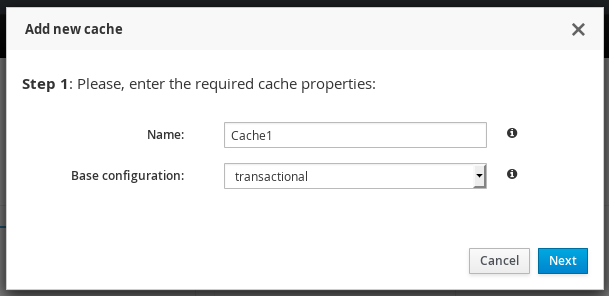
The cache configuration screen is displayed. Enter the cache parameters and click Create.
Figure 26.8. Cache Configuration
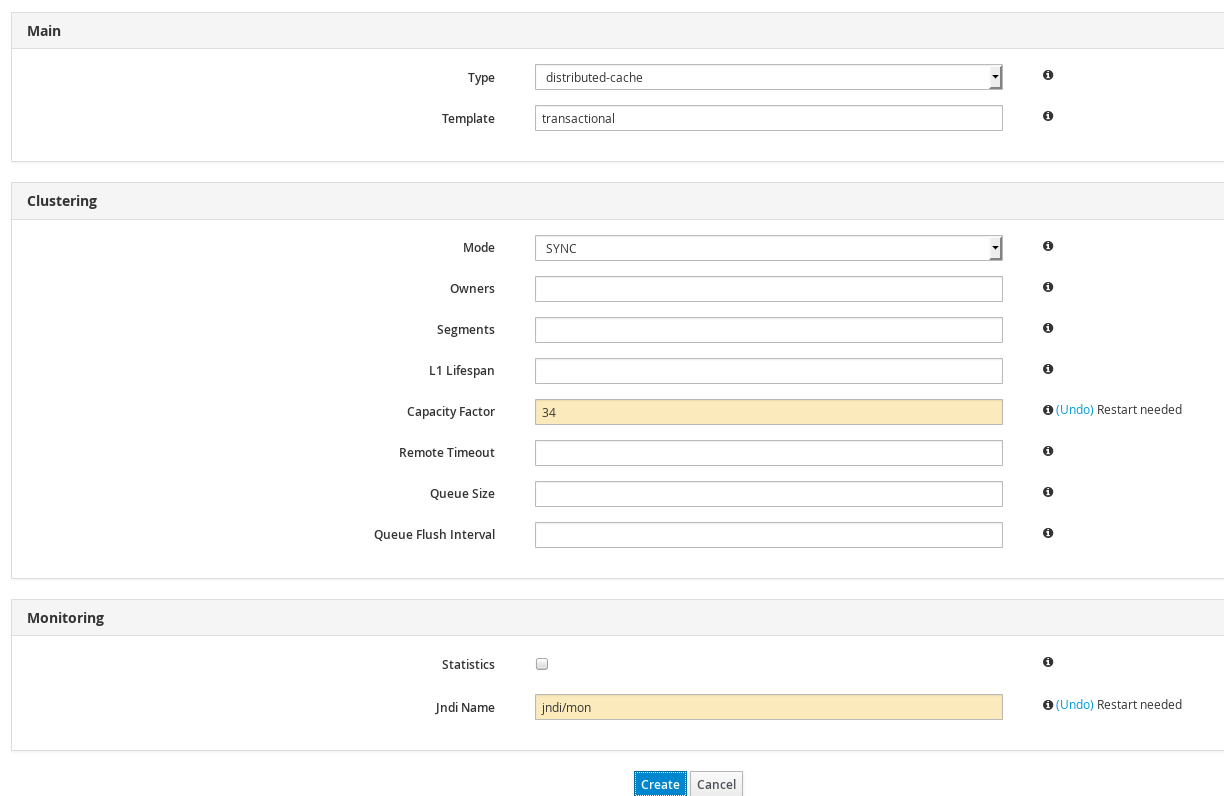
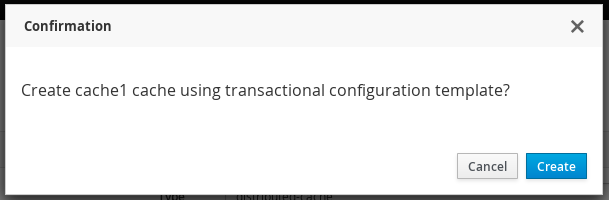
A confirmation screen is displayed. Click Create to create the cache.
Figure 26.9. Cache Confirmation
26.5.2. Editing Cache Configuration
The JBoss Data Grid Administration Console allows administrators to edit the configuration of an existing cache.
The following procedure outlines the steps to edit a cache configuration:
Editing Cache Configuration
Log into the JBoss Data Grid Administration Console and click on the cache container name.
Figure 26.10. Cache Containers
In the Caches view, click on the cache name.
Figure 26.11. Caches View

The cache statistics and properties page is displayed. On the right hand side, click the Configuration tab.
Figure 26.12. Cache Configuration Button

The edit cache configuration interface is opened. The editable cache properties are found in the cache properties menu at the left hand side.
Figure 26.13. Editing Cache Configuration Interface
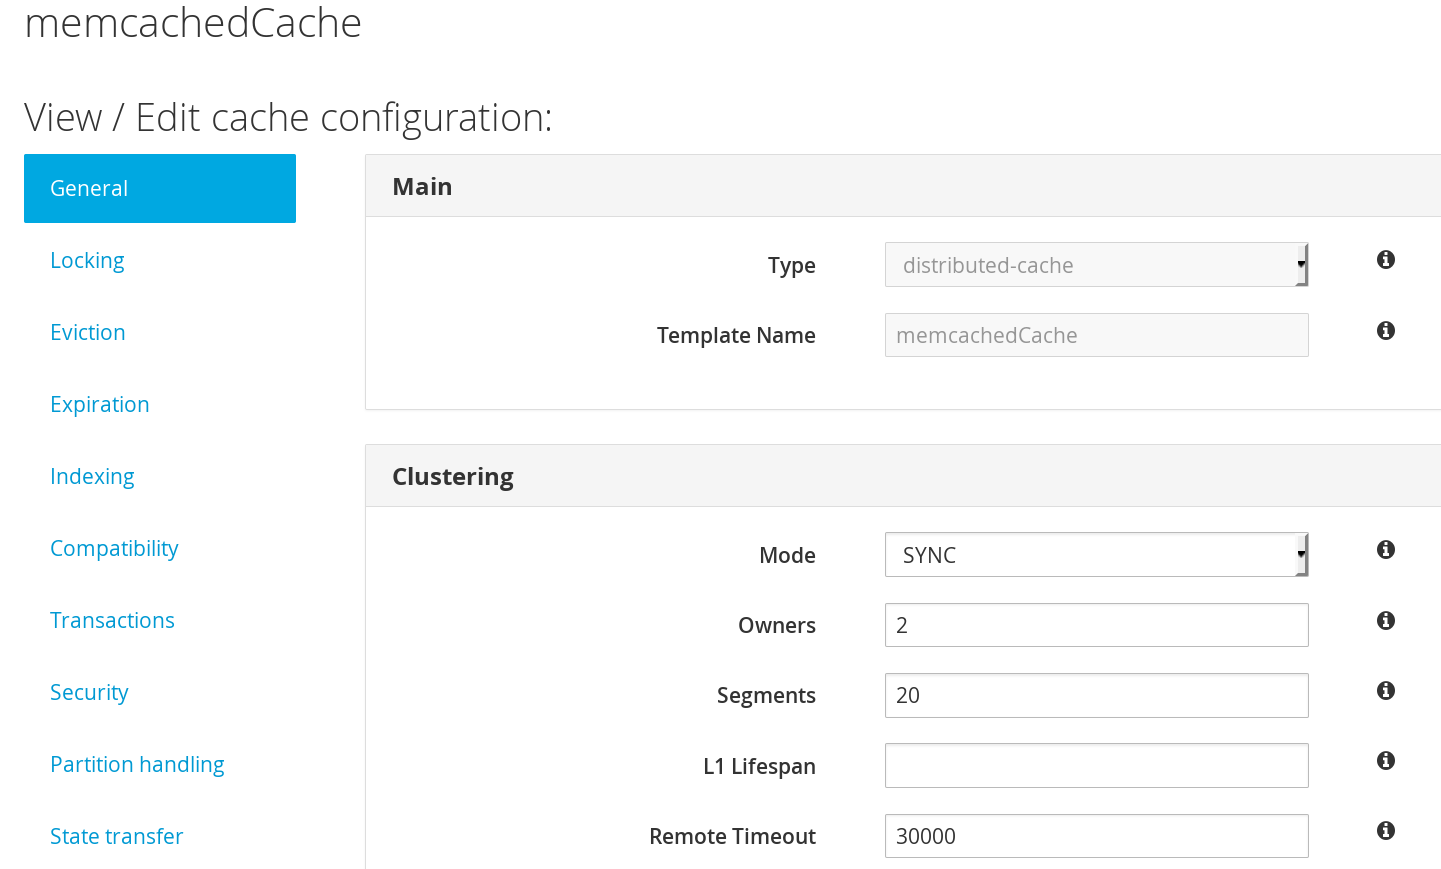
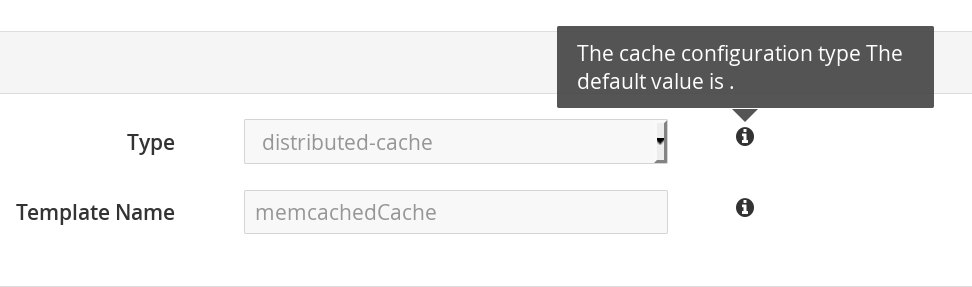
Select the cache configuration property to be edited from the cache properties menu along the left-hand side. To get a description on the cache configuration parameters, hover the cursor over the information icon to the right of each field. The parameter description is presented in form of a tooltip.
Figure 26.14. Cache configuration paramaters
- The General property is selected by default. Edit the required values in the given parameter input fields and click Apply changes below
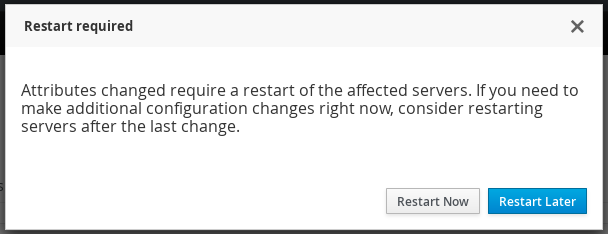
The restart dialogue box appears. Click Restart Now to apply the changes, or Restart Later to continue editing the cache properties.
Figure 26.15. Restart Dialogue Box
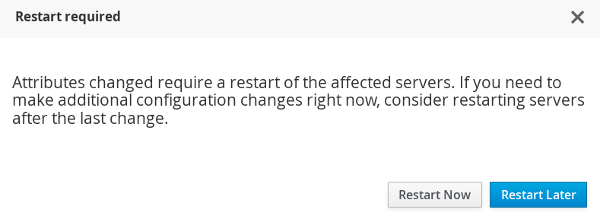 Note
NoteIn standalone mode the dialog instead contains the following text:
Config changes will only be made available after you manually restart the server!
26.5.3. Cache Statistics and Properties View
The JBoss Data Grid Administration Console allows administrators to view all the cache statistics including the average time for reads, average times for writes, total number of entries, total number of reads, total number of failed reads and total number of writes.
To view the cache statistics, follow these steps:
Viewing Cache Statistics
- Navigate to the list of caches by clicking on the name of the cache container in the Cache Container view.
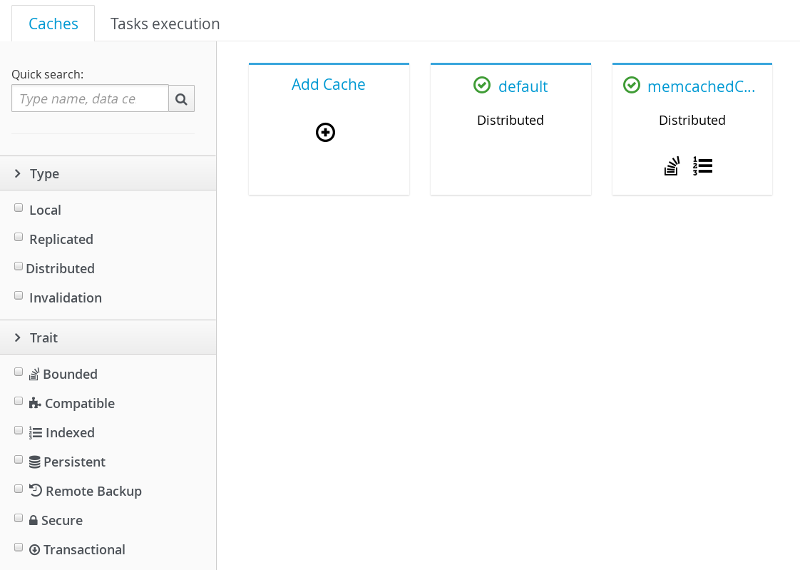
Click on the name of the cache from the list of caches. Optionally you can use the cache filter on the left side to filter caches. The caches can be filtered by a keyword, substring or by selecting the type, the trait, and the status.
Figure 26.16. Caches View
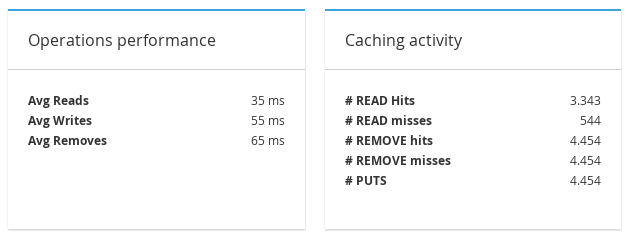
The next page displays the comprehensive cache statistics under the headings:
Cache content,Operations performanceandCaching Activity.Figure 26.17. Cache Statistics
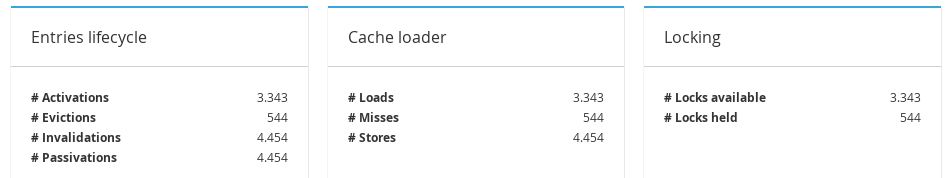
Additional cache statistics are displayed under the headings:
Entries Lifecycle,Cache LoaderandLockingFigure 26.18. Cache Statistics
To view cache properties, click on Configuration at the right hand side.
Figure 26.19. Configuration Button
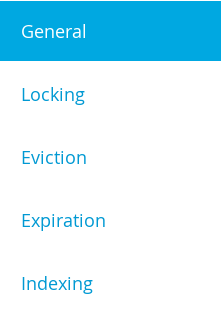
The cache properties menu is displayed at the left hand side.
Figure 26.20. Cache Properties Menu
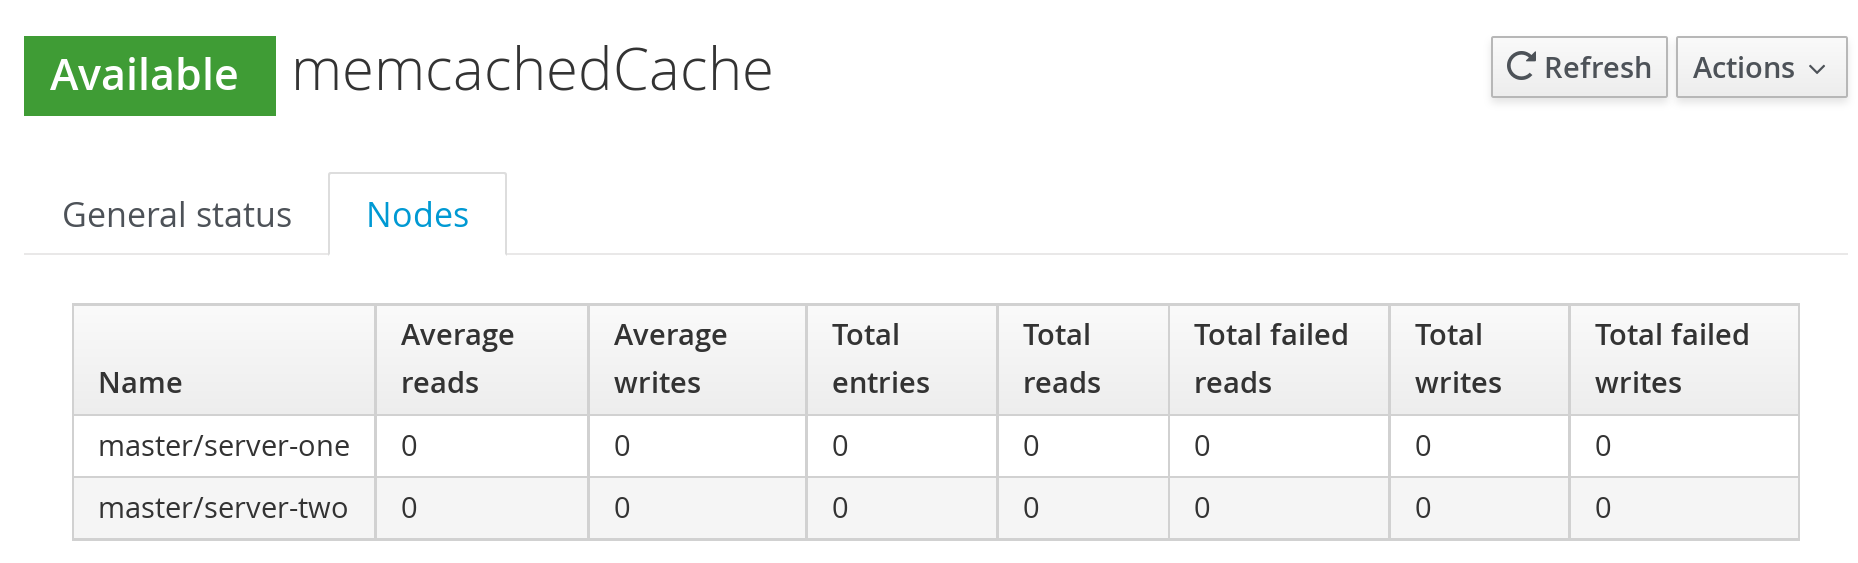
To view on which node a cache resides, click on the Nodes tab next to the General Status tab on the cache statistics page.
Figure 26.21. General Status Tab
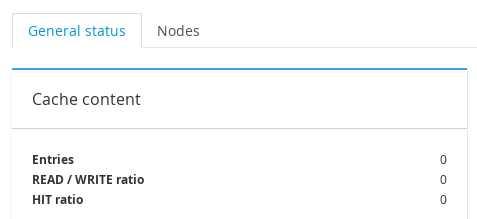
The name of the Node(s) is displayed along with the read-write statistics.
Figure 26.22. Cache Node Labels
26.5.4. Enable and Disable Caches
The following procedure outlines the steps to disable a cache:
Disabling a Cache
Navigate to the caches view by clicking on the name of the cache container in the Cache Container view. Click on the name of the cache to be disabled.
Figure 26.23. Caches View
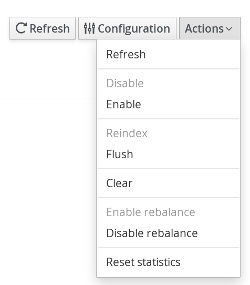
The cache statistics will be displayed. On the right hand side of the interface, click on the Actions tab and then click Disable.
Figure 26.24. Cache Disable

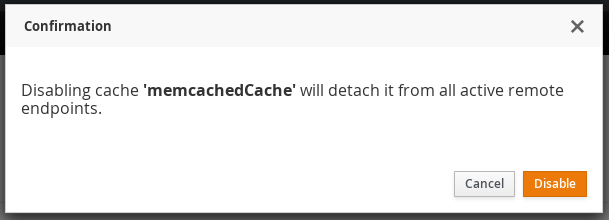
A confirmation dialogue box will appear. Click Disable to disable the cache.
Figure 26.25. Cache Disable Confirmation
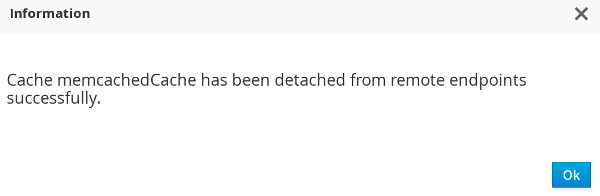
A subsequent dialogue box appears. Click Ok.
Figure 26.26. Confirmation Box
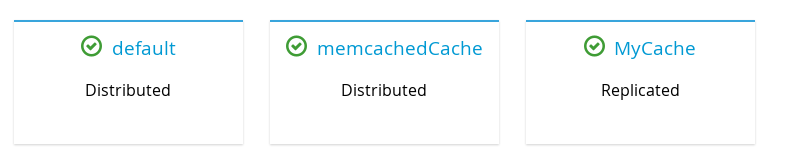
The selected cache is disabled successfully with a visual indicator Disabled next to the cache name label.
Figure 26.27. Disabled Cache

The following procedure outlines the steps to enable a cache:
Enabling a Cache
To enable a cache, click on the specific disabled cache from the Cache view.
Figure 26.28. Caches View
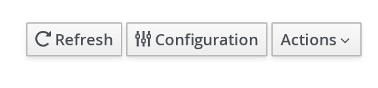
On the right hand side of the interface, click on the Actions tab.

From the Actions tab, click Enable
Figure 26.29. Actions Menu
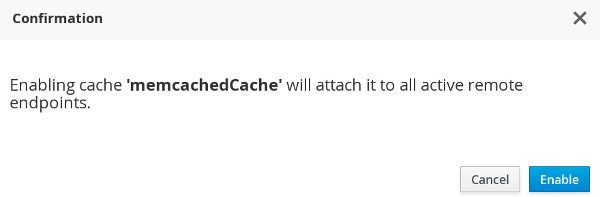
A confirmation dialogue box appears. Click Enable.
Figure 26.30. Confirmation Box
A subsequent dialogue box appears. Click Ok
Figure 26.31. Information Box
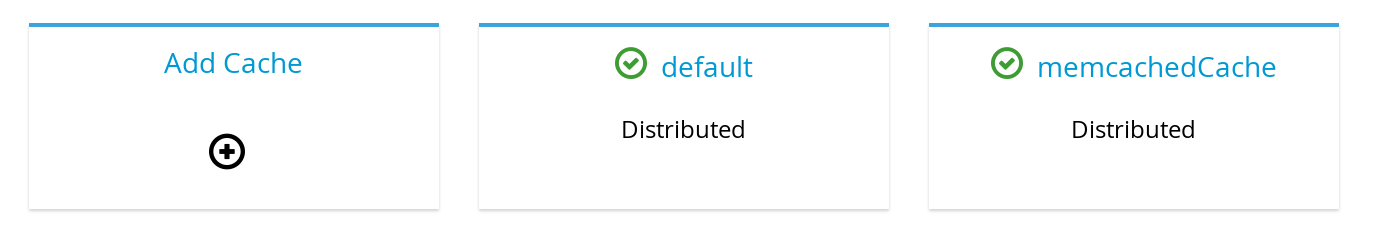
The selected cache is enabled successfully with a visual indicator Enabled next to the cache name label.
Figure 26.32. Cache Enabled

26.5.5. Cache Flush and Clear
The JBoss Data Grid Administration Console allows administrators to remove all the entries from a cache and the cache stores through the cache Clear operation. The console also provides the Flush operation to store the entries from the cache memory to the cache store. These entries are not removed from the cache memory, as during a Clear operation.
Flushing a Cache
To flush a cache, follow these steps:
Flushing a Cache
- In the Cache Containers view, click on the name of the cache container.
The Caches view is displayed. Click on the cache to be flushed.
Figure 26.33. Caches View
The cache statistics page is displayed. At the right hand side, click Actions.
Figure 26.34. Actions Button
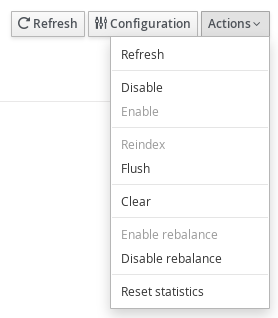
From the Actions menu, click Flush.
Figure 26.35. Actions Menu
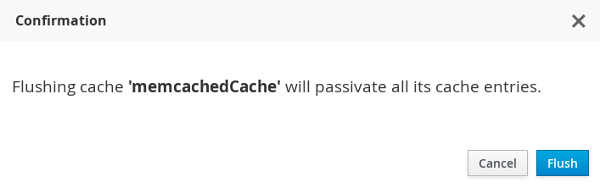
A confirmation dialogue box appears. Click Flush.
Figure 26.36. Cache Flush Confirmation Box
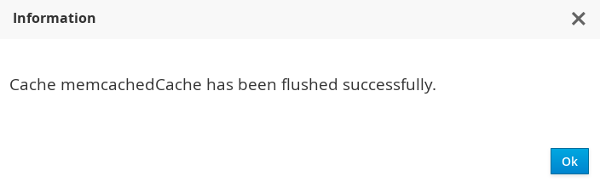
The cache is successfully flushed. Click Ok.
Figure 26.37. Cache Flush Information Box
Clearing a Cache
To clear a cache, follow these steps:
Clearing a Cache
- In the Cache Containers view, click on the name of the cache container.
The Caches view is displayed. Click on the cache to be cleared.
Figure 26.38. Caches View
On the cache statistics page, at the right hand side, click Actions.
From the Actions menu, click Clear.
Figure 26.39. Clear Button
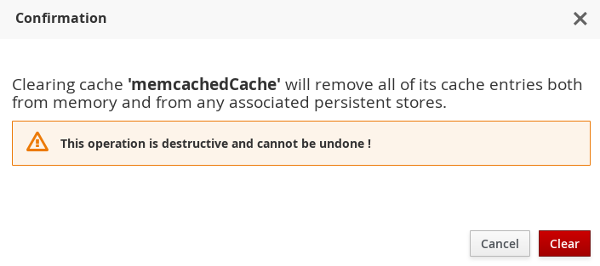
A confirmation dialogue box appears. Click Clear.
Figure 26.40. Confirmation Box
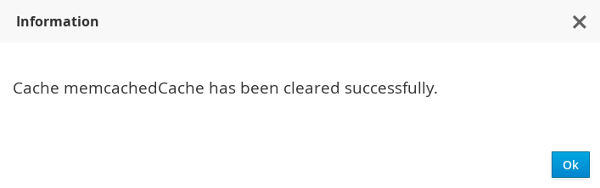
The cache is successfully cleared. Click Ok.
Figure 26.41. Information Box
26.5.6. Server Tasks Execution
The JBoss Data Grid Administration Console allows administrators to start a server script job on the JBoss Data Grid cluster.
26.5.7. Server Tasks
26.5.7.1. New Server Task
The following procedure outlines the steps to launch a new server task:
Launching a new task is not supported if the server is running in standalone non-clustered mode.
Launching a New Server Task
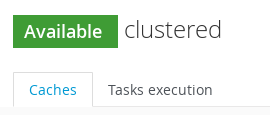
- In the Cache Containers view of the JBoss Data Grid Administration Console, click on the name of the Cache container.
On the cache view page, click the Task Execution tab.
Figure 26.42. Task Execution
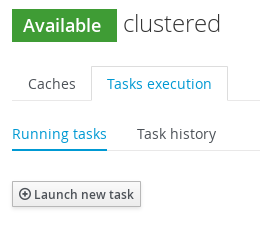
In the Tasks execution tab, click Launch new task.
Figure 26.43. Launch New Task
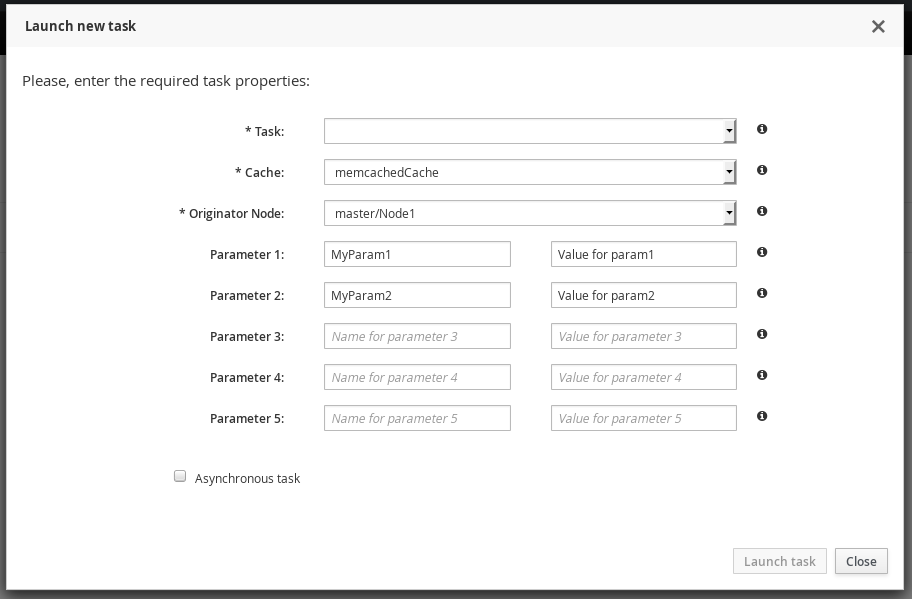
Enter the new task properties and click Launch task.
Figure 26.44. Task Properties
26.5.7.2. Server Tasks View
After the server task is launched, it can be viewed in the Task execution tab along with the other running tasks. The set of completed server script jobs with the start time and end time can be viewed. Additionally, number of successful executions and number of failed executions can also be viewed.
Figure 26.45. Server Tasks View
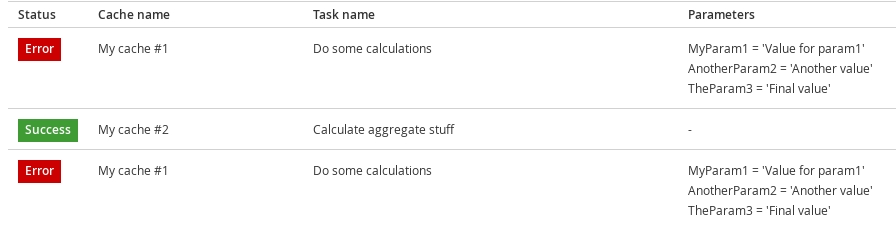
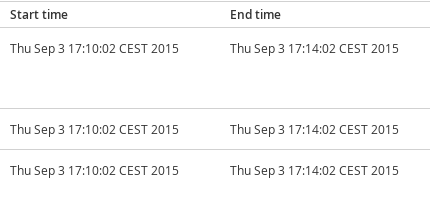
Figure 26.46. Task Start/End Time
26.6. Cache Container Configuration
26.6.1. Cache Container Configuration
The JBoss Data Grid Administration Console allows users to view and set Cache Container level settings such as transport, thread pools, security, cache templates, deployment of remote Executables/Scripts. Each cache container is associated with a cluster.
The following procedure outlines the steps to aceess the Cache Container Configuration settings:
Accessing Cache Container Configuration Settings
In the Cache Container View, click on the name of the cache container.
Figure 26.47. Cache Container View
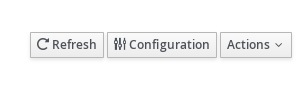
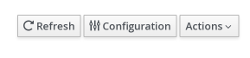
Click Configuration setting button at the top right hand side of the interface.
Figure 26.48. Configuration
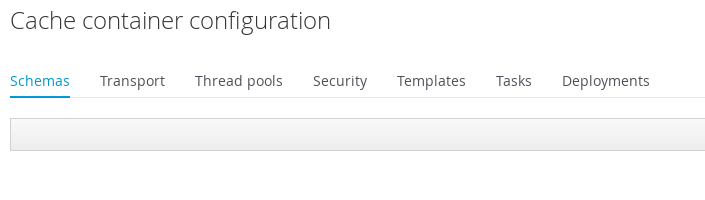
The Cache Container Configuration interface is displayed.
Figure 26.49. Cache Container Configuration
26.6.2. Defining Protocol Buffer Schema
A Protocol Buffer Schema is defined in the Cache Container Configuration interface.
The following procedure outlines the steps to define a protobuf schema:
Defining a Protobuf Schema
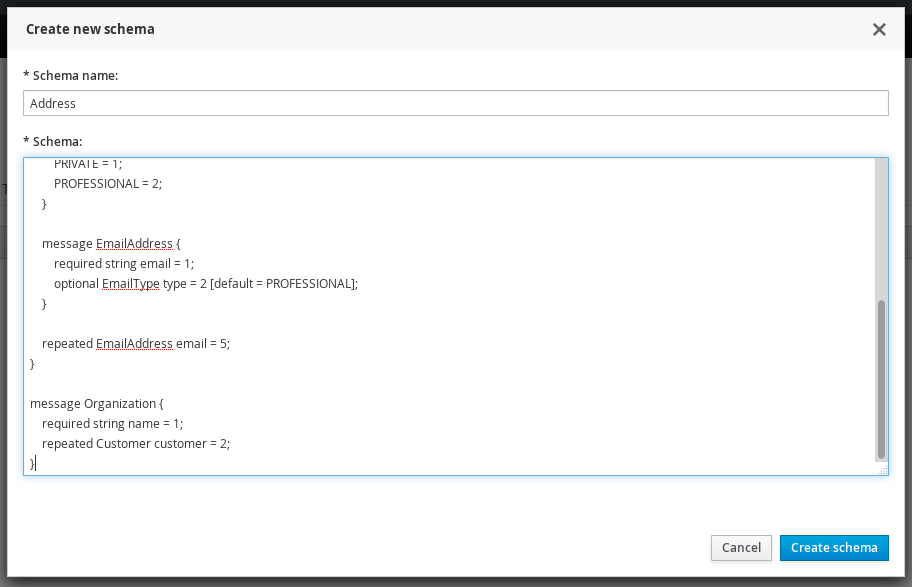
- Click Add at the right hand side of the Schema tab to launch the create schema window.
Enter the schema name and the schema in the respective fields and click Create Schema.
Figure 26.50. New Schema
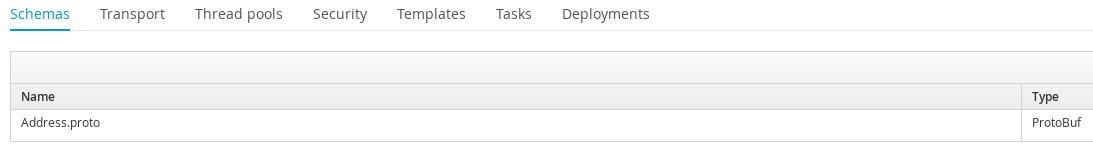
The protocol buffer schema is added.
Figure 26.51. Protocol Buffer
26.6.3. Transport Setting
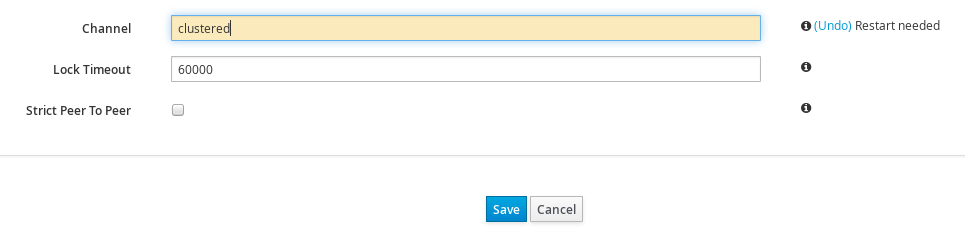
To access the Transport setting, click on the Transport tab in the Cache Container Configuration interface. Enter the Transport settings and click Save .
Figure 26.52. Transport Setting
A dialog box will prompt to restart the server due to configuration changes. Restart to apply the changes.
Figure 26.53. Restart Confirmation
26.6.4. Defining Thread Pools
To define thread pools for different cache related operations, click on the Thread Pools tab in the Cache Container Configuration interface.
The JBoss Data Grid Administration Console allows administrators to set Thread Pool values for the following cache level operations:
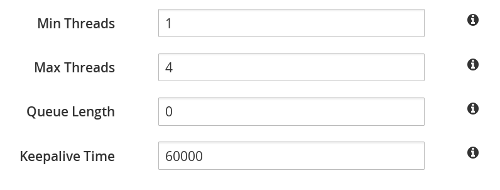
Async Operations
Figure 26.54. Async Operations
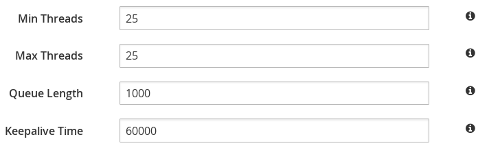
The currently set value for each parameter is set by the console. Hover the cursor over the information icon to view the parameter description in form of a tooltip. To change a thread pool value, enter the new value in the parameter field and click Save . A server restart is needed after every change of values.
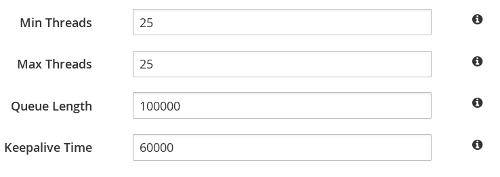
Expiration
For Expiration settings, the user can set values for the following parameters:
Figure 26.55. Expiration Values
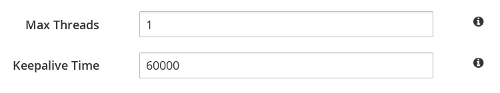
Listener
For Listener settings, the user can set values for the following parameters:
Figure 26.56. Listener Values
Persistence
For Persistence settings, the user can set values for the following parameters:
Figure 26.57. Persistence Values
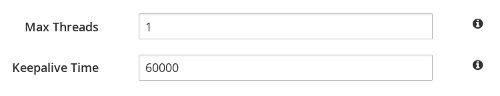
Remote Commands
For Remote Commands settings, the user can set values for the following parameters:
Figure 26.58. Remote Commands
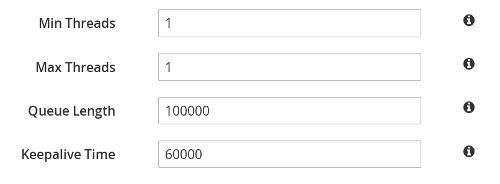
Replication Queue
For Replication Queue settings, the user can set values for the following parameters:
Figure 26.59. Replication Queue Values
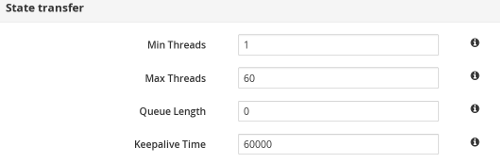
State Transfer
For Listener settings, the user can set values for the following parameters:
Figure 26.60. State Transfer Values
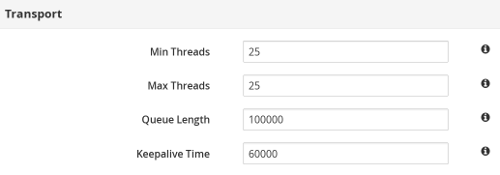
Transport
For Transport settings, the user can set values for the following parameters:
Figure 26.61. Transport Values
26.6.5. Adding New Security Role
The following procedure outlines the steps to add a new security role:
Adding a Security Role
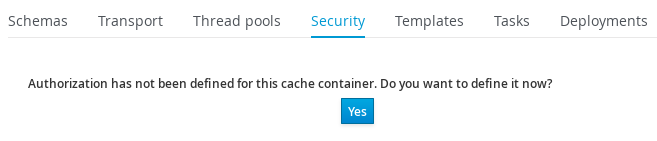
Click on the Security tab. If authorization is not defined for a cache container, click Yes to define.
Figure 26.62. Define Authorization
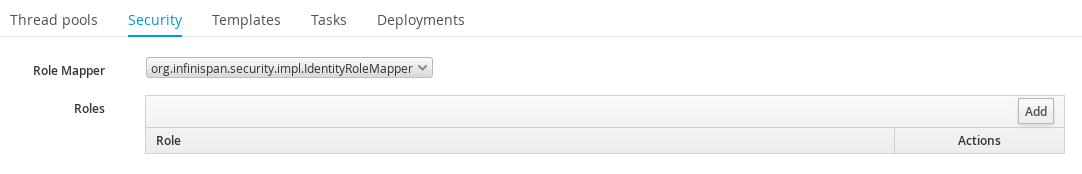
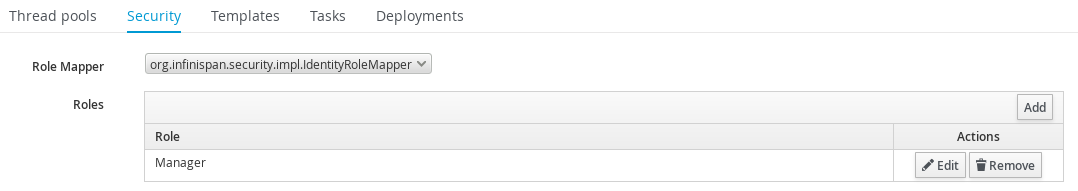
Select the Role Mapper from the drop-down menu. Click Add to launch the permissions window.
Figure 26.63. Role Mapper Selection
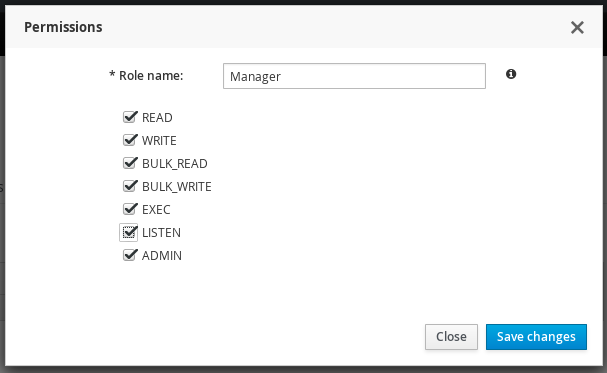
In the Permissions window, enter the name of the new role and assign the permissions by checking the required check-boxes. Click Save changes to save the role.
Figure 26.64. Role Permissions
The new security role is added.
Figure 26.65. New Security Role
26.6.6. Creating Cache Configuration Template
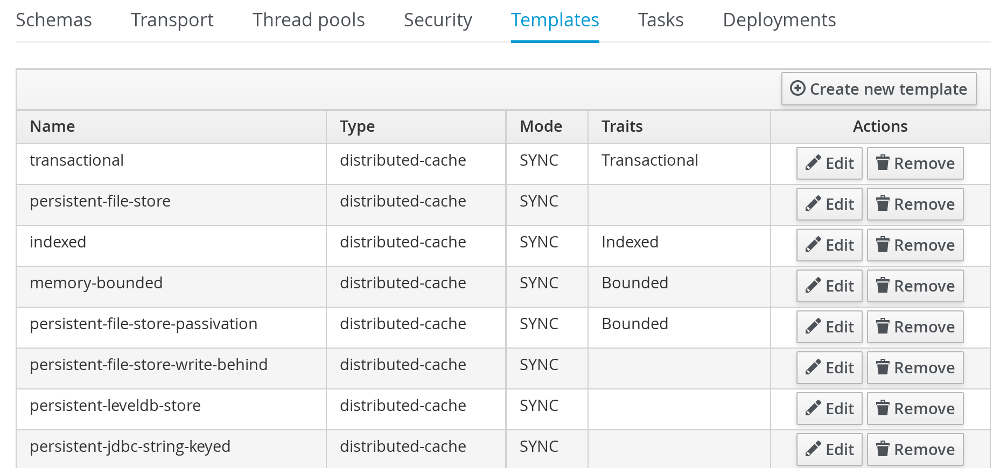
The Templates tab in the Cache Container Configuration interface lists all the configured and available cache templates.
Figure 26.66. Cache Templates View
The following procedure outlines the steps to create a new Cache configuration template :
Creating New Cache Configuration Template
- Click Create new Template on the right hand side of the templates list.
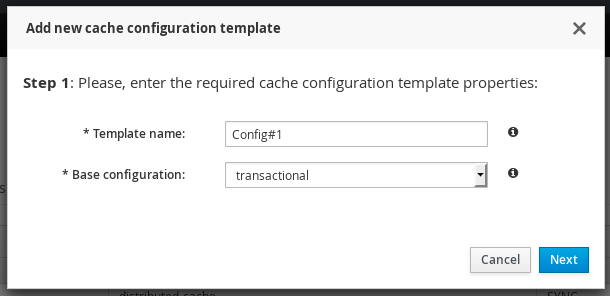
Enter the cache configuration template name and select the base configuration from the drop-down and click Next.
Figure 26.67. Cache Configuration Template
Set the cache template attributes for the various cache operations such as Locking, Expiration, Indexing and others.
Figure 26.68. Cache Configuration Template
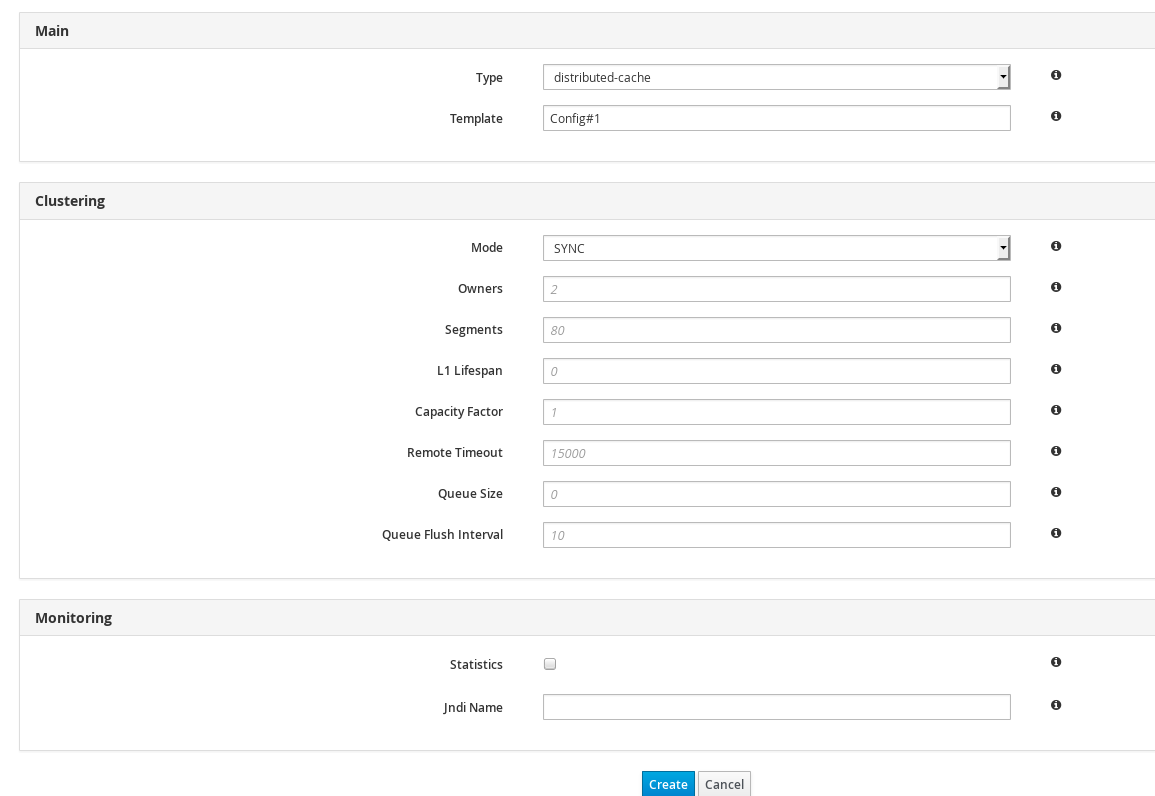
- After entering the values, click Create to create the Cache Template.
26.7. Cluster Administration
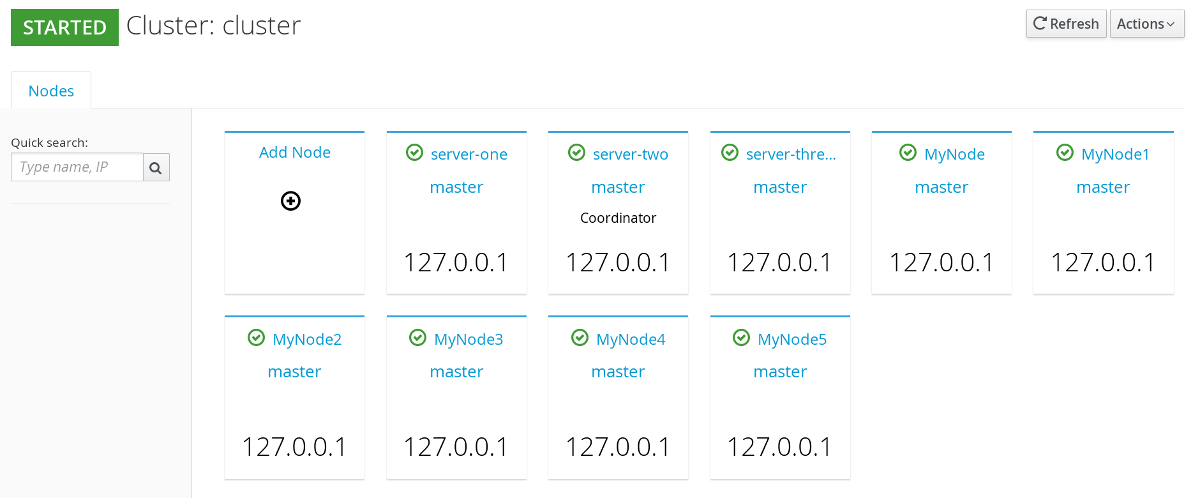
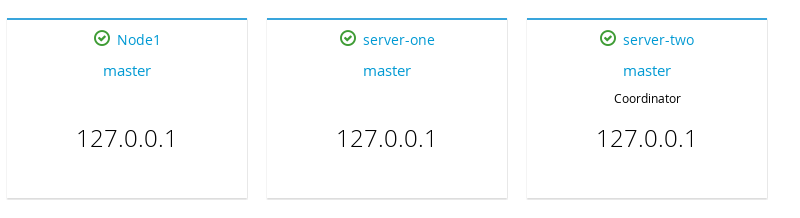
26.7.1. Cluster Nodes View
Clusters centric view allows to view the nodes created for each server group and the list of deployed servers can be viewed. In Clusters view, you can add new nodes to the cluster group and view performance metrics of the particular nodes.
The Cluster view will not appear when the server is running in standalone non-clustered mode. When running in standalone clustered mode the Cluster view will be displayed, but no operations on cluster nodes may be performed.
To access the Clusters view, navigate to the Clusters tab from the Dashboard and click on the name of the cluster.
Figure 26.69. Nodes View
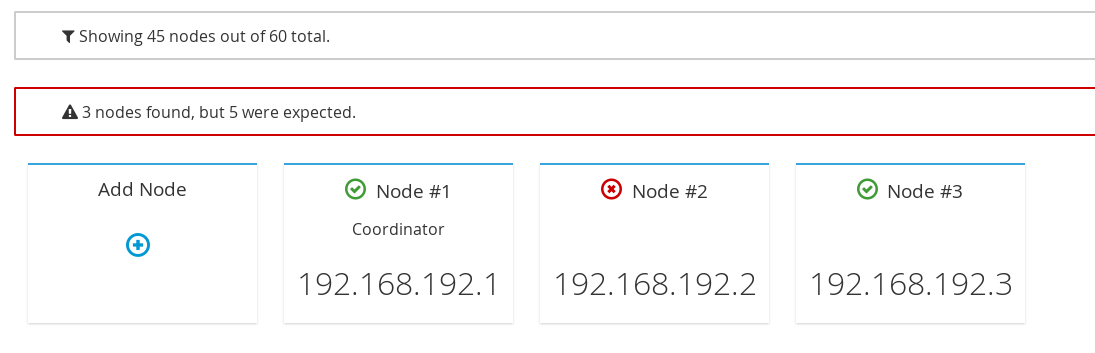
26.7.2. Cluster Nodes Mismatch
The total number of server nodes on the JBoss Data Grid cluster should ideally match the number of nodes shown in the JBoss Data Grid Administration Console. If in case, due to some reason, the expected nodes in the console do not match with the exact number of nodes on the JBoss Data Grid physical cluster, the console issues a mismatch warning by displaying the number of nodes detected and the number of expected nodes. Knowing the expected number of server nodes helps in handling Network Partitions.
If nodes mismatch occurs, it can be viewed in the clusters view, above the list of nodes as a warning. To access the Clusters view, navigate to the Clusters tab from the Dashboard and click on the name of the cluster.
In the following screen, the Console alerts the user in the form of a warning. The expected number of server nodes are 5 but only 3 are detected by the console.
Figure 26.70. Cluster Nodes Mismatch
26.7.3. Cluster Rebalancing
The Red Hat JBoss Data Grid Administration Console allows the user to enable and disable cluster rebalancing at the cache container and cache levels.
Cluster rebalancing is enabled by default.
The following procedure outlines the steps to enable and disable cluster rebalancing at a cache container level :
Enable and Disable Rebalancing
- From the cache container view, click on the name of the cache container.
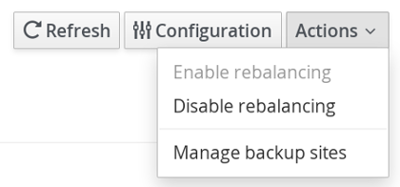
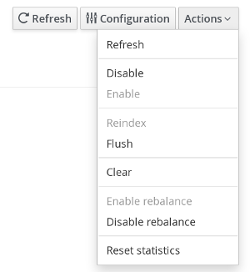
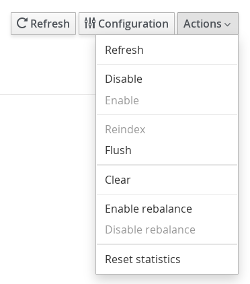
In the caches view, at the right hand side, click on Actions.
A callout menu is opened. Click Disable Rebalancing.
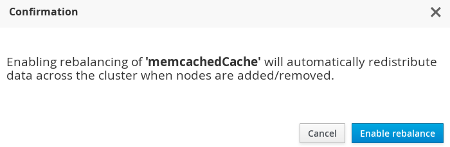
A confirmation dialogue box appears. Click Accept.
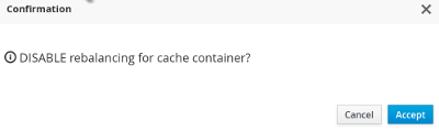
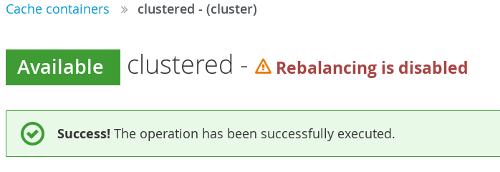
Cluster rebalancing is successfully disabled.
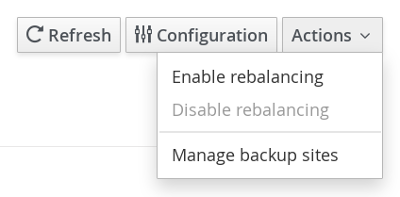
To enable rebalancing, click Actions Enable Rebalancing.
A confirmation dialogue box appears. Click Accept.
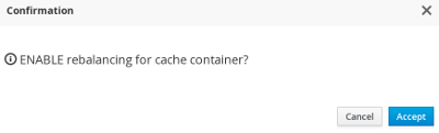
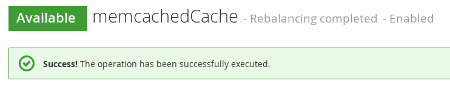
Rebalancing is successfully enabled.
The following procedure outlines the steps to enable and disable cluster rebalancing at a cache level :
Enable and Disable Rebalancing
- From the cache container view, click on the name of the cache container.
- In the caches view, click on a specific cache.
The cache statistics page is displayed. At the right hand side, click Actions.
From the callout menu, click Disable Rebalance.
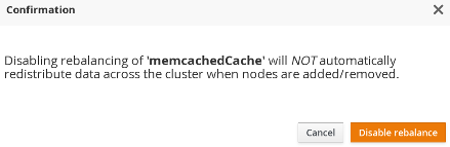
A confirmation dialogue box appears. Click Disable Rebalance.
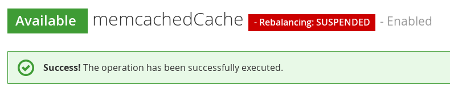
The rebalancing for the cache is successfully disabled.
To enable cache level rebalancing, click Enable rebalance from the Actions menu.
A confirmation dialogue box appears. Click Enable rebalance.
The rebalancing for the cache is successfully enabled.
26.7.4. Cluster Partition Handling
The JBoss Data Grid Administration Console alerts the user with a visual warning when the cluster changes state to DEGRADED . The assumed causes for a DEGRADED cluster are occurence of a network partition, unreachable node(s) or unexpected extra nodes.
The visual warning is displayed in the Clusters view. To access the Clusters view, navigate to the Clusters tab from the Dashboard and click on the name of the cluster. In the following screen, the visual warning DEGRADED is displayed next to the cluster name JDG Cluster #1.
Figure 26.71. Network Partition Warning
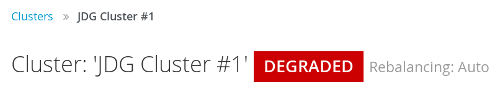
This visual warning for a DEGRADED cluster is shown at Cluster, Cache Container, and Cache levels of the console.
26.7.5. Cluster Events
The JBoss Data Grid Console displays the cluster wide events such as cluster-split and cluster-merge events in a consolidated section.
Cluster Events are not available when the server is running in standalone non-clustered mode.
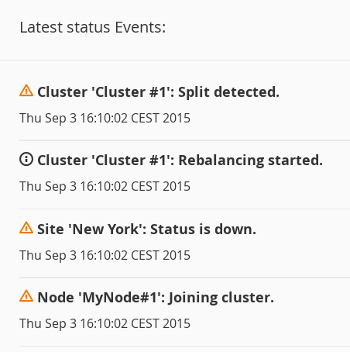
Along with the cluster events, the console displays the timestamp of the associated event. Cluster events can be viewed in the Cache containers page, the Clusters view page and also in the Status Events tab of the Dashboard.
To view cluster events on the cache containers page, navigate to the default cache containers view which is the default landing interface after logging into the console. The Cluster events are displayed at the right hand side in a consolidated section under the title Latest Grid Events
To view the cluster events on the Clusters view page, navigate to the Clusters view by clicking on the Clusters tab. The Cluster events are displayed at the right hand side in a consolidated section under the title Latest status Events
26.7.6. Adding Node
The JBoss Data Grid Administration Console allows administrators to configure new nodes.
The following procedure outlines the steps to add a new Node:
Adding a New Node
In the Dashboard view, click Cluster tab.
Figure 26.72. Clusters Tab
Click on the name of the cluster where the new node has to be added.
Figure 26.73. Cluster Selection
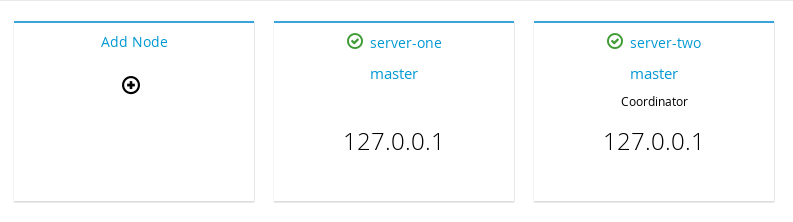
Click Add Node.
Figure 26.74. Add Node Created
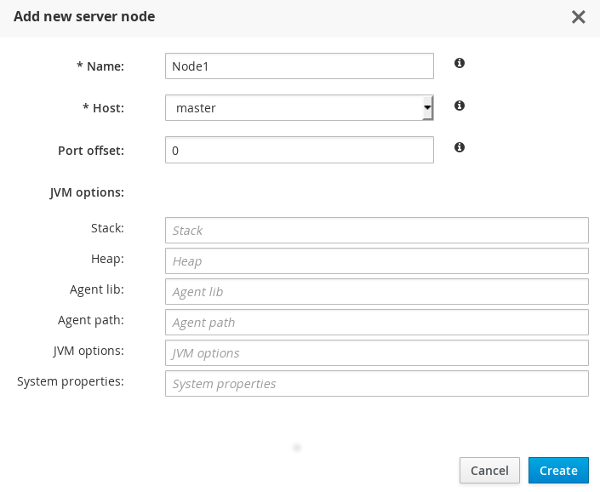
The node configuration window is opened. Enter the node properties in the respective fields and click Create
Figure 26.75. Node Properties
The system boots up.
Figure 26.76. System Boot
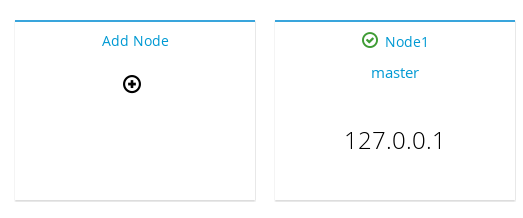
The new node is successfully created.
Figure 26.77. New Node
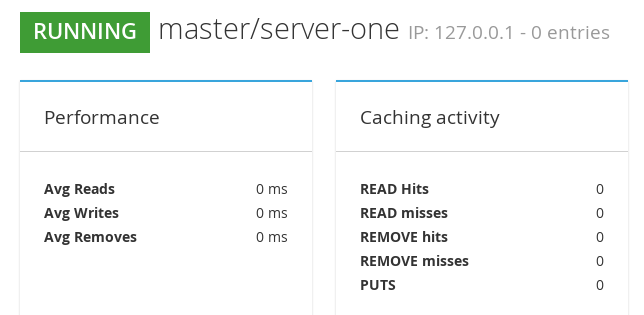
26.7.7. Node Statistics and Properties View
JBoss Data Grid Administration Console allows users to view the average time for reads, average times for writes, total number of entries, total number of reads, total number of failed reads, total number of writes and other data.
To view the Node statistics, click on the name of the Node in the Clusters tab on the JBoss Data Grid Administration Console.
Figure 26.78. Nodes Statistics
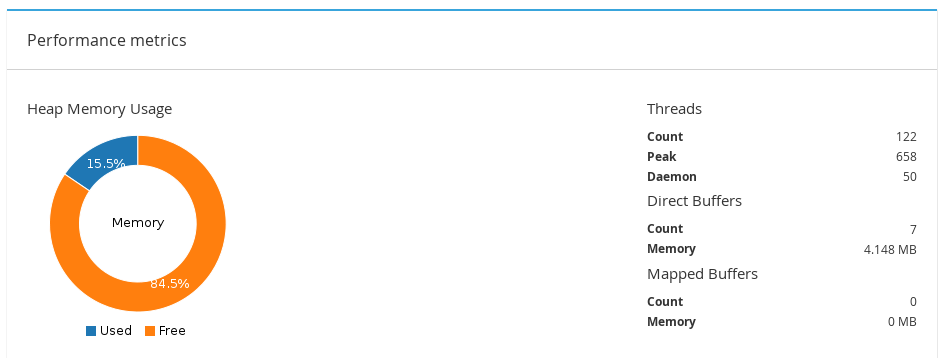
26.7.8. Node Performance Metrics View
To view the Node performance metrics, click on the name of the node in the Clusters tab of the JBoss Data Grid Administration Console
Figure 26.79. Node Performance Metrics
26.7.9. Disabling a Node
The JBoss Data Grid Administration Console allows administrators to disable nodes.
To disable a node of a cluster, follow these steps:
Adding a New Node
- Click on the name of the cluster in the Cluster View of the JBoss Data Grid Administration Console.
In the Nodes view, click on the node to be disabled.
Figure 26.80. Nodes View
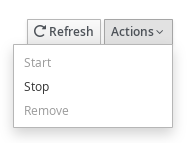
The Node statistics view is opened. Click on the Actions tab located at the right hand side of the page and then click Stop.
Figure 26.81. Nodes Stop
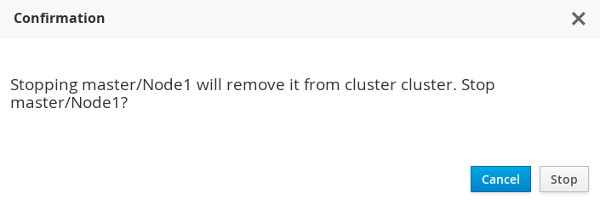
A confirmation box appears. Click Stop to shut down the node.
Figure 26.82. Confirmation Box
26.7.10. Cluster Shutdown and Restart
26.7.10.1. Cluster Shutdown
JBoss Data Grid Administration Console allows convenient and controlled shutdown of JBoss Data Grid clusters for maintenance purposes. For caches with a configured cache store, the data will be persisted without any data loss.For caches without a configured cache store, data will be lost after cluster shutdown.
To shut down or stop a cluster, follow these steps:
Shutting Down Cluster
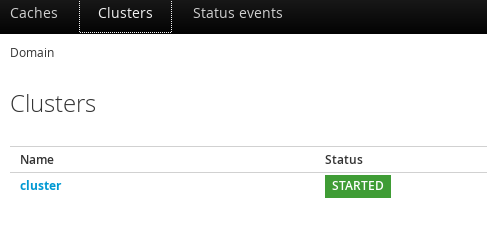
Navigate to the Clusters view in the JBoss Data Grid Administration console and click on the name of the cluster.
Figure 26.83. Clusters View
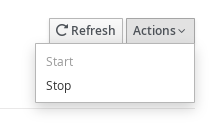
On the Nodes view page, locate the Actions tab to the top right hand side of the interface. Click on Actions tab and then click Stop.
Figure 26.84. Cluster Stop
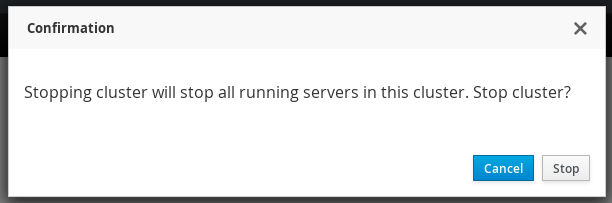
A confirmation box will appear. To confirm, click Stop.
Figure 26.85. Confirmation Box
26.7.10.2. Cluster Start
JBoss Data Grid Administration Console allows restarting a stopped cluster. The cache data is preloaded without any data loss for caches with configured cache-store. Caches without a configured cache store, will initially contain no data.
Preloading will only happen if preload is enabled on the cache store. If the local cache state on one of the nodes is corrupt, the cache will not start and manual intervention will be required.
To a cluster, follow these steps:
Starting Cluster
- Navigate to the Clusters view in the JBoss Data Grid Administration console and click on the name of the cluster.
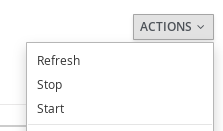
On the Nodes view page, locate the Actions tab to the top right hand side of the interface. Click on Actions tab and then click Start.
Figure 26.86. Cluster Start
- A confirmation box will appear. Click Start to start the cluster.