
Chapter 6. Troubleshooting CodeReady Workspaces
This section provides troubleshooting procedures for the most frequent issues a user can come in conflict with.
Additional resources
6.1. Viewing CodeReady Workspaces workspaces logs
This section describes how to view CodeReady Workspaces workspaces logs.
6.1.1. Viewing logs from language servers and debug adapters
6.1.1.1. Checking important logs
This section describes how to check important logs.
Procedure
- In the OpenShift web console, click Applications → Pods to see a list of all the active workspaces.
- Click on the name of the running Pod where the workspace is running. The Pod screen contains the list of all containers with additional information.
Choose a container and click the container name.
NoteThe most important logs are the
theia-idecontainer and the plug-ins container logs.- On the container screen, navigate to the Logs section.
6.1.1.2. Detecting memory problems
This section describes how to detect memory problems related to a plug-in running out of memory. The following are the two most common problems related to a plug-in running out of memory:
- The plug-in container runs out of memory
-
This can happen during plug-in initialization when the container does not have enough RAM to execute the entrypoint of the image. The user can detect this in the logs of the plug-in container. In this case, the logs contain
OOMKilled, which implies that the processes in the container requested more memory than is available in the container. - A process inside the container runs out of memory without the container noticing this
For example, the Java language server (Eclipse JDT Language Server, started by the
vscode-javaextension) throws an OutOfMemoryException. This can happen any time after the container is initialized, for example, when a plug-in starts a language server or when a process runs out of memory because of the size of the project it has to handle.To detect this problem, check the logs of the primary process running in the container. For example, to check the log file of Eclipse JDT Language Server for details, see the relevant plug-in-specific sections.
6.1.1.3. Logging the client-server traffic for debug adapters
This section describes how to log the exchange between Che-Theia and a debug adapter into the Output view.
Prerequisites
- A debug session must be started for the Debug adapters option to appear in the list.
Procedure
- Click File → Settings and then open Preferences.
- Expand the Debug section in the Preferences view.
Set the trace preference value to
true(default isfalse).All the communication events are logged.
- To watch these events, click View → Output and select Debug adapters from the drop-down list at the upper right corner of the Output view.
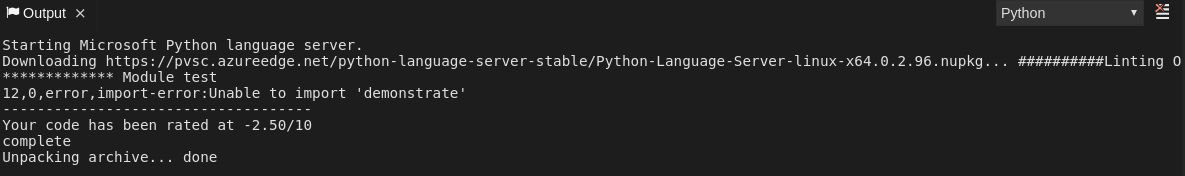
6.1.1.4. Viewing logs for Python
This section describes how to view logs for the Python language server.
Procedure
Navigate to the Output view and select Python in the drop-down list.
6.1.1.5. Viewing logs for Go
This section describes how to view logs for the Go language server.
6.1.1.5.1. Finding the Go path
This section describes how to find where the GOPATH variable points to.
Procedure
Execute the
Go: Current GOPATHcommand.

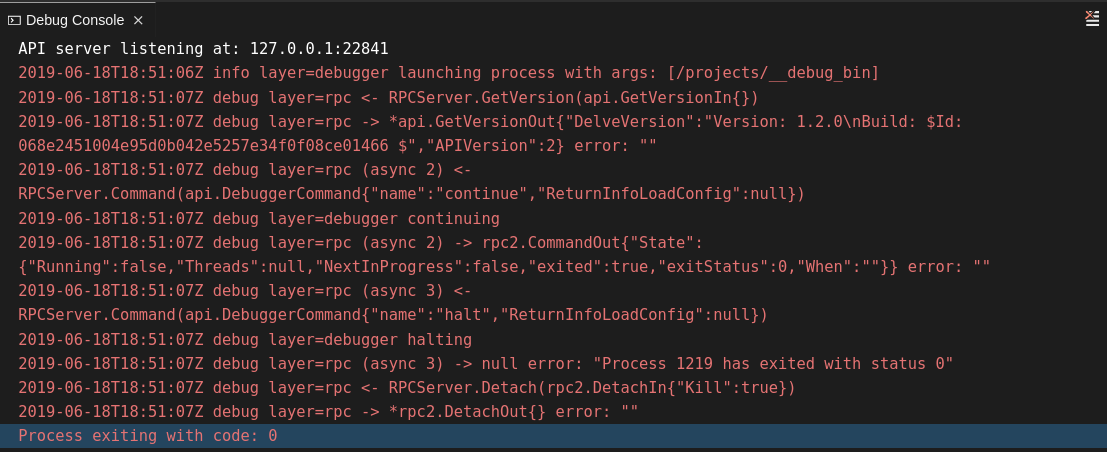
6.1.1.5.2. Viewing the Debug Console log for Go
This section describes how to view the log output from the Go debugger.
Procedure
Set the
showLogattribute totruein the debug configuration.{ "version": "0.2.0", "configurations": [ { "type": "go", "showLog": true .... } ] }To enable debugging output for a component, add the package to the comma-separated list value of the
logOutputattribute:{ "version": "0.2.0", "configurations": [ { "type": "go", "showLog": true, "logOutput": "debugger,rpc,gdbwire,lldbout,debuglineerr" .... } ] }The debug console prints the additional information in the debug console.
6.1.1.5.3. Viewing the Go logs output in the Output panel
This section describes how to view the Go logs output in the Output panel.
Procedure
- Navigate to the Output view.
Select Go in the drop-down list.

6.1.1.6. Viewing logs for the NodeDebug NodeDebug2 adapter
No specific diagnostics exist other than the general ones.
6.1.1.7. Viewing logs for Typescript
6.1.1.7.1. Enabling the label switched protocol (LSP) tracing
Procedure
-
To enable the tracing of messages sent to the Typescript (TS) server, in the Preferences view, set the
typescript.tsserver.traceattribute toverbose. Use this to diagnose the TS server issues. -
To enable logging of the TS server to a file, set the
typescript.tsserver.logattribute toverbose. Use this log to diagnose the TS server issues. The log contains the file paths.
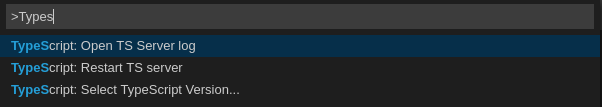
6.1.1.7.2. Viewing the Typescript language server log
This section describes how to view the Typescript language server log.
Procedure
To get the path to the log file, see the Typescript Output console:

To open log file, use the Open TS Server log command.
6.1.1.7.3. Viewing the Typescript logs output in the Output panel
This section describes how to view the Typescript logs output in the Output panel.
Procedure
- Navigate to the Output view
Select TypeScript in the drop-down list.

6.1.1.8. Viewing logs for Java
Other than the general diagnostics, there are Language Support for Java (Eclipse JDT Language Server) plug-in actions that the user can perform.
6.1.1.8.1. Verifying the state of the Eclipse JDT Language Server
Procedure
Check if the container that is running the Eclipse JDT Language Server plug-in is running the Eclipse JDT Language Server main process.
-
Open a terminal in the container that is running the Eclipse JDT Language Server plug-in (an example name for the container:
vscode-javaxxx). Inside the terminal, run the
ps aux | grep jdtcommand to check if the Eclipse JDT Language Server process is running in the container. If the process is running, the output is:usr/lib/jvm/default-jvm/bin/java --add-modules=ALL-SYSTEM --add-opens java.base/java.util
This message also shows the VSCode Java extension used. If it is not running, the language server has not been started inside the container.
- Check all logs described in Checking important logs
6.1.1.8.2. Verifying the Eclipse JDT Language Server features
Procedure
If the Eclipse JDT Language Server process is running, check if the language server features are working:
- Open a Java file and use the hover or autocomplete functionality. In case of an erroneous file, the user sees Java in the Outline view or in the Problems view.
6.1.1.8.3. Viewing the Java language server log
Procedure
The Eclipse JDT Language Server has its own workspace where it logs errors, information about executed commands, and events.
- To open this log file, open a terminal in the container that is running the Eclipse JDT Language Server plug-in. You can also view the log file by running the Java: Open Java Language Server log file command.
-
Run
cat <PATH_TO_LOG_FILE>wherePATH_TO_LOG_FILEis/home/theia/.theia/workspace-storage/<workspace_name>/redhat.java/jdt_ws/.metadata/.log.
6.1.1.8.4. Logging the Java language server protocol (LSP) messages
Procedure
To log the LSP messages to the VS Code Output view, enable tracing by setting the java.trace.server attribute to verbose.
Additional resources
For troubleshooting instructions, see the VS Code Java Github repository.
6.1.1.9. Viewing logs for Intelephense
6.1.1.9.1. Logging the Intelephense client-server communication
Procedure
To configure the PHP Intelephense language support to log the client-server communication in the Output view:
- Click File → Settings.
- Open the Preferences view.
-
Expand the Intelephense section and set the
trace.server.verbosepreference value toverboseto see all the communication events (the default value isoff).
6.1.1.9.2. Viewing Intelephense events in the Output panel
This procedure describes how to view Intelephense events in the Output panel.
Procedure
- Click View → Output
- Select Intelephense in the drop-down list for the Output view.
6.1.1.10. Viewing logs for PHP-Debug
This procedure describes how to configure the PHP Debug plug-in to log the PHP Debug plug-in diagnostic messages into the Debug Console view. Configure this before the start of the debug session.
Procedure
-
In the
launch.jsonfile, add the"log": trueattribute to thephpconfiguration. - Start the debug session.
- The diagnostic messages are printed into the Debug Console view along with the application output.
6.1.1.11. Viewing logs for XML
Other than the general diagnostics, there are XML plug-in specific actions that the user can perform.
6.1.1.11.1. Verifying the state of the XML language server
Procedure
-
Open a terminal in the container named
vscode-xml-<xxx>. Run
ps aux | grep javato verify that the XML language server has started. If the process is running, the output is:java ***/org.eclipse.ls4xml-uber.jar`
If is not, see the Checking important logs chapter.
6.1.1.11.2. Checking XML language server feature flags
Procedure
Check if the features are enabled. The XML plug-in provides multiple settings that can enable and disable features:
-
xml.format.enabled: Enable the formatter -
xml.validation.enabled: Enable the validation -
xml.documentSymbols.enabled: Enable the document symbols
-
-
To diagnose whether the XML language server is working, create a simple XML element, such as
<hello></hello>, and confirm that it appears in the Outline panel on the right. -
If the document symbols do not show, ensure that the
xml.documentSymbols.enabledattribute is set totrue. If it istrue, and there are no symbols, the language server may not be hooked to the editor. If there are document symbols, then the language server is connected to the editor. -
Ensure that the features that the user needs, are set to
truein the settings (they are set totrueby default). If any of the features are not working, or not working as expected, file an issue against the Language Server.
6.1.1.11.3. Enabling XML Language Server Protocol (LSP) tracing
Procedure
To log LSP messages to the VS Code Output view, enable tracing by setting the xml.trace.server attribute to verbose.
6.1.1.11.4. Viewing the XML language server log
Procedure
The log from the language server can be found in the plug-in sidecar at /home/theia/.theia/workspace-storage/<workspace_name>/redhat.vscode-xml/lsp4xml.log.
6.1.1.12. Viewing logs for YAML
This section describes the YAML plug-in specific actions that the user can perform, in addition to the general diagnostics ones.
6.1.1.12.1. Verifying the state of the YAML language server
This section describes how to verify the state of the YAML language server.
Procedure
Check if the container running the YAML plug-in is running the YAML language server.
-
In the editor, open a terminal in the container that is running the YAML plug-in (an example name of the container:
vscode-yaml-<xxx>). -
In the terminal, run the
ps aux | grep nodecommand. This command searches all the node processes running in the current container. Verify that a command
node **/server.jsis running.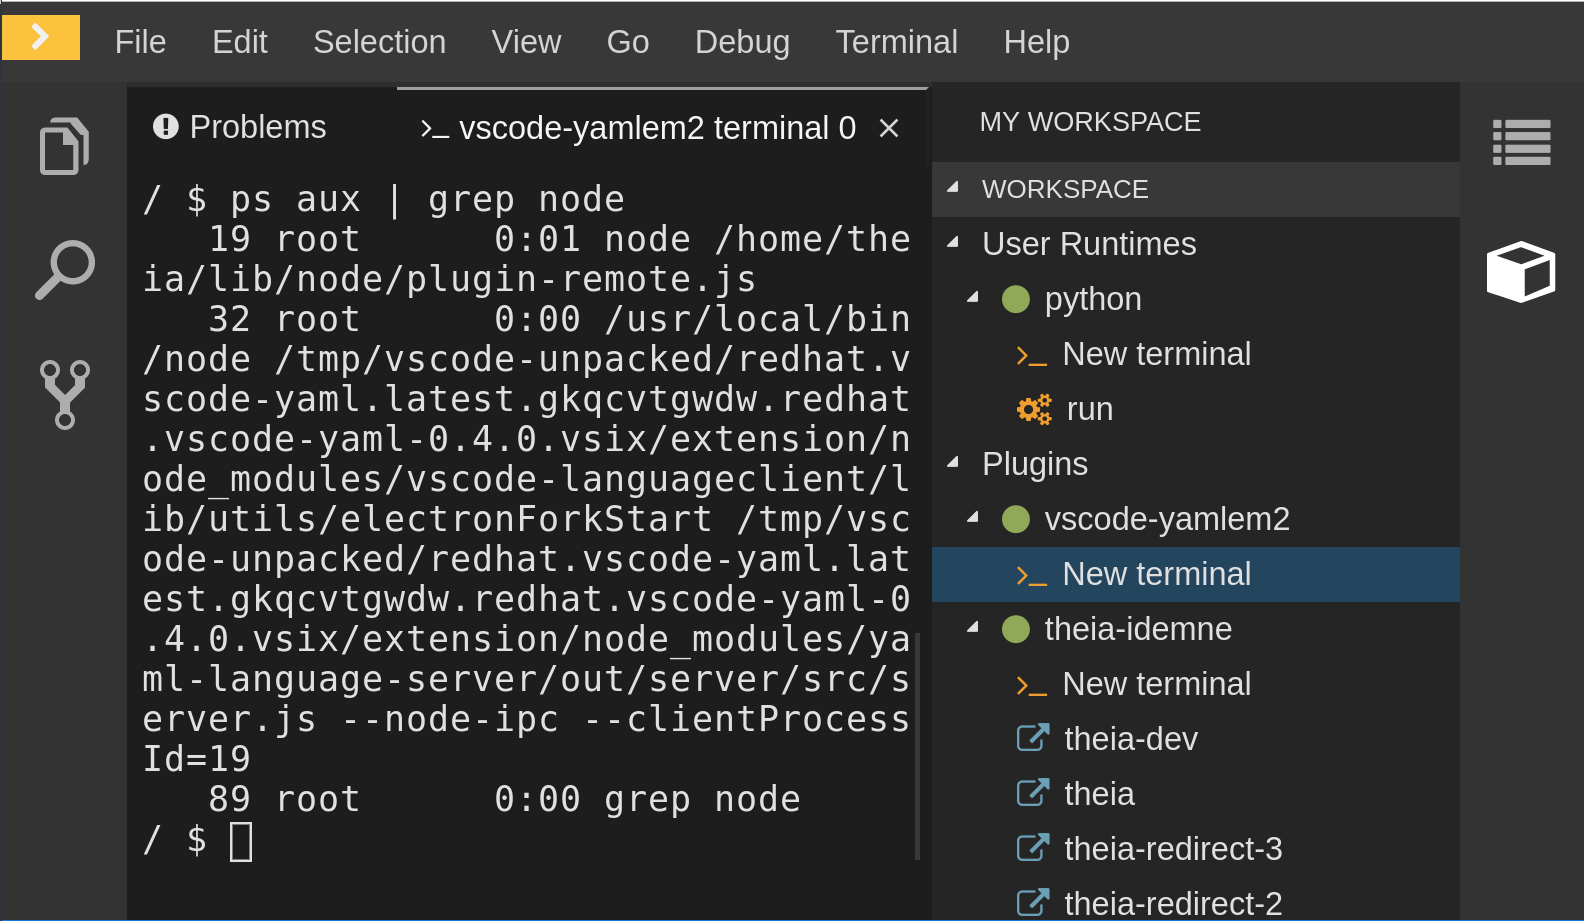
The node **/server.js running in the container indicates that the language server is running. If it is not running, the language server has not started inside the container. In this case, see Checking important logs.
6.1.1.12.2. Checking the YAML language server feature flags
Procedure
To check the feature flags:
Check if the features are enabled. The YAML plug-in provides multiple settings that can enable and disable features, such as:
-
yaml.format.enable: Enables the formatter -
yaml.validate: Enables validation -
yaml.hover: Enables the hover function -
yaml.completion: Enables the completion function
-
-
To check if the plug-in is working, type the simplest YAML, such as
hello: world, and then open the Outline panel on the right side of the editor. - Verify if there are any document symbols. If yes, the language server is connected to the editor.
-
If any feature is not working, make sure that the settings listed above are set to
true(they are set totrueby default). If a feature is not working, file an issue against the Language Server.
6.1.1.12.3. Enabling YAML Language Server Protocol (LSP) tracing
Procedure
To log LSP messages to the VS Code Output view, enable tracing by setting the yaml.trace.server attribute to verbose.
6.1.1.13. Viewing logs for Dotnet with OmniSharp-Theia plug-in
6.1.1.13.1. OmniSharp-Theia plug-in
CodeReady Workspaces uses the OmniSharp-Theia plug-in as a remote plug-in. It is located at github.com/redhat-developer/omnisharp-theia-plugin. In case of an issue, report it, or contribute your fix in the repository.
This plug-in registers omnisharp-roslyn as a language server and provides project dependencies and language syntax for C# applications.
The language server runs on .NET SDK 2.2.105.
6.1.1.13.2. Verifying the state of the OmniSharp-Theia plug-in language server
Procedure
To check if the container running the OmniSharp-Theia plug-in is running OmniSharp, execute the ps aux | grep OmniSharp.exe command. If the process is running, the following is an example output:
/tmp/theia-unpacked/redhat-developer.che-omnisharp-plugin.0.0.1.zcpaqpczwb.omnisharp_theia_plugin.theia/server/bin/mono
/tmp/theia-unpacked/redhat-developer.che-omnisharp-plugin.0.0.1.zcpaqpczwb.omnisharp_theia_plugin.theia/server/omnisharp/OmniSharp.exe
If the output is different, the language server has not started inside the container. Check the logs described in Checking important logs.
6.1.1.13.3. Checking OmniSharp Che-Theia plug-in language server features
Procedure
-
If the OmniSharp.exe process is running, check if the language server features are working by opening a
.csfile and trying the hover or completion features, or opening the Problems or Outline view.
6.1.1.13.4. Viewing OmniSharp-Theia plug-in logs in the Output panel
Procedure
If OmniSharp.exe is running, it logs all information in the Output panel. To view the logs, open the Output view and select C# from the drop-down list.
6.1.1.14. Viewing logs for Dotnet with NetcoredebugOutput plug-in
6.1.1.14.1. NetcoredebugOutput plug-in
The NetcoredebugOutput plug-in provides the netcoredbg tool. This tool implements the VS Code Debug Adapter protocol and allows users to debug .NET applications under the .NET Core runtime.
The container where the NetcoredebugOutput plug-in is running contains Dotnet SDK v.2.2.105.
6.1.1.14.2. Verifying the state of the NetcoredebugOutput plug-in
Procedure
Search for a
netcoredbgdebug configuration in thelaunch.jsonfile.Example 6.1. Sample debug configuration
{ "type": "netcoredbg", "request": "launch", "program": "${workspaceFolder}/bin/Debug/<target-framework>/<project-name.dll>", "args": [], "name": ".NET Core Launch (console)", "stopAtEntry": false, "console": "internalConsole" }-
Test the autocompletion feature within the braces of the
configurationsection of thelaunch.jsonfile. If you can findnetcoredbg, the Che-Theia plug-in is correctly initialized. If not, see Checking important logs.
6.1.1.14.3. Viewing NetcoredebugOutput plug-in logs in the Output panel
This section describes how to view NetcoredebugOutput plug-in logs in the Output panel.
Procedure
Open the Debug console.

6.1.1.15. Viewing logs for Camel
6.1.1.15.1. Verifying the state of the Camel language server
Procedure
The user can inspect the log output of the sidecar container using the Camel language tools that are stored in the vscode-apache-camel<xxx> Camel container.
To verify the state of the language server:
-
Open a terminal inside the
vscode-apache-camel<xxx>container. Run the
ps aux | grep javacommand. The following is an example language server process:java -jar /tmp/vscode-unpacked/camel-tooling.vscode-apache-camel.latest.euqhbmepxd.camel-tooling.vscode-apache-camel-0.0.14.vsix/extension/jars/language-server.jar
- If you cannot find it, see Checking important logs.
6.1.1.15.2. Viewing Camel logs in the Output panel
The Camel language server is a SpringBoot application that writes its log to the $\{java.io.tmpdir}/log-camel-lsp.out file. Typically, $\{java.io.tmpdir} points to the /tmp directory, so the filename is /tmp/log-camel-lsp.out.
Procedure
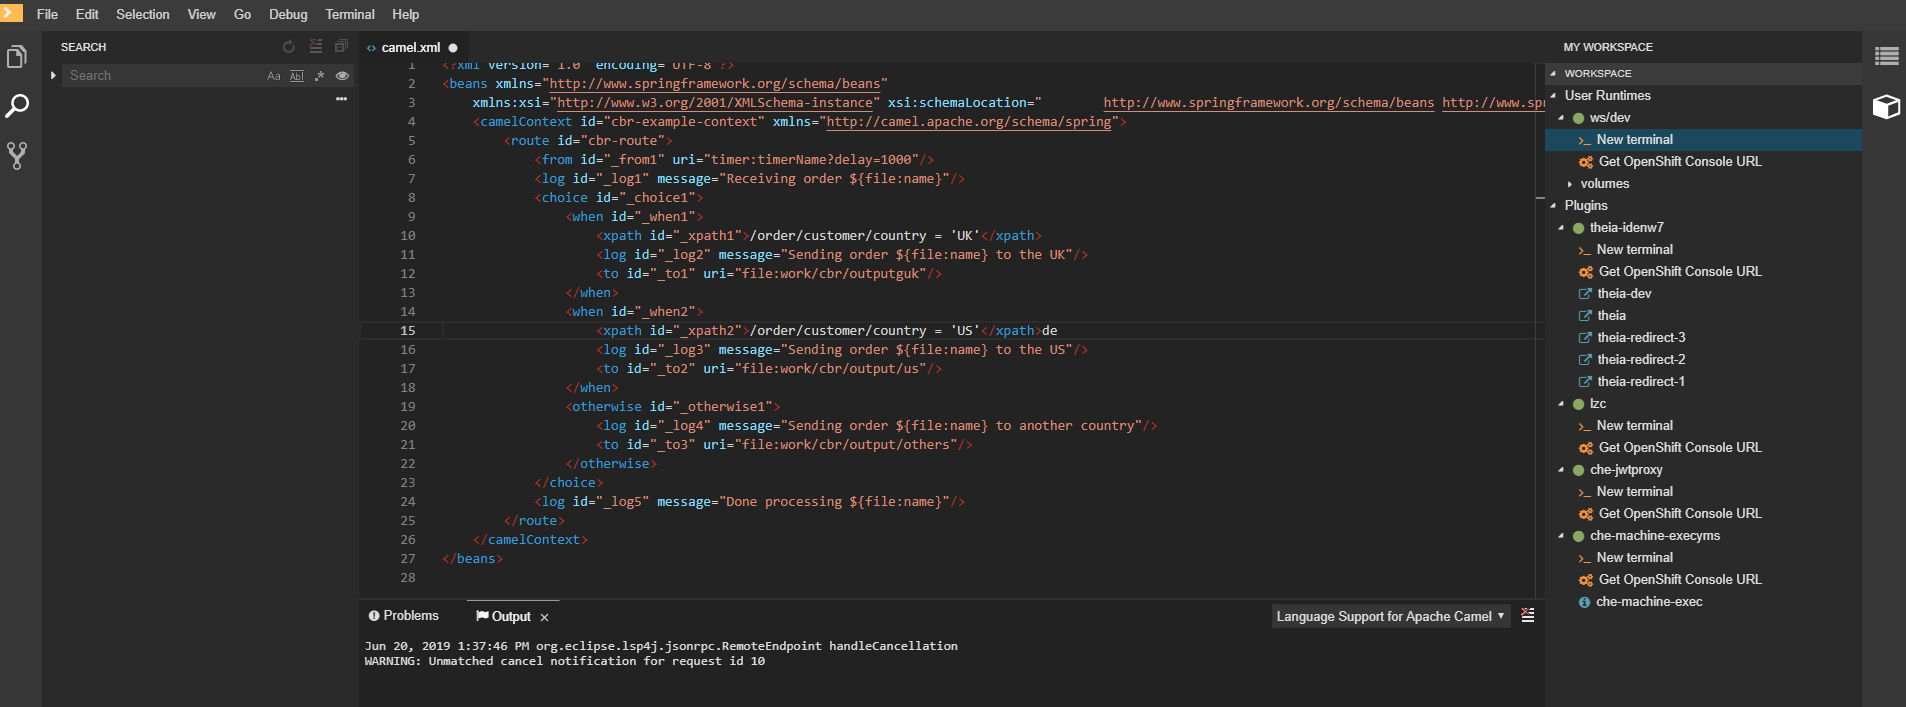
The Camel language server logs are printed in the Output channel named Language Support for Apache Camel.
The output channel is created only at the first created log entry on the client side. It may be absent when everything is going well.
6.1.2. Viewing Che-Theia IDE logs
This section describes how to view Che-Theia IDE logs.
6.1.2.1. Viewing Che-Theia editor logs using the OpenShift CLI
Observing Che-Theia editor logs helps to get a better understanding and insight over the plug-ins loaded by the editor. This section describes how to access the Che-Theia editor logs using the OpenShift CLI (command-line interface).
Prerequisites
- CodeReady Workspaces is deployed in an OpenShift cluster.
- A workspace is created.
- User is located in a CodeReady Workspaces installation project.
Procedure
Obtain the list of the available Pods:
$ oc get pods
Example
$ oc get pods
NAME                                              READY  STATUS   RESTARTS  AGE
codeready-9-xz6g8                                 1/1    Running  1         15h
workspace0zqb2ew3py4srthh.go-cli-549cdcf69-9n4w2  4/4    Running  0         1h
Obtain the list of the available containers in the particular Pod:
$ oc get pods <name-of-pod> --output jsonpath='\{.spec.containers[*].name}'Example:
$ oc get pods workspace0zqb2ew3py4srthh.go-cli-549cdcf69-9n4w2 -o
jsonpath='\{.spec.containers[*].name}'
> go-cli che-machine-exechr7 theia-idexzb vscode-gox3r
Get logs from the
theia/idecontainer:$ oc logs --follow <name-of-pod> --container <name-of-container>
Example:
$ oc logs --follow workspace0zqb2ew3py4srthh.go-cli-549cdcf69-9n4w2 -container
theia-idexzb
>root INFO unzipping the plug-in 'task_plugin.theia' to directory: /tmp/theia-unpacked/task_plugin.theia
root INFO unzipping the plug-in 'theia_yeoman_plugin.theia' to directory: /tmp/theia-unpacked/theia_yeoman_plugin.theia
root WARN A handler with prefix term  is already registered.
root INFO [nsfw-watcher: 75] Started watching: /home/theia/.theia
root WARN e.onStart is slow, took: 367.4600000013015 ms
root INFO [nsfw-watcher: 75] Started watching: /projects
root INFO [nsfw-watcher: 75] Started watching: /projects/.theia/tasks.json
root INFO [4f9590c5-e1c5-40d1-b9f8-ec31ec3bdac5] Sync of 9 plugins took: 62.26000000242493 ms
root INFO [nsfw-watcher: 75] Started watching: /projects
root INFO [hosted-plugin: 88] PLUGIN_HOST(88) starting instance
6.2. Investigating failures at a workspace start using the Verbose mode
Verbose mode allows users to reach an enlarged log output, investigating failures at a workspace start.
In addition to usual log entries, the verbose mode also lists the container logs of each workspace.
6.2.1. Restarting a CodeReady Workspaces workspace in verbose mode after start failure
This section describes how to restart a CodeReady Workspaces workspace in the Verbose mode after a failure during the workspace start. Dashboard proposes the restart of a workspace in the Verbose mode once the workspace fails at its start.
Prerequisites
- A running instance of CodeReady Workspaces. To install an instance of CodeReady Workspaces, see Installing CodeReady Workspaces.
- An existing workspace that fails to start.
Procedure
- Using Dashboard, try to start a workspace.
- When it fails to start, click on the displayed Restart in Verbose Mode link.
- Check the Logs tab to find a reason for the workspace failure.
6.2.2. Starting a CodeReady Workspaces workspace in verbose mode
This section describes how to start the Red Hat CodeReady Workspaces workspace in verbose mode.
Prerequisites
- A running instance of Red Hat CodeReady Workspaces. To install an instance of Red Hat CodeReady Workspaces, see Installing CodeReady Workspaces.
- An existing workspace defined on this instance of CodeReady Workspaces.
Procedure
- Open the Workspaces tab.
- On the left side of a row dedicated to the workspace, access the drop-down menu displayed as three horizontal dots and select the Open in Verbose Mode option. Alternatively, this option is also available in the workspace details, under the Actions drop-down menu.
- Check the Logs tab to find a reason for the workspace failure.
6.3. Troubleshooting slow workspaces
Sometimes, workspaces can take a long time to start. Tuning can reduce this start time. Depending on the options, administrators or users can do the tuning.
This section includes several tuning options for starting workspaces faster or improving workspace runtime performance.
6.3.1. Improving workspace start time
- Caching images with Image Puller
Role: Administrator
When starting a workspace, OpenShift pulls the images from the registry. A workspace can include many containers meaning that OpenShift pulls Pod’s images (one per container). Depending on the size of the image and the bandwidth, it can take a long time.
Image Puller is a tool that can cache images on each of OpenShift nodes. As such, pre-pulling images can improve start times. See Caching images for faster workspace start.
- Choosing better storage type
Role: Administrator and user
Every workspace has a shared volume attached. This volume stores the project files, so that when restarting a workspace, changes are still available. Depending on the storage, attach time can take up to a few minutes, and I/O can be slow.
To avoid this problem, use ephemeral or asynchronous storage. See Configuring storage types.
- Installing offline
Role: Administrator
Components of CodeReady Workspaces are OCI images. Setup Red Hat CodeReady Workspaces in offline mode (air-gap scenario) to allow for reducing any extra download at runtime as everything needs to be present from the beginning. See https://access.redhat.com/documentation/en-us/red_hat_codeready_workspaces/2.8/html-single/installation_guide/index#installing-codeready-workspaces-in-a-restricted-environment_crw.
- Optimizing workspace plug-ins
Role: User
When selecting various plug-ins, each plug-in can bring its own sidecar container, which is an OCI image. OpenShift pulls the images of these sidecar containers.
Reduce the number of plug-ins, or disable them to see if start time is faster. See also Caching images for faster workspace start.
- Reducing the number of public endpoints
Role: Administrator
For each endpoint, OpenShift is creating OpenShift Route objects. Depending on the underlying configuration, this creation can be slow.
To avoid this problem, reduce the exposure. For example, to automatically detect a new port listening inside containers and redirect traffic for the processes using a local IP address (
127.0.0.1), the Che-Theia IDE plug-in has three optional routes.By reducing the number of endpoints and checking endpoints of all plug-ins, workspace start can be faster.
- CDN configuration
The IDE editor uses a CDN (Content Delivery Network) to serve content. Check that the content uses a CDN to the client (or a local route for offline setup).
To check that, open Developer Tools in the browser and check for
vendorsin the Network tab.vendors.<random-id>.jsoreditor.main.*should come from CDN URLs.
6.3.2. Improving workspace runtime performance
- Providing enough CPU resources
Plug-ins consume CPU resources. For example, when a plug-in provides IntelliSense features, adding more CPU resources may lead to better performance.
Ensure the CPU settings in the devfile definition,
devfile.yaml, are correct:apiVersion: 1.0.0 components: - type: chePlugin id: id/of/plug-in cpuLimit: 1360Mi 1 cpuRequest: 100m 2- Providing enough memory
Plug-ins consume CPU and memory resources. For example, when a plug-in provides IntelliSense features, collecting data can consume all the memory allocated to the container.
Providing more memory to the plug-in can increase performance. Ensure about the correctness of memory settings:
-
in the plug-in definition -
meta.yamlfile in the devfile definition -
devfile.yamlfileapiVersion: v2 spec: containers: - image: "quay.io/my-image" name: "vscode-plugin" memoryLimit: "512Mi" 1 extensions: - https://link.to/vsix- 1
- Specifies the memory limit for the plug-in.
In the devfile definition (
devfile.yaml):apiVersion: 1.0.0 components: - type: chePlugin id: id/of/plug-in memoryLimit: 1048M 1 memoryRequest: 256M- 1
- Specifies the memory limit for this plug-in.
-
in the plug-in definition -
- Choosing better storage type
- Use ephemeral or asynchronous storage for faster I/O. See Configuring storage types.
6.4. Troubleshooting network problems
This section describes how to prevent or resolve issues related to network policies. CodeReady Workspaces requires the availability of the WebSocket Secure (WSS) connections. Secure WebSocket connections improve confidentiality and also reliability because they reduce the risk of interference by bad proxies.
Prerequisites
- The WebSocket Secure (WSS) connections on port 443 must be available on the network. Firewall and proxy may need additional configuration.
Use a supported web browser:
- Chrome
- Firefox
Procedure
- Verify the browser supports the WebSocket protocol. See: Searching a websocket test.
- Verify firewalls settings: WebSocket Secure (WSS) connections on port 443 must be available.
- Verify proxy servers settings: The proxy transmits and intercepts WebSocket Secure (WSS) connections on port 443.