
Chapter 3. Monitoring CodeReady Workspaces
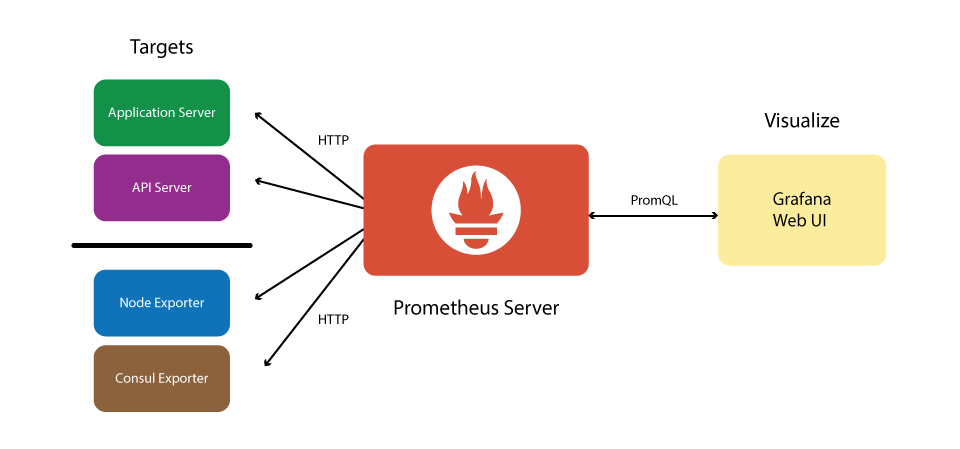
CodeReady Workspaces can expose certain data as metrics, that can be processed by Prometheus and Grafana stack. Prometheus is a monitoring system, that maintains the collection of metrics - time series key-value data which can represent consumption of resources like CPU and memory, amount of processed HTTP queries and their execution time, and CodeReady Workspaces specific resources, such as number of users and workspaces, the start and shutdown of workspaces, information about JsonRPC stack.
Prometheus is powered with a special query language, that allows manipulating the collected data, and perform various binary, vector and aggregation operations with it, to help create a more refined view on data.
While Prometheus is the central piece, responsible for scraping and storing the metrics, while Grafana offers a front-end "facade" with tools to create a various visual representation in the form of dashboards with various panels and graph types.
Note that this monitoring stack is not an official production-ready solution, but rather has an introduction purpose.
Figure 3.1. The structure of CodeReady Workspaces monitoring stack
3.1. Enabling CodeReady Workspaces metrics collections
Prerequisites
- Installed Prometheus 2.9.1 or above. See more https://prometheus.io/docs/introduction/first_steps/.
- Installed Grafana 6.0 or above. See more at https://grafana.com/docs/installation/
Procedure
-
Set the
CHE_METRICS_ENABLED=trueenvironment variable -
Expose the
8087port as a service on the che-master host -
Configure Prometheus to scrape metrics from the
8087port - Configure a Prometheus data source on Grafana
- Deploy CodeReady Workspaces-specific dashboards on Grafana
3.2. Collecting CodeReady Workspaces metrics with Prometheus
Prometheus is a monitoring system that collects metrics in real time and stores them in a time series database.
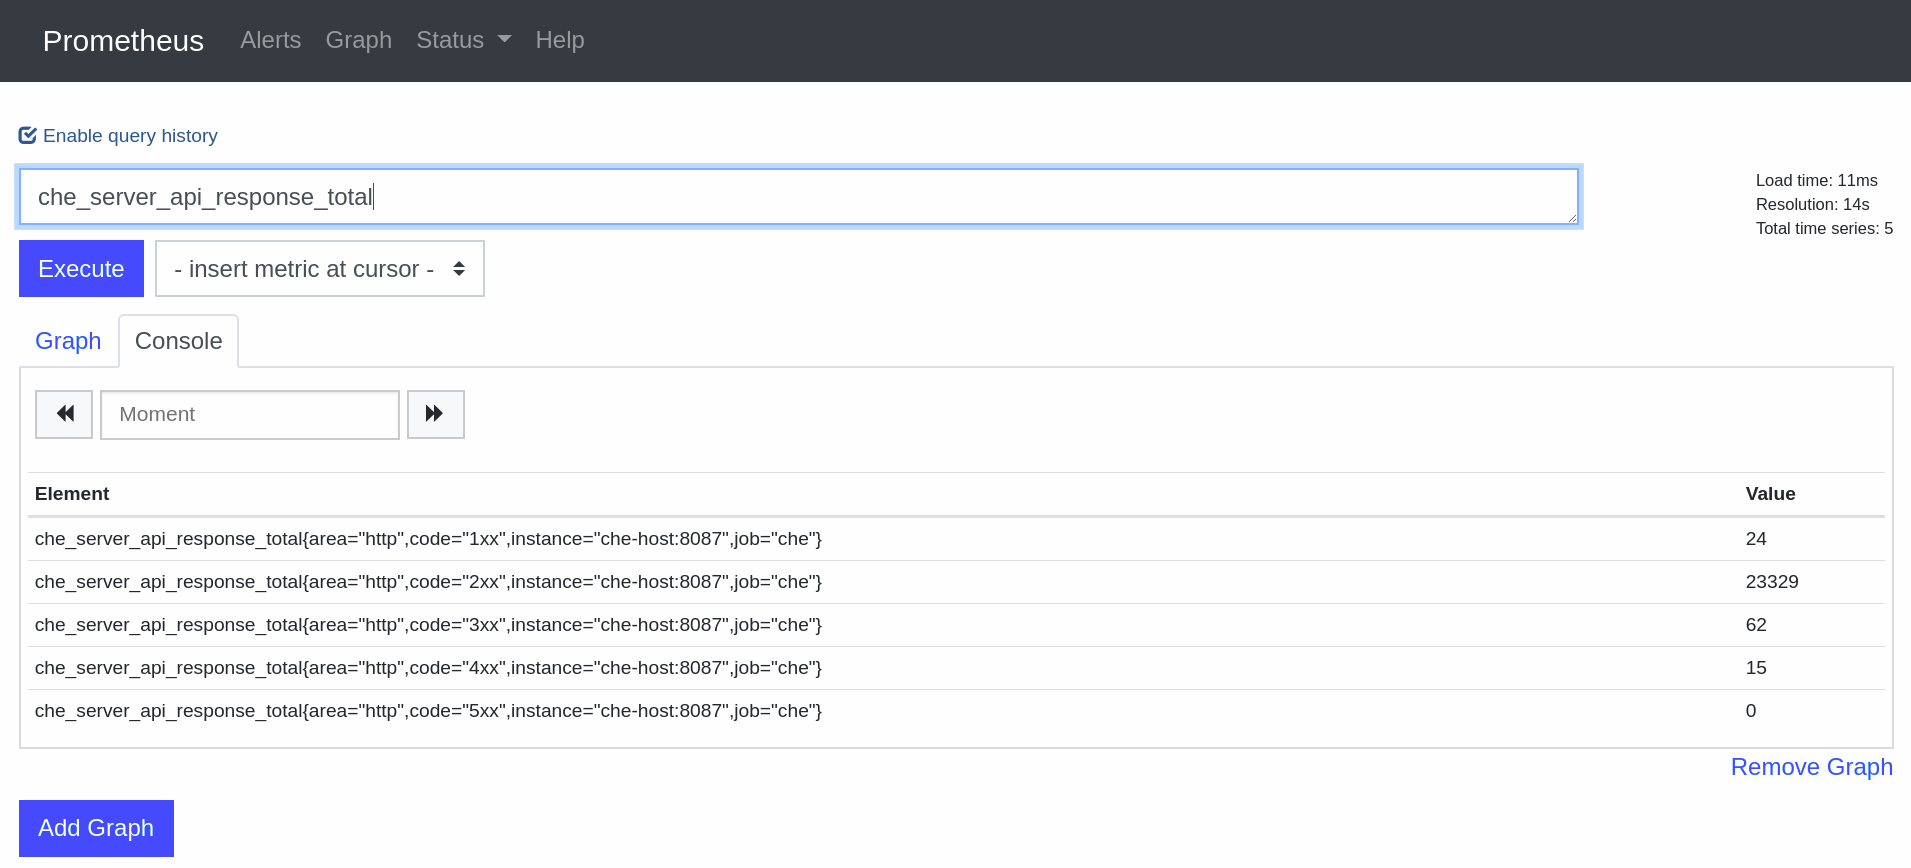
Prometheus comes with a console accessible at the 9090 port of the application pod. By default, a template provides an existing service and a route to access it. It can be used to query and view metrics.
3.2.1. Prometheus terminology
Prometheus offers:
- counter
- the simplest numerical type of metric whose value can be only increased. A typical example is counting the amount of HTTP requests that go through the system.
- gauge
- numerical value that can be increased or decreased. Best suited for representing values of objects.
- histogram
- a more complex metric that is suited for performing observations. Metrics are collected and grouped in configurable buckets, which allwos to present the results, for instance, in a form of a heatmap.
3.2.2. Configuring Prometheus
Prometheus configuration
- apiVersion: v1
  data:
    prometheus.yml: |-
      global:
        scrape_interval:     5s           1
        evaluation_interval: 5s           2
      scrape_configs:
        - job_name: 'che'
          static_configs:
            - targets: ['che-host:8087']
  kind: ConfigMap
  metadata:
    name: prometheus-config
3.3. Viewing CodeReady Workspaces metrics on Grafana dashboards
Grafana is used for informative representation of Prometheus metrics. Providing visibility for OpenShift, Grafana’s deployment configuration and ConfigMaps are located in the che-monitoring.yaml configuration file.
3.3.1. Configuring and deploying Grafana
Grafana is run on port 3000 with a corresponding service and route.
Three ConfigMaps are used to configure Grafana:
-
grafana-datasources— configuration for Grafana datasource, a Prometheus endpoint -
grafana-dashboards— configuration of Grafana dashboards and panels -
grafana-dashboard-provider— configuration of the Grafana dashboard provider API object, which tells Grafana where to look in the file system for pre-provisioned dashboards
3.3.2. Grafana dashboards overview
CodeReady Workspaces provides several types of dashboards.
3.3.2.1. CodeReady Workspaces server dashboard
Use case: CodeReady Workspaces server-specific metrics related to CodeReady Workspaces components, such as workspaces or users.
Figure 3.2. The General panel
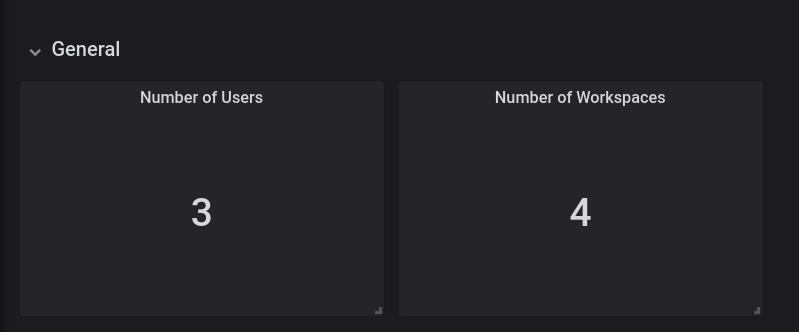
The General panel contains basic information, such as the total number of users and workspaces in the CodeReady Workspaces database.
Figure 3.3. The Workspaces panel
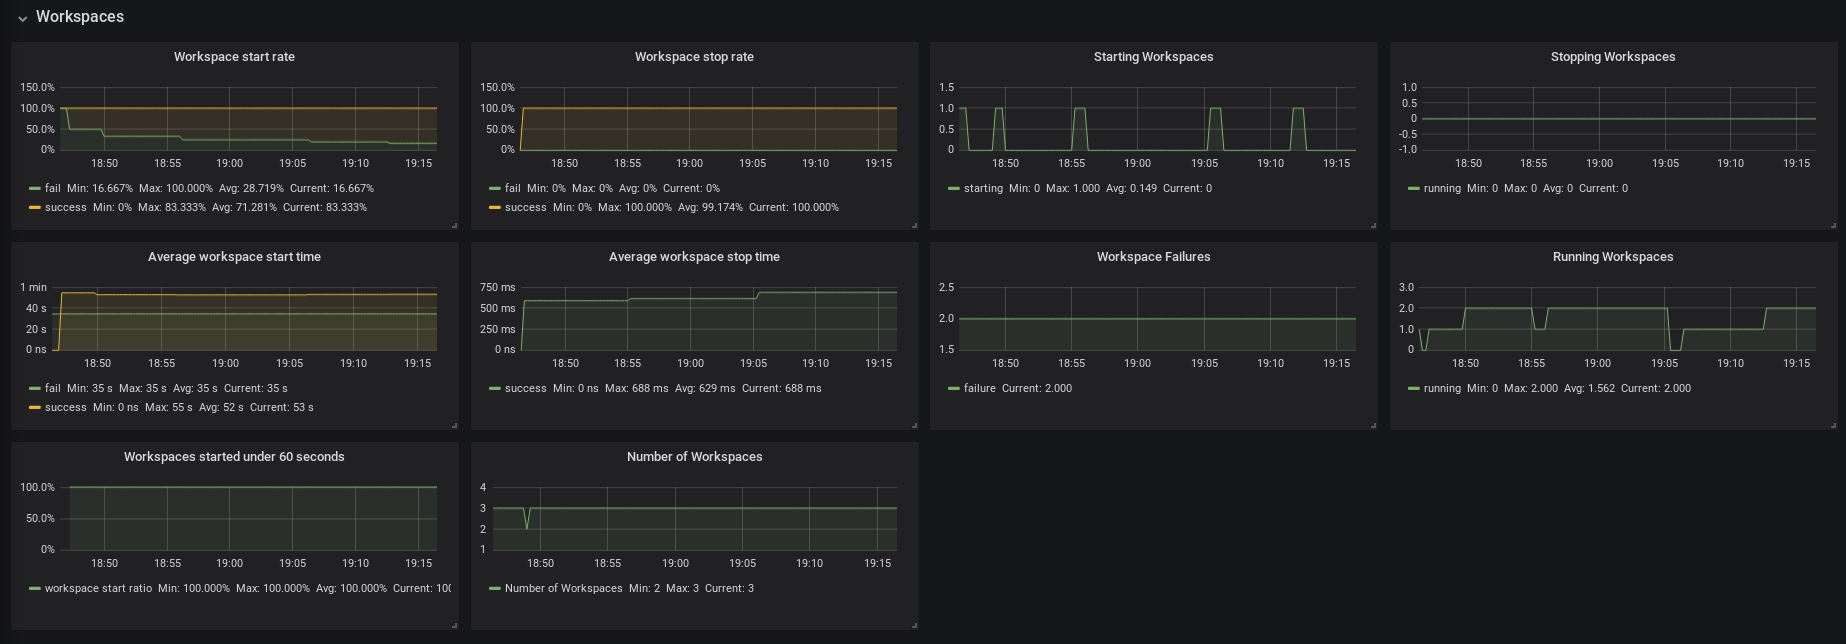
- Workspace start rate — the ratio between successful and failed started workspaces
- Workspace stop rate — the ratio between successful and failed stopped workspaces
- Workspace Failures — the number of workspace failures shown on the graph
- Starting Workspaces — the gauge that shows the number of currently starting workspaces
- Average Workspace Start Time — 1-hour average of workspace starts or fails
- Average Workspace Stop Time — 1-hour average of workspace stops
- Running Workspaces — the gauge that shows the number of currently running workspaces
- Stopping Workspaces — the gauge that shows the number of currently stopping workspaces
- Workspaces started under 60 seconds — the percentage of workspaces started under 60 seconds
- Number of Workspaces — the number of workspaces created over time
Figure 3.4. The Users panel
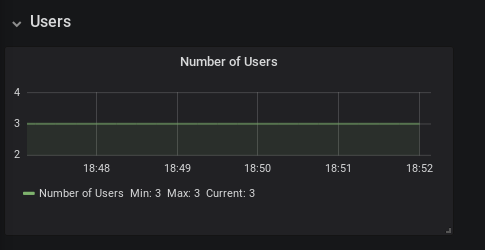
- Number of Users — the number of users known to CodeReady Workspaces over time
Figure 3.5. The Tomcat panel
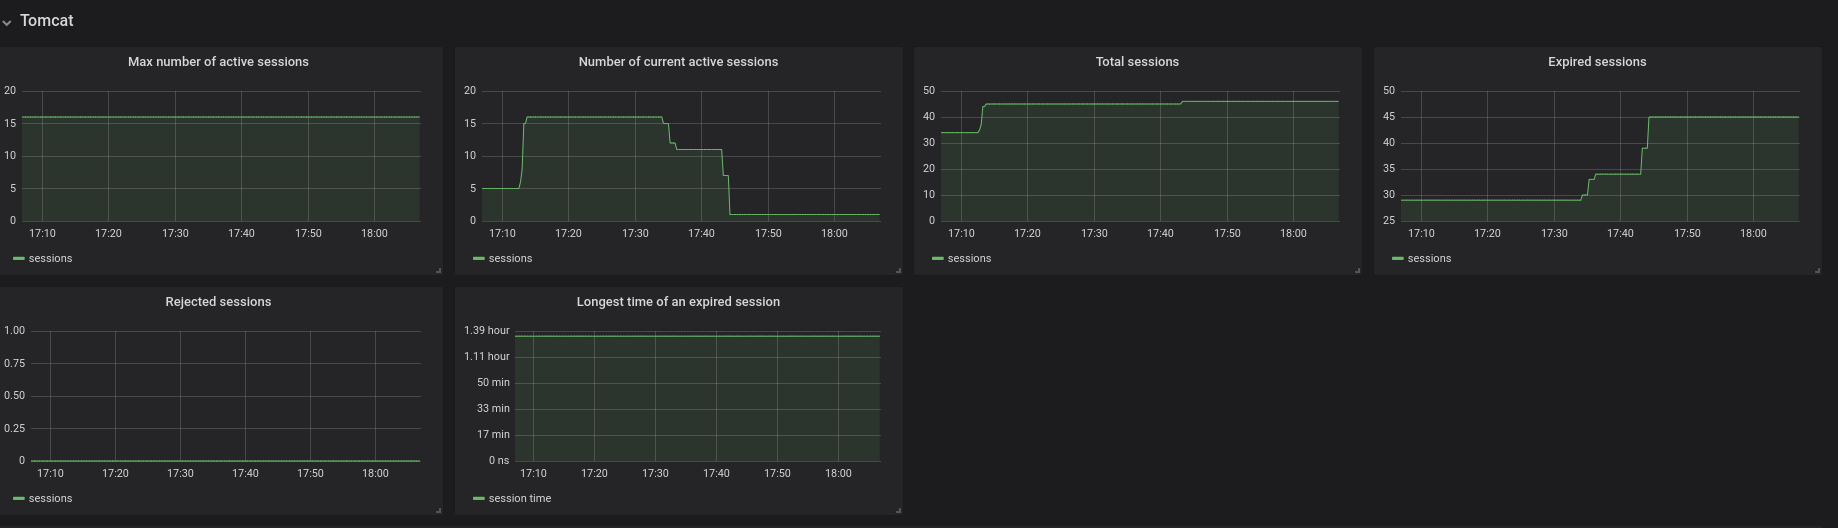
- Max number of active sessions — the max number of active sessions that have been active at the same time
- Number of current active sessions — the number of currently active sessions
- Total sessions — the total number of sessions
- Expired sessions — the number of sessions that have expired
- Rejected sessions — the number of sessions that were not created because the maximum number of active sessions was reached
- Longest time of an expired session — the longest time (in seconds) that an expired session had been alive
Figure 3.6. The Request panel
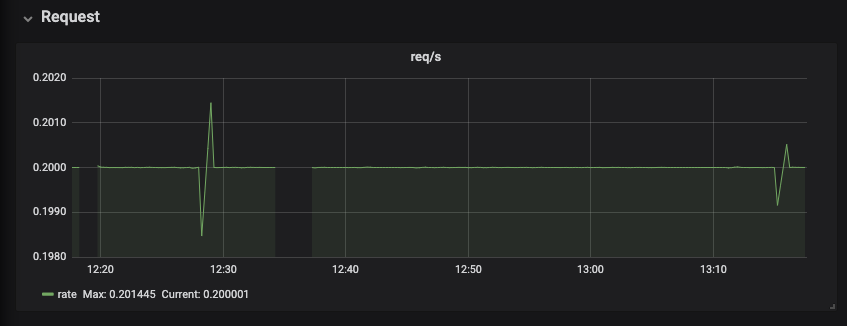
The Requests panel displays HTTP requests in a graph that shows the average number of requests per minute.
Figure 3.7. The Executors panel, part 1
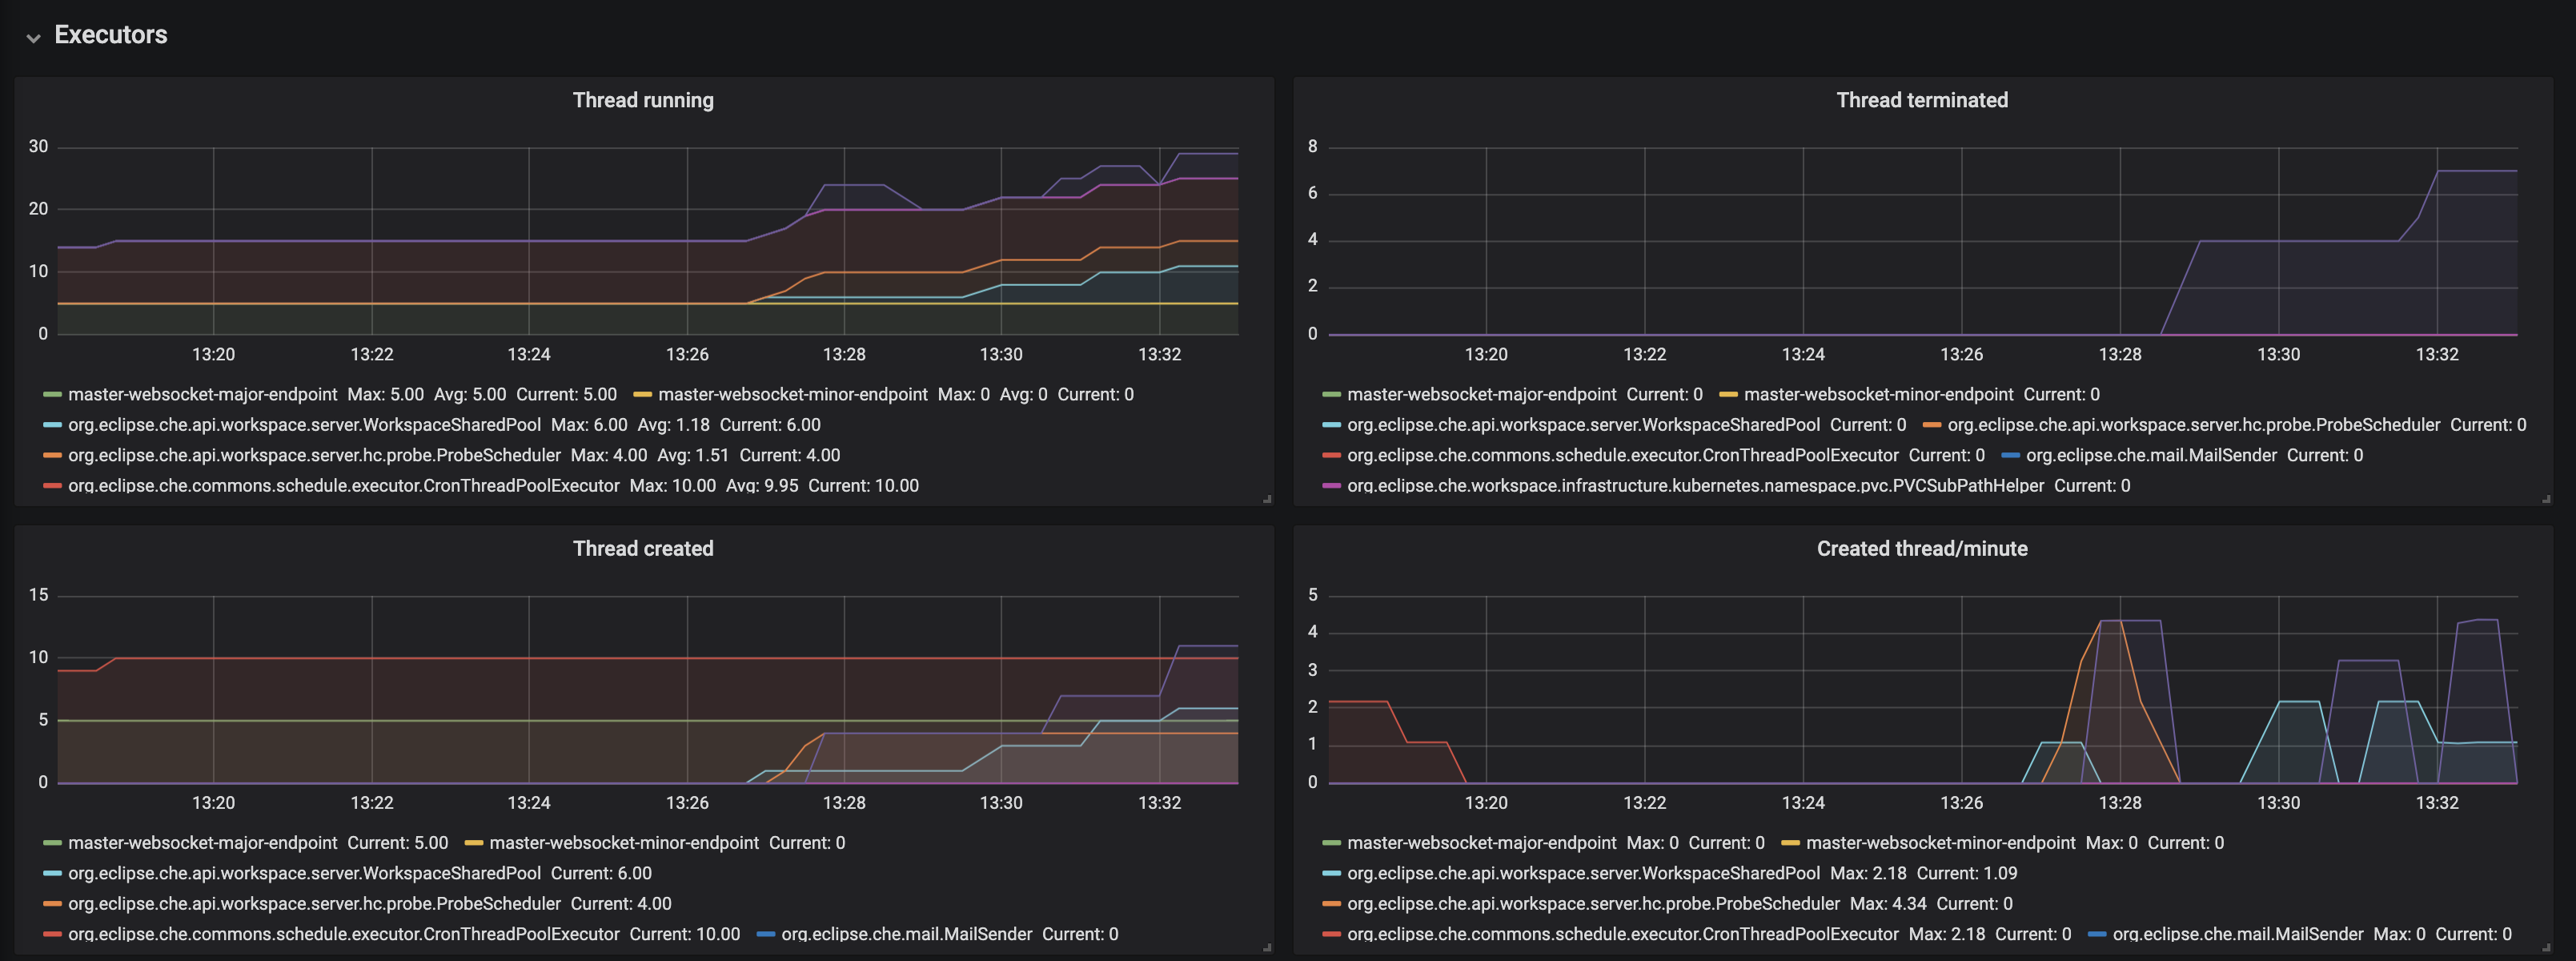
- Threads running - the number of threads that are not terminated aka alive. May include threads that are in a waiting or blocked state.
- Threads terminated - the number of threads that was finished its execution.
- Threads created - number of threads created by thread factory for given executor service.
- Created thread/minute - Speed of thread creating for the given executor service.
Figure 3.8. The Executors panel, part 2
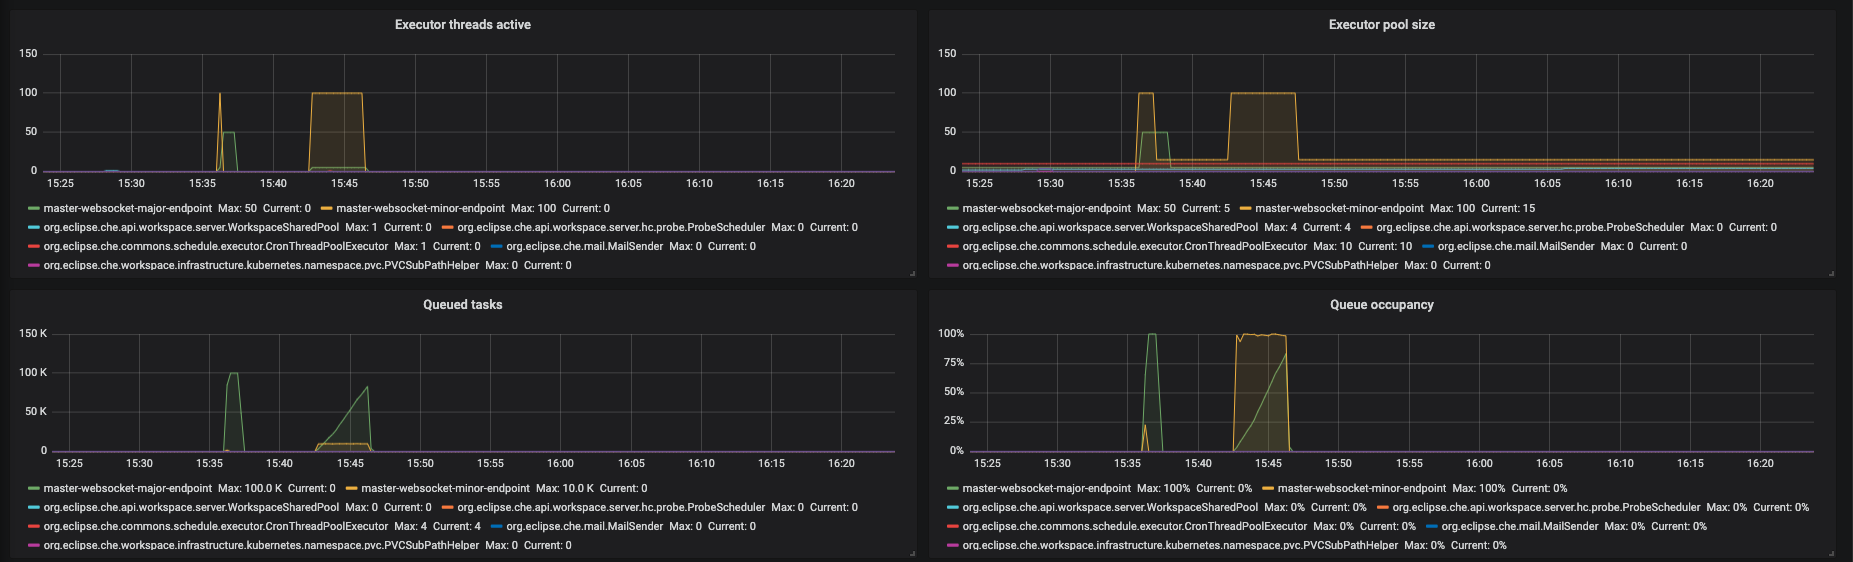
- Executor threads active - number of threads that actively execute tasks.
- Executor pool size - number of threads that actively execute tasks.
- Queued task - the approximate number of tasks that are queued for execution
- Queued occupancy - the percent of the queue used by the tasks that is waining for execution.
Figure 3.9. The Executors panel, part 3
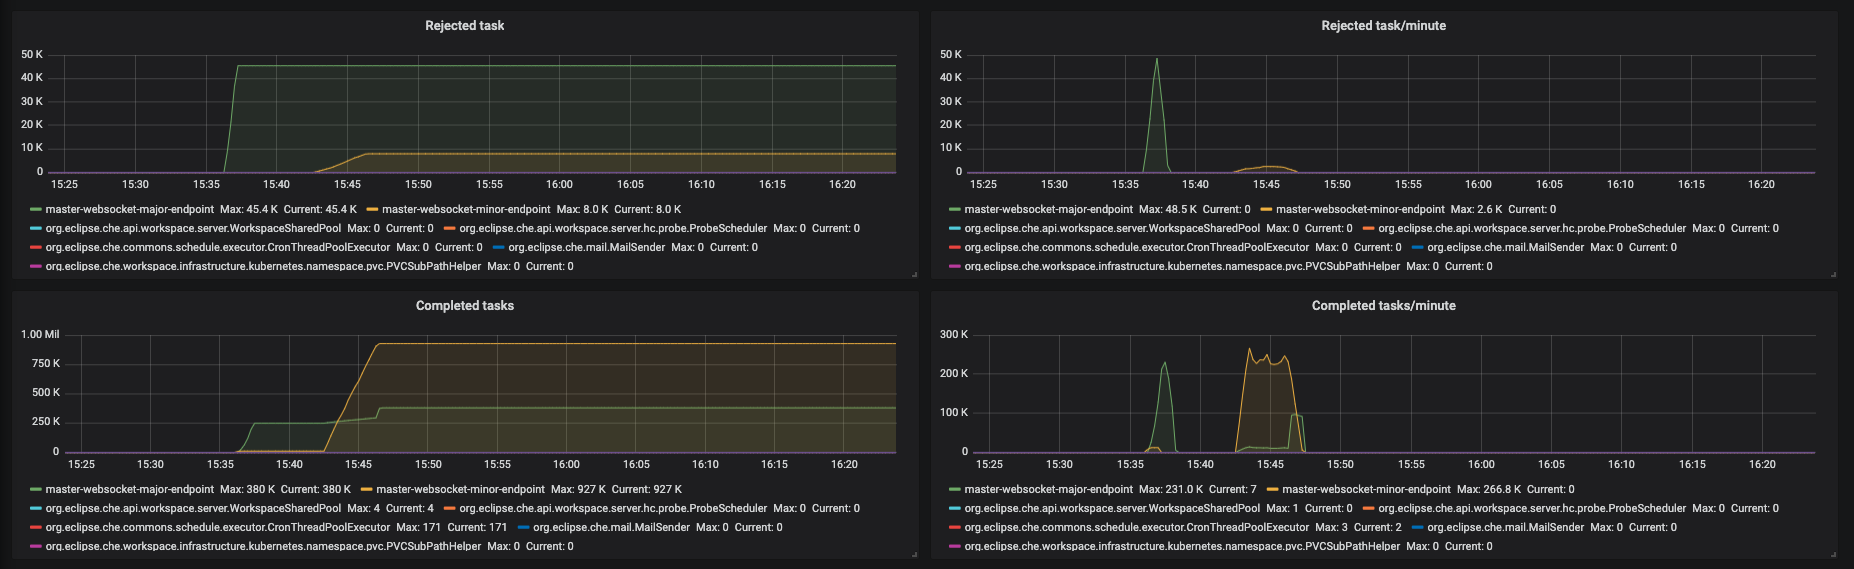
- Rejected task - the number of tasks that were rejected from execution.
- Rejected task/minute - the speed of task rejections
- Completed tasks - the number of completed tasks
- Completed tasks/minute - the speed of task execution
Figure 3.10. The Executors panel, part 4
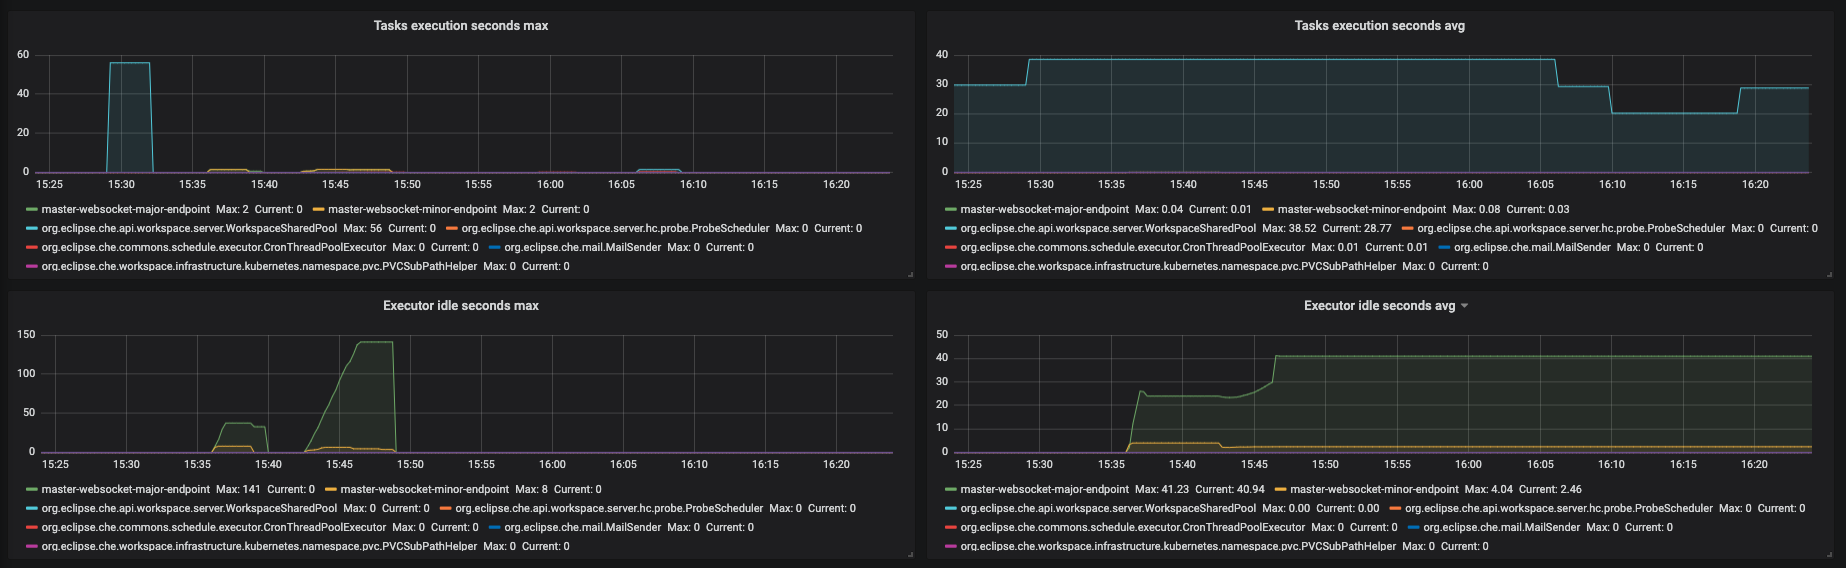
- Task execution seconds max - 5min moving maximum of task execution
- Tasks execution seconds avg - 1h moving average of task execution
- Executor idle seconds max - 5min moving maximum of executor idle state.
- Executor idle seconds avg - 1h moving average of executor idle state.
Figure 3.11. The Traces panel, part 1
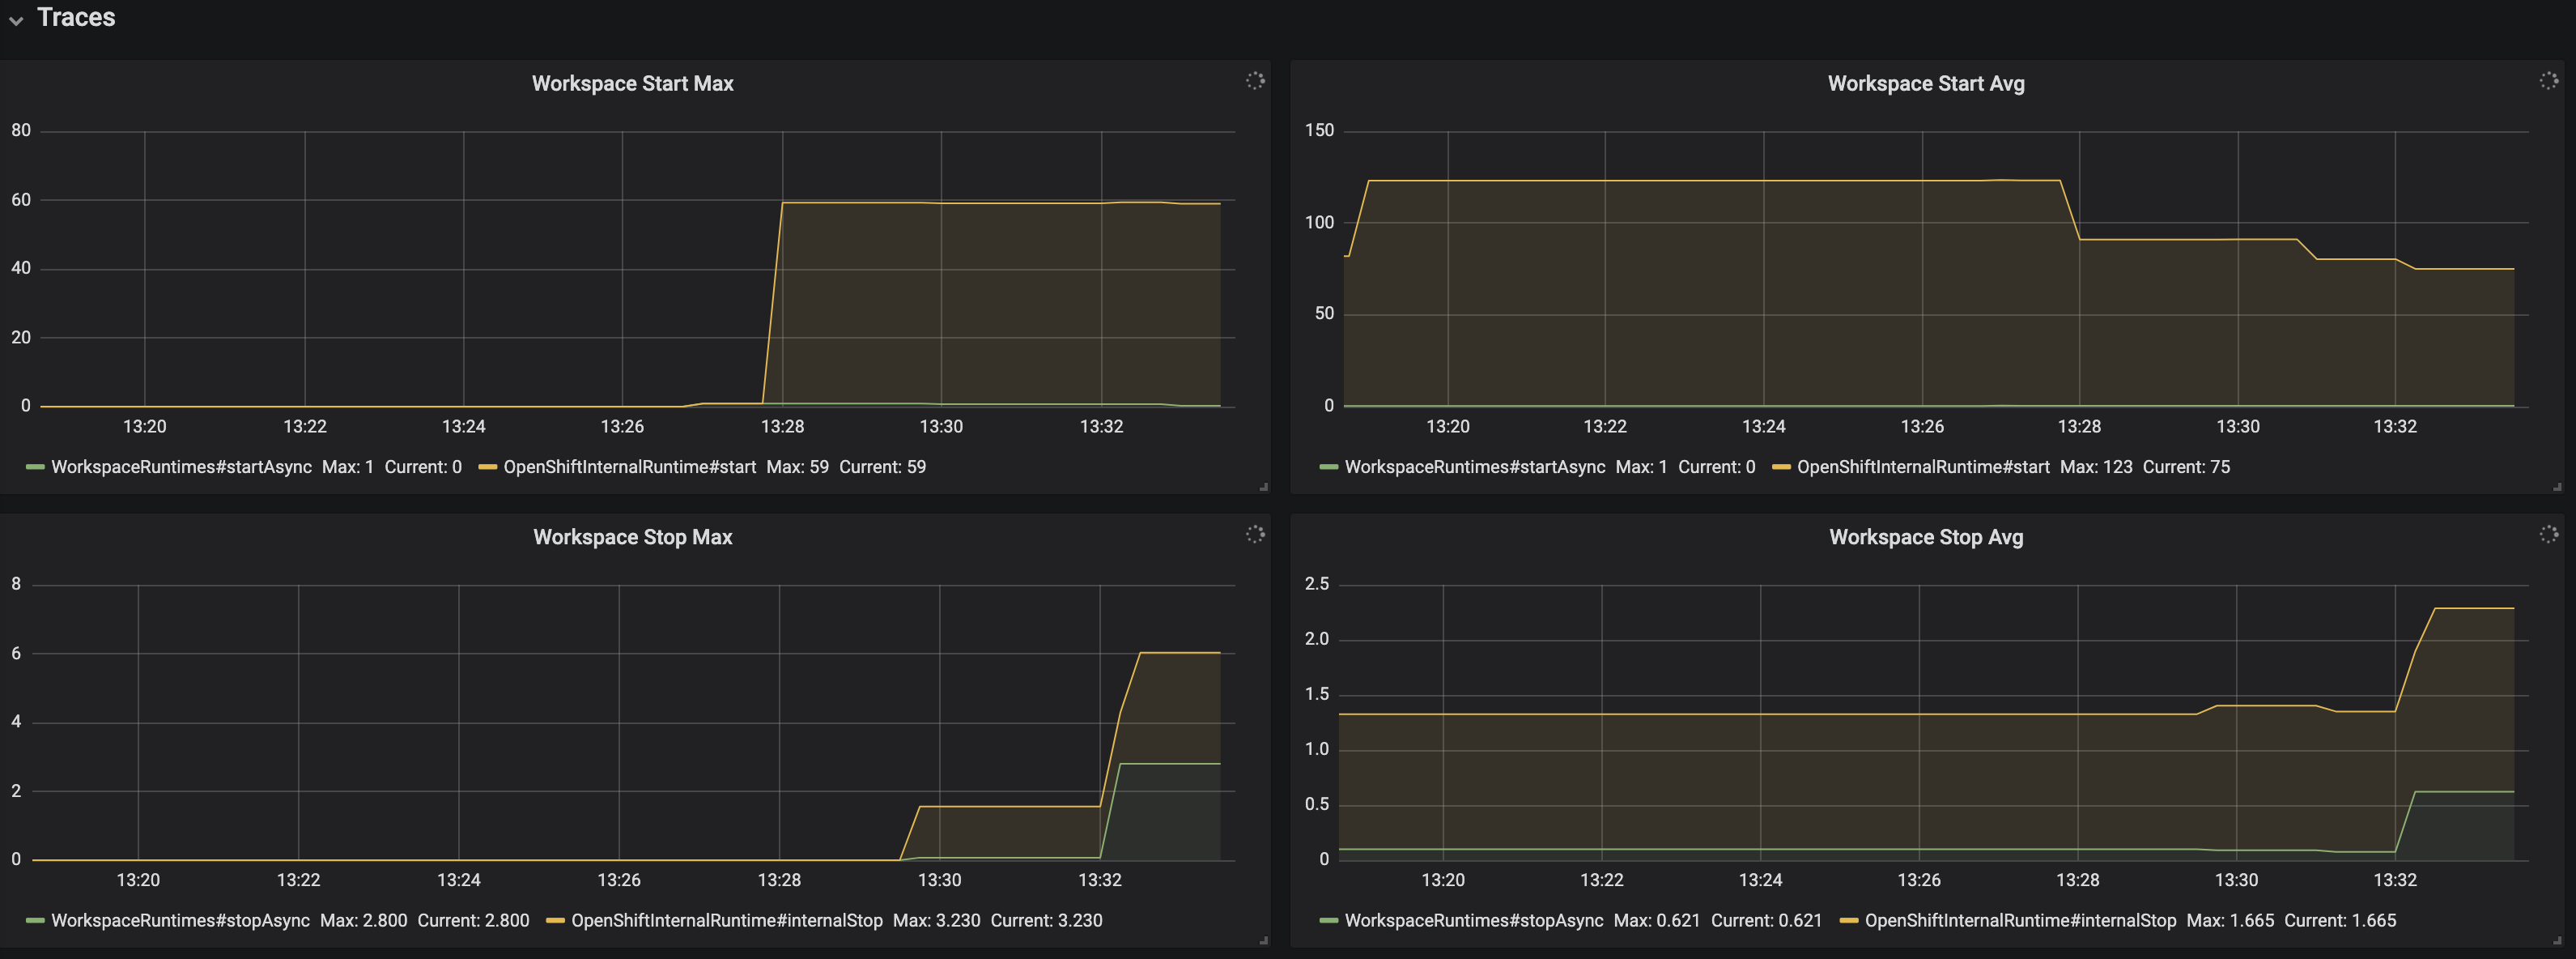
- Workspace start Max - maximum workspace start time
- Workspace start Avg - 1h moving average of the workspace start time components
- Workspace stop Max - maximum of workspace stop time
- Workspace stop Avg - 1h moving average of the workspace stop time components
Figure 3.12. The Traces panel, part 2

- OpenShiftInternalRuntime#start Max - maximum time of OpenShiftInternalRuntime#start operation
- OpenShiftInternalRuntime#start Avg - 1h moving average time of OpenShiftInternalRuntime#start operation
- Plugin Brokering Execution Max - maximum time of PluginBrokerManager#getTooling operation
- Plugin Brokering Execution Avg - 1h moving average of PluginBrokerManager#getTooling operation
Figure 3.13. The Traces panel, part 3
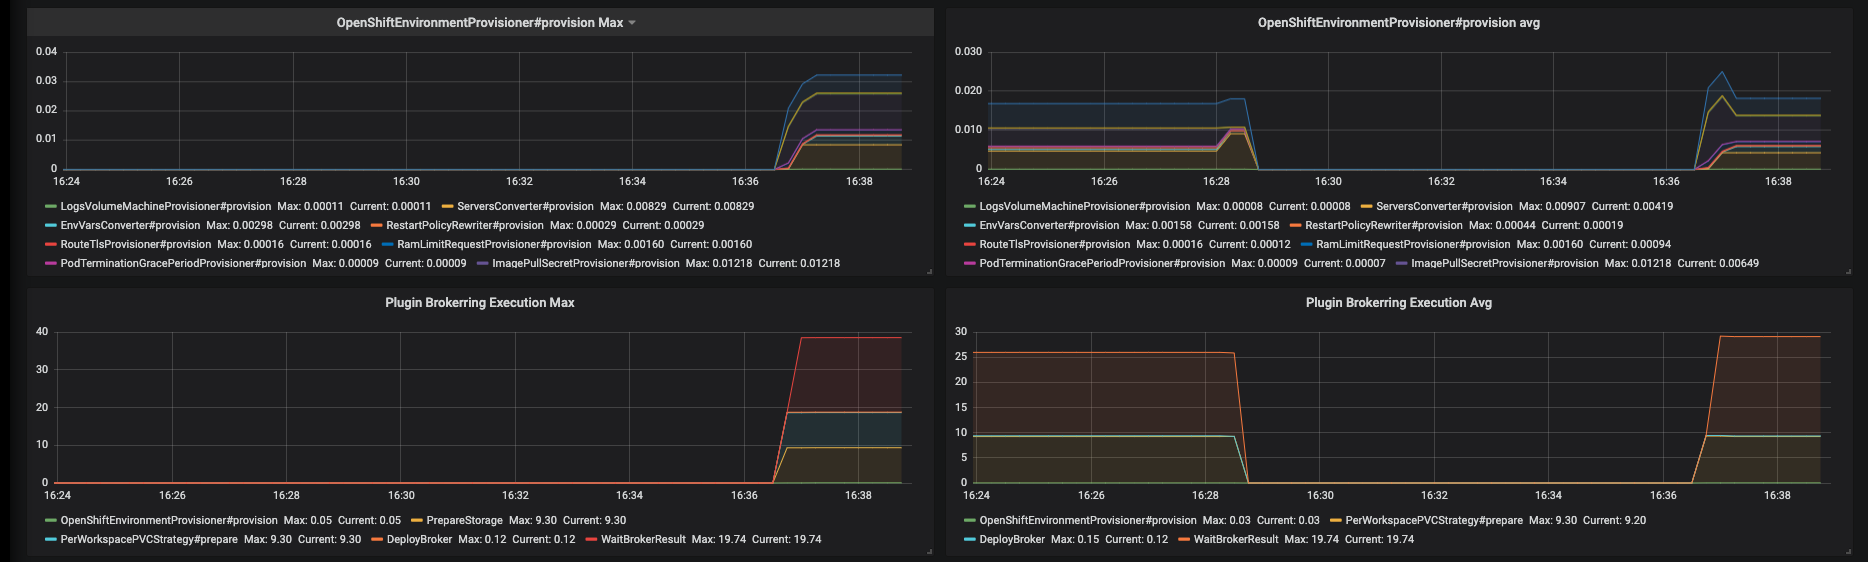
- OpenShiftEnvironmentProvisioner#provision Max - maximum time of OpenShiftEnvironmentProvisioner#provision operation
- OpenShiftEnvironmentProvisioner#provision Avg -1h moving average of OpenShiftEnvironmentProvisioner#provision operation
- Plugin Brokering Execution Max - maximum time of PluginBrokerManager#getTooling components execution time
- Plugin Brokering Execution Avg - 1h moving average of time of PluginBrokerManager#getTooling components execution time
Figure 3.14. The Traces panel, part 4
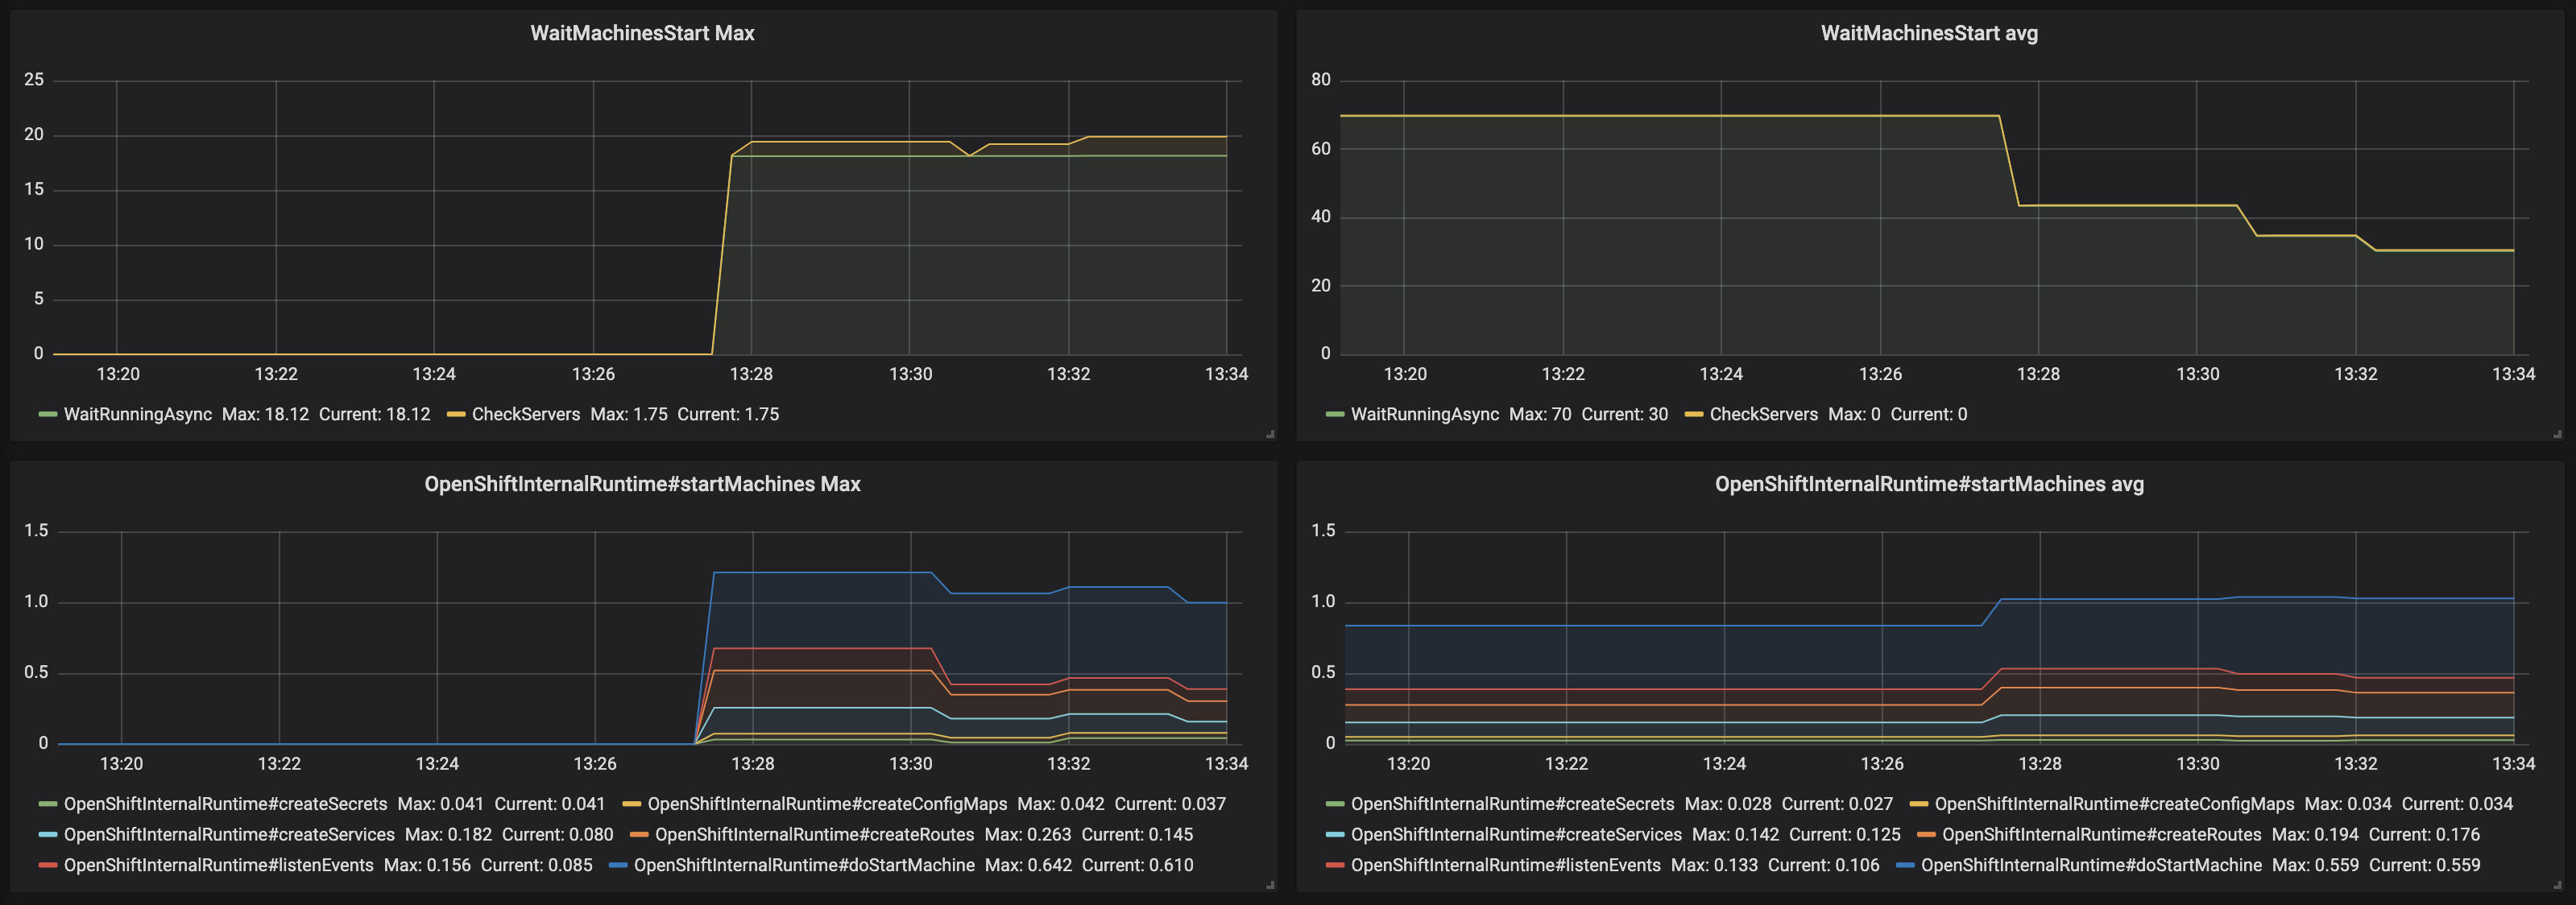
- WaitMachinesStart Max - maximim time of WaitMachinesStart operations
- WaitMachinesStart Avg - 1h moving average time of WaitMachinesStart operations
- OpenShiftInternalRuntime#startMachines Max - maximim time of OpenShiftInternalRuntime#startMachines operations
- OpenShiftInternalRuntime#startMachines Avg - 1h moving average of the time of OpenShiftInternalRuntime#startMachines operations
Figure 3.15. The Workspace detailed panel
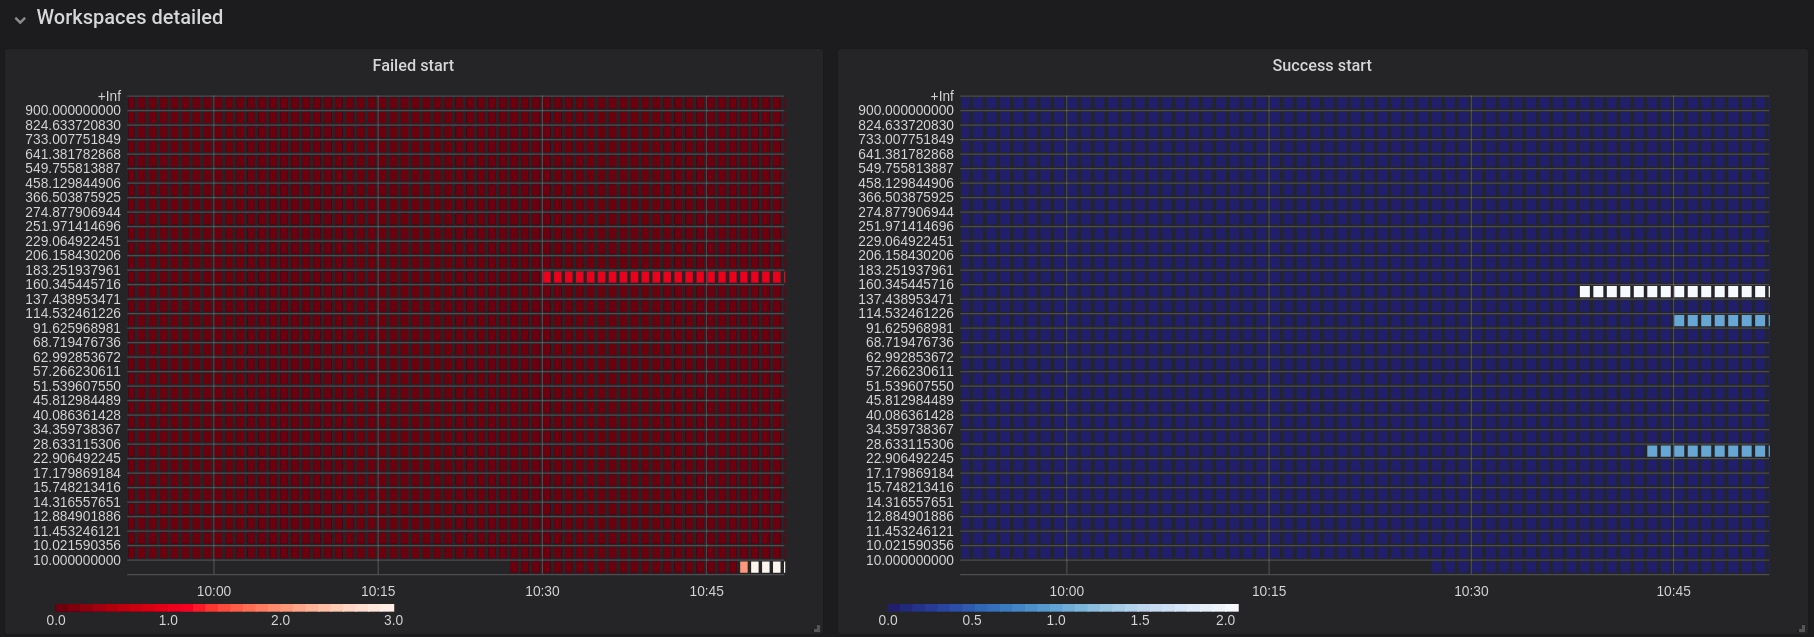
The Workspace Detailed panel contains heat maps, which illustrate the average time of workspace starts or fails. The row shows some period of time.
3.3.2.2. CodeReady Workspaces server JVM dashboard
Use case: JVM metrics of the CodeReady Workspaces server, such as JVM memory or classloading.
Figure 3.16. CodeReady Workspaces server JVM dashboard
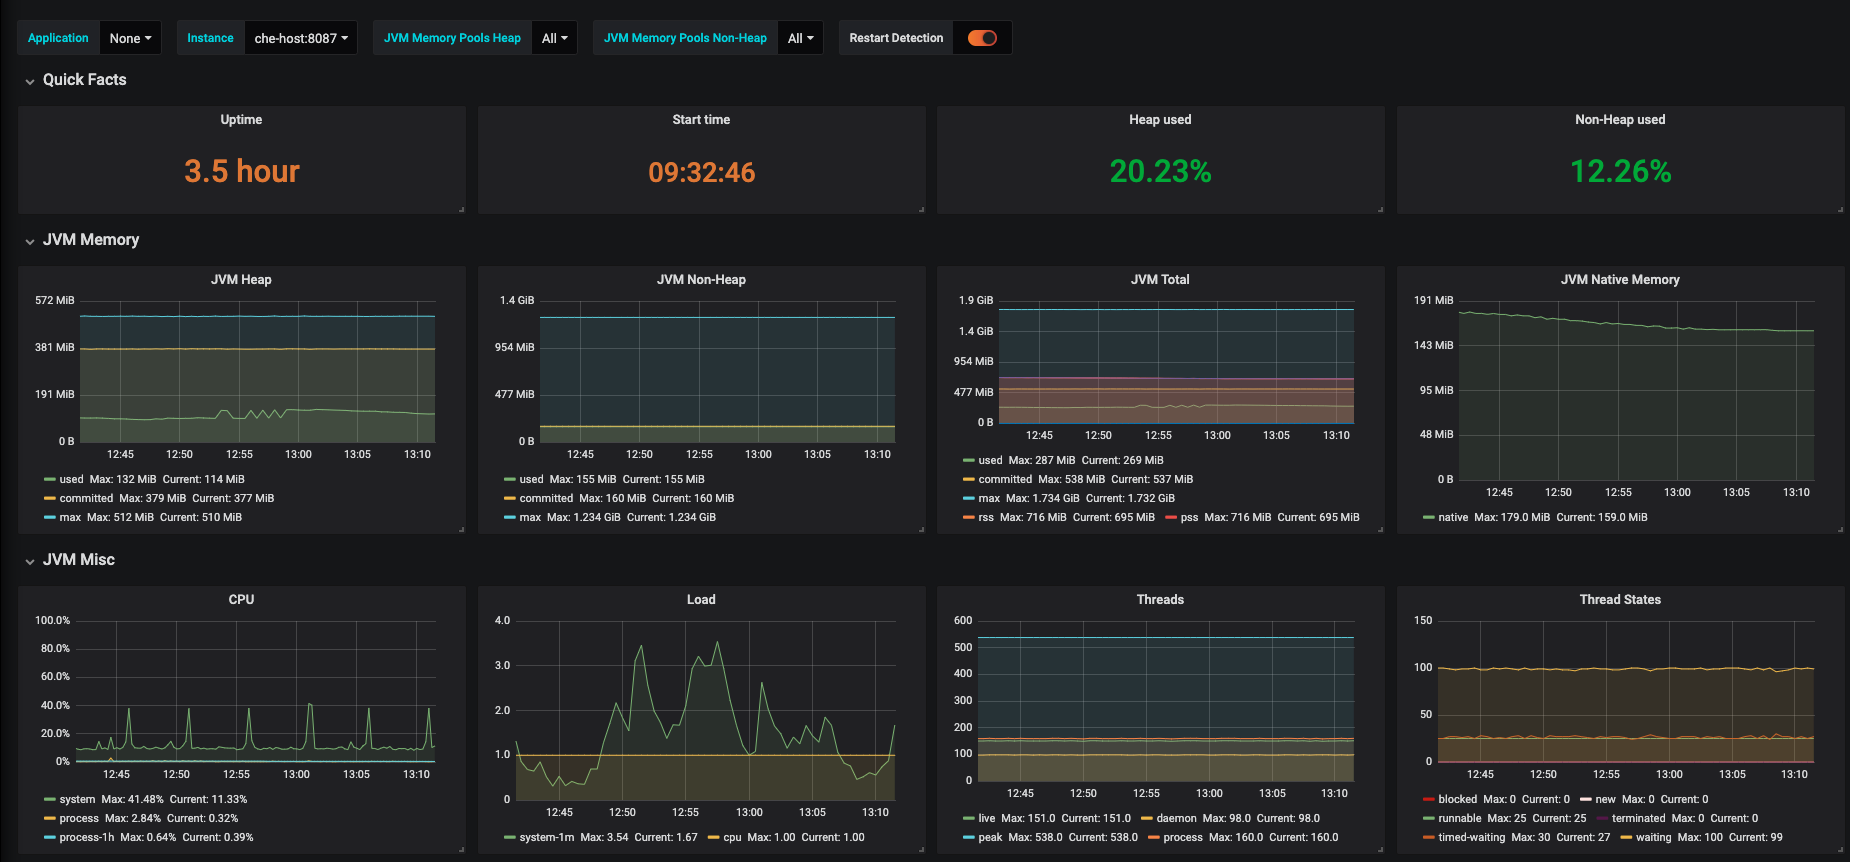
Figure 3.17. Quick Facts

Figure 3.18. JVM Memory
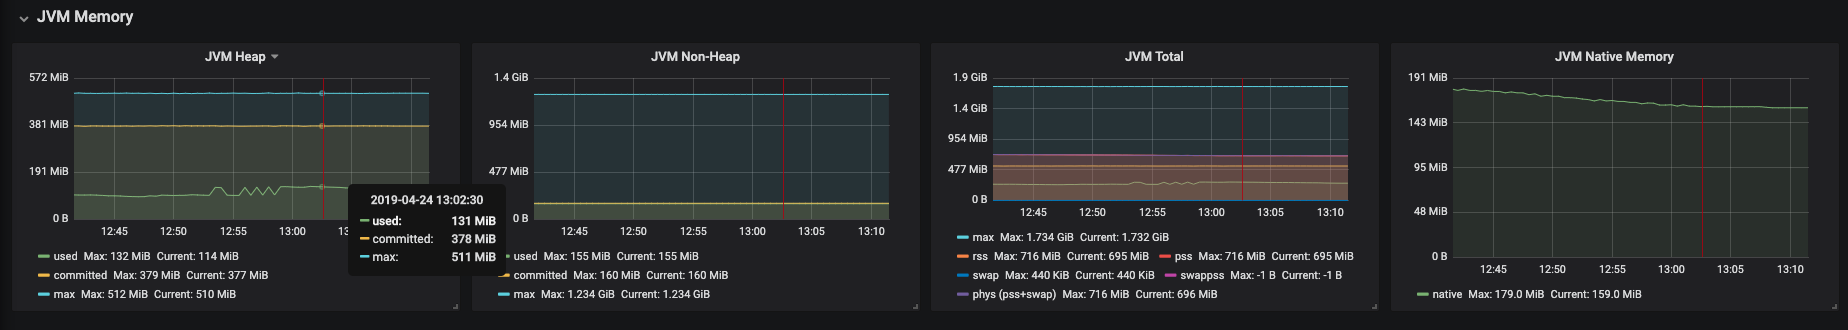
Figure 3.19. JVM Misc
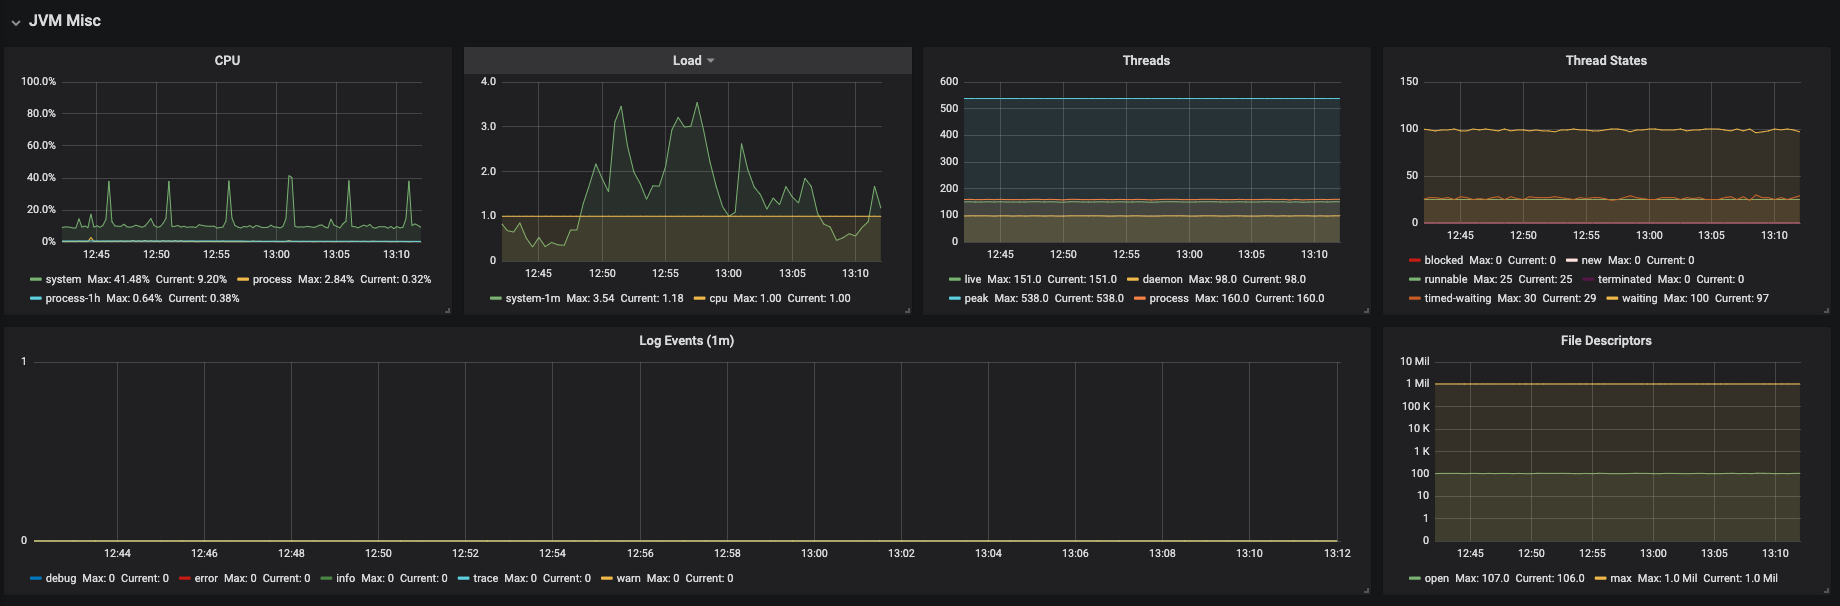
Figure 3.20. JVM Memory Pools (heap)
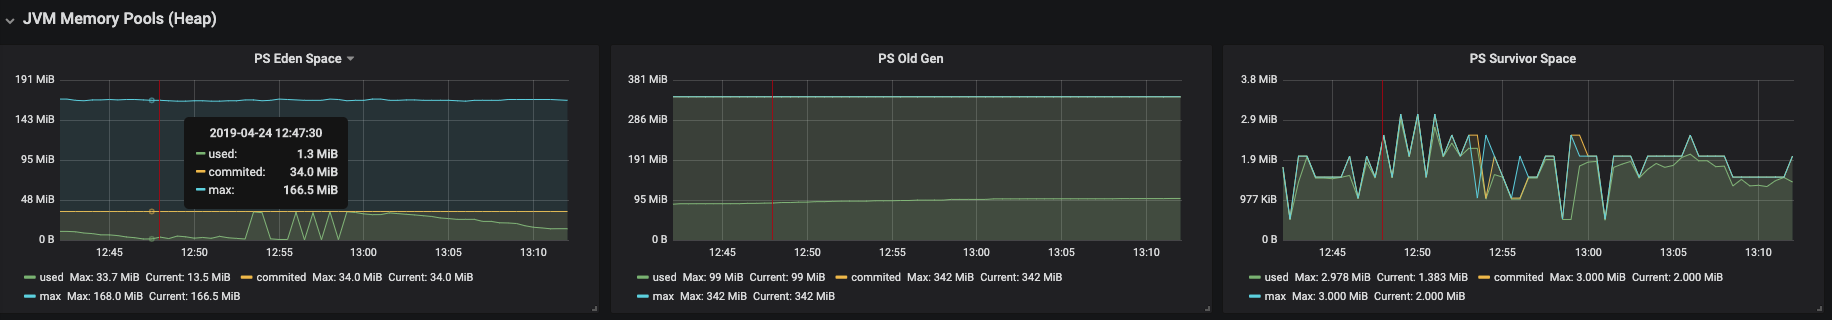
Figure 3.21. JVM Memory Pools (Non-Heap)
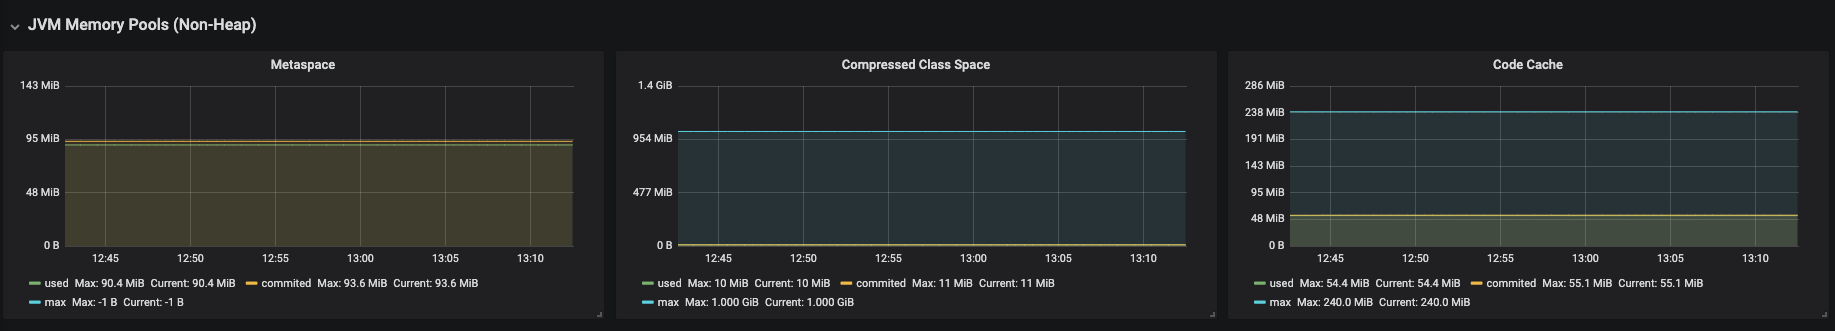
Figure 3.22. Garbage Collection
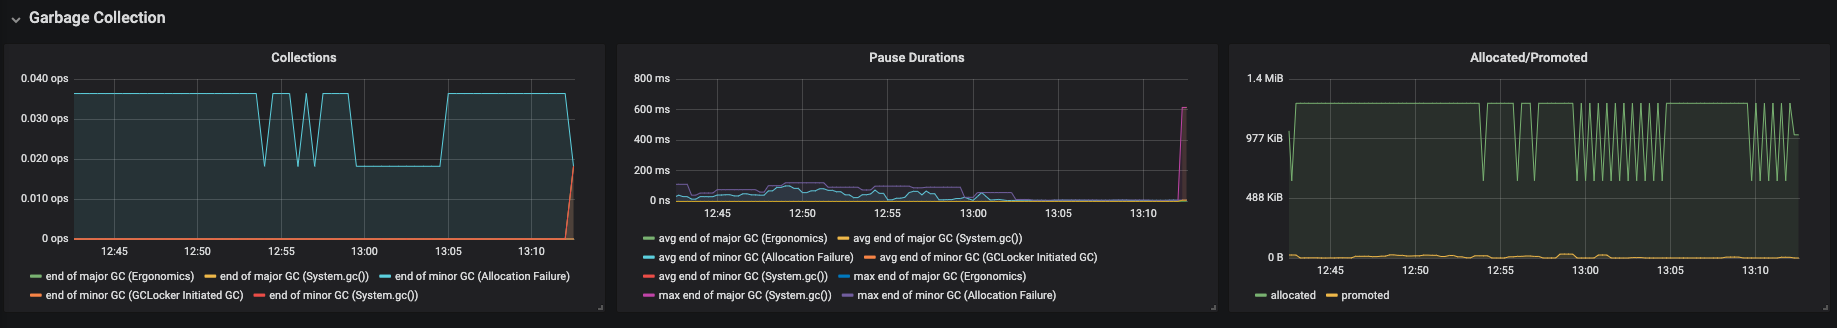
Figure 3.23. Classloading
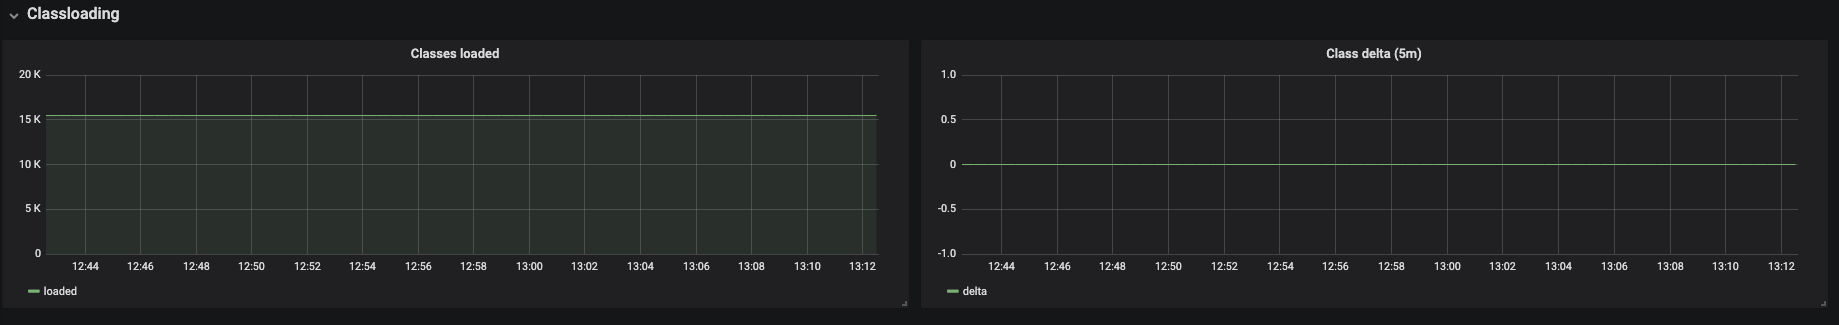
Figure 3.24. Buffer Pools

3.4. Developing Grafana dashboards
Grafana offers the possibility to add custom panels.
Procedure
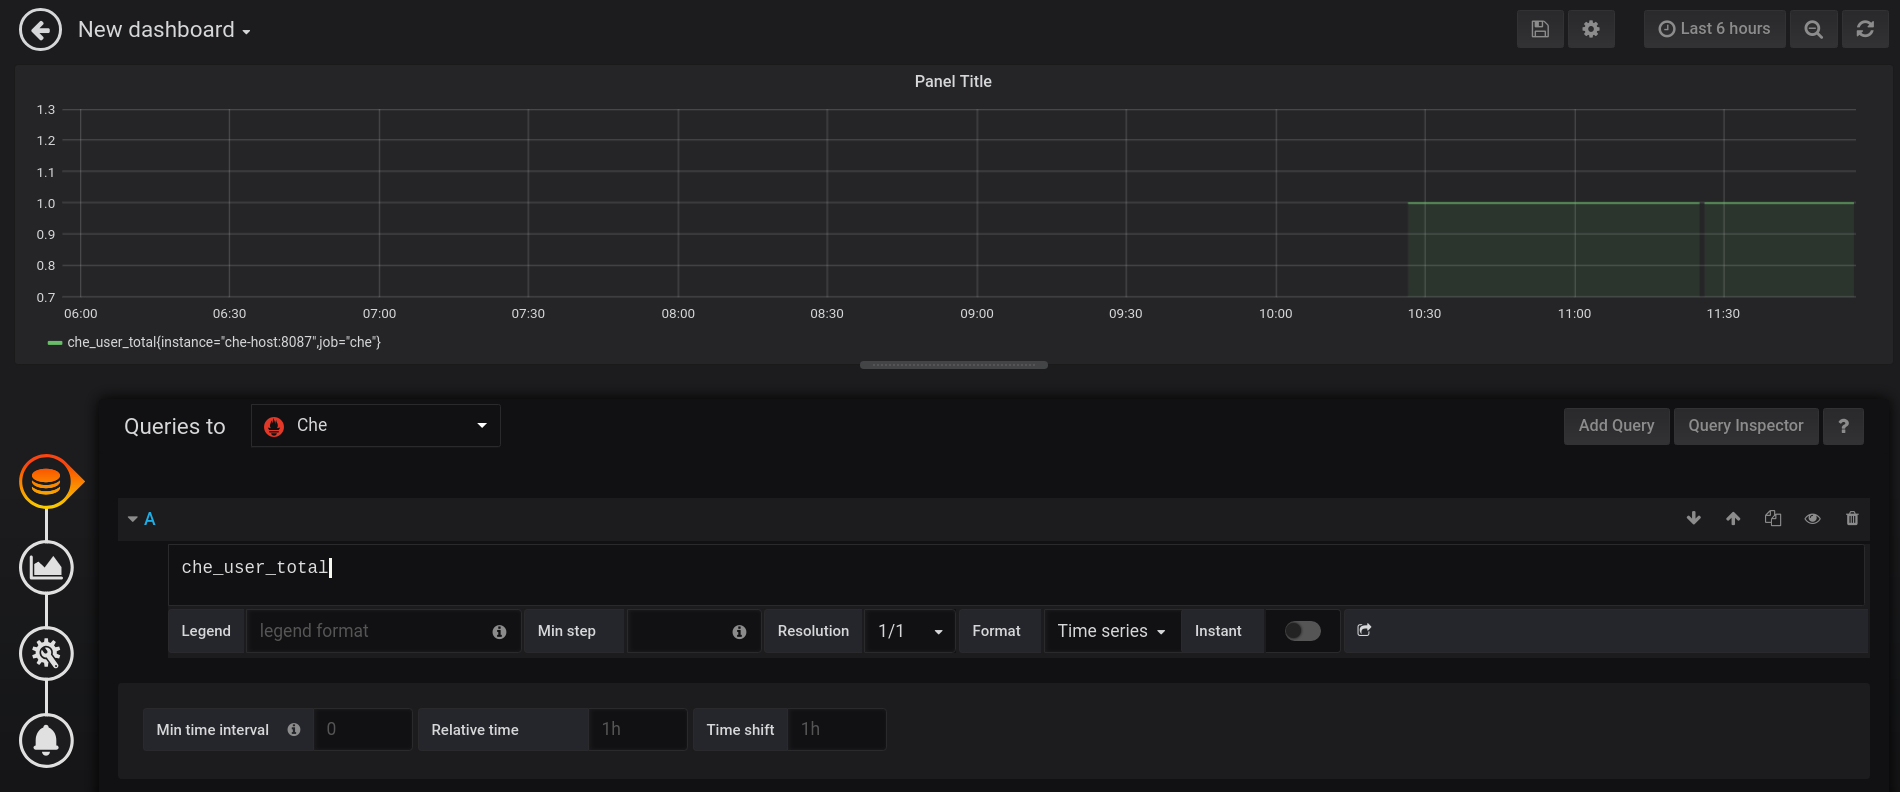
To add a custom panel, use the New dashboard view.
In the first section, define Queries to. Use the Prometheus Query Language to construct a specific metric, as well as to modify it with various aggregation operators.
Figure 3.25. New Grafana dashboard: Queries to
In the Visualisation section, choose a metric to be shown in the following visual in the form of a graph, gauge, heatmap, or others.
Figure 3.26. New Grafana dashboard: Visualization

- Save changes to the dashboard by clicking the button, and copy and paste the JSON code to the deployment.
Load changes in the configuration of a running Grafana deployment. First remove the deployment:
$ oc process -f che-monitoring.yaml | oc delete -f -
Then redeploy your Grafana with the new configuration:
$ oc process -f che-monitoring.yaml | oc apply -f - | oc rollout latest grafana
3.5. Extending CodeReady Workspaces monitoring metrics
There are two major modules for metrics:
-
che-core-metrics-core— contains core metrics module -
che-core-api-metrics— contains metrics that are dependent on core CodeReady Workspaces components, such as workspace or user managers
Procedure
To create a metric or a group of metrics, you need a class that extends the MeterBinder class. This allows to register the created metric in the overriden bindTo(MeterRegistry registry) method.
The following is an example of a metric that has a function that supplies the value for it:
Example metric
public class UserMeterBinder implements MeterBinder {

  private final UserManager userManager;

  @Inject
  public UserMeterBinder(UserManager userManager) {
    this.userManager = userManager;
  }

  @Override
  public void bindTo(MeterRegistry registry) {
    Gauge.builder("che.user.total", this::count)
        .description("Total amount of users")
        .register(registry);
  }

  private double count() {
    try {
      return userManager.getTotalCount();
    } catch (ServerException e) {
      return Double.NaN;
    }
  }
Alternatively, the metric can be stored with a reference and updated manually in some other place in the code.
Additional resources
For more information about the types of metrics and naming conventions, visit Prometheus documentation: