
Chapter 6. Monitoring the cluster on the Ceph dashboard
As a storage administrator, you can use Red Hat Ceph Storage Dashboard to monitor specific aspects of the cluster based on types of hosts, services, data access methods, and more.
This section covers the following administrative tasks:
- Monitoring hosts of the Ceph cluster on the dashboard.
- Viewing and editing the configuration of the Ceph cluster on the dashboard.
- Viewing and editing the manager modules of the Ceph cluster on the dashboard.
- Monitoring monitors of the Ceph cluster on the dashboard.
- Monitoring services of the Ceph cluster on the dashboard.
- Monitoring Ceph OSDs on the dashboard.
- Monitoring HAProxy on the dashboard.
- Viewing the CRUSH map of the Ceph cluster on the dashboard.
- Filtering logs of the Ceph cluster on the dashboard.
- Viewing centralized logs of the Ceph cluster on the dashboard.
- Monitoring pools of the Ceph cluster on the dashboard.
- Monitoring Ceph file systems on the dashboard.
- Monitoring Ceph Object Gateway daemons on the dashboard.
- Monitoring block device images on the Ceph dashboard.
6.1. Monitoring hosts of the Ceph cluster on the dashboard
You can monitor the hosts of the cluster on the Red Hat Ceph Storage Dashboard.
The following are the different tabs on the hosts page:
- Devices - This tab has details such as device ID, state of health, device name, and the daemons on the hosts.
- Inventory - This tab shows all disks attached to a selected host, as well as their type, size and others. It has details such as device path, type of device, available, vendor, model, size, and the OSDs deployed.
- Daemons - This tab shows all services that have been deployed on the selected host, which container they are running in and their current status. It has details such as hostname, daemon type, daemon ID, container ID, container image name, container image ID, version status and last refreshed time.
- Performance details - This tab has details such as OSDs deployed, CPU utilization, RAM usage, network load, network drop rate, and OSD disk performance statistics.
- Device health - For SMART-enabled devices, you can get the individual health status and SMART data only on the OSD deployed hosts.
Prerequisites
- A running Red Hat Ceph Storage cluster.
- Dashboard is installed.
- Hosts are added to the storage cluster.
- All the services, monitor, manager and OSD daemons are deployed on the storage cluster.
Procedure
- Log in to the Dashboard.
- From the Cluster drop-down menu, select Hosts.
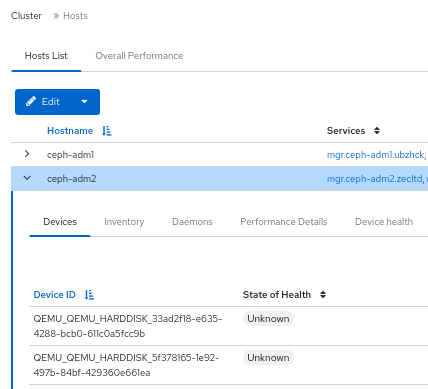
- To view the details of a specific host, click the Expand/Collapse icon on it’s row.
You can view the details such as Devices, Inventory, Daemons, Performance Details, and Device Health by clicking the respective tabs.
Figure 6.1. Monitoring hosts of the Ceph cluster
Additional Resources
- See the Ceph performance counters in the Red Hat Ceph Storage Administration Guide for more details.
6.2. Viewing and editing the configuration of the Ceph cluster on the dashboard
You can view various configuration options of the Ceph cluster on the dashboard. You can edit only some configuration options.
Prerequisites
- A running Red Hat Ceph Storage cluster.
- Dashboard is installed.
- All the services are deployed on the storage cluster.
Procedure
- Log in to the Dashboard.
- From the Cluster drop-down menu, select Configuration.
- Optional: You can search for the configuration using the Search box:
Optional: You can filter for a specific configuration using following filters:
- Level - Basic, advanced or dev
- Service - Any, mon, mgr, osd, mds, common, mds_client, rgw, and similar filters.
- Source - Any, mon, and similar filters
- Modified - yes or no
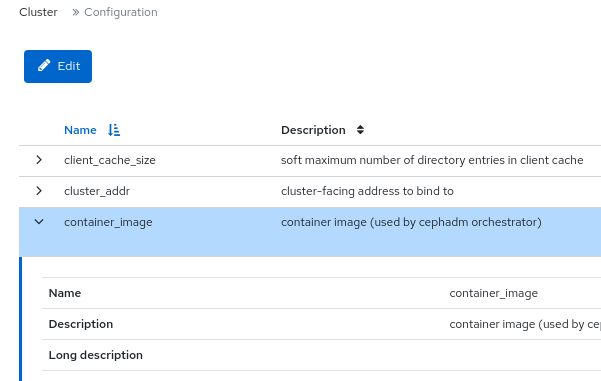
To view the details of the configuration, click the Expand/Collapse icon on it’s row.
Figure 6.2. Configuration options
To edit a configuration, click its row and click Edit.
- In the edit dialog window, edit the required parameters and Click Update.
- You get a notification that the configuration was updated successfully.
Additional Resources
- See the Ceph Network Configuration chapter in the Red Hat Ceph Storage Configuration Guide for more details.
6.3. Viewing and editing the manager modules of the Ceph cluster on the dashboard
Manager modules are used to manage module-specific configuration settings. For example, you can enable alerts for the health of the cluster.
You can view, enable or disable, and edit the manager modules of a cluster on the Red Hat Ceph Storage dashboard.
Prerequisites
- A running Red Hat Ceph Storage cluster.
- Dashboard is installed.
Viewing the manager modules
- Log in to the Dashboard.
- From the Cluster drop-down menu, select Manager Modules.
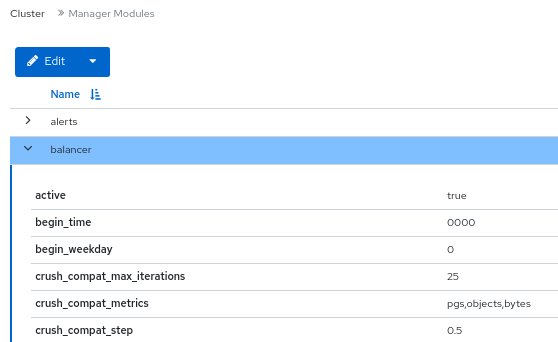
To view the details of a specific manager module, click the Expand/Collapse icon on it’s row.
Figure 6.3. Manager modules
Enabling a manager module
- Select the row.
- From the Edit drop-down menu, select Enable.
Disabling a manager module
- Select the row.
- From the Edit drop-down menu, select Disable.
Editing a manager module
Select the row:
NoteNot all modules have configurable parameters. If a module is not configurable, the Edit button is disabled.
- Edit the required parameters and click Update.
- You get a notification that the module was updated successfully.
6.4. Monitoring monitors of the Ceph cluster on the dashboard
You can monitor the performance of the Ceph monitors on the landing page of the Red Hat Ceph Storage dashboard You can also view the details such as status, quorum, number of open session, and performance counters of the monitors in the Monitors tab.
Prerequisites
- A running Red Hat Ceph Storage cluster.
- Dashboard is installed.
- Monitors are deployed in the storage cluster.
Procedure
- Log in to the Dashboard.
- From the Cluster drop-down menu, select Monitors.
The Monitors overview page displays information about the overall monitor status as well as tables of in Quorum and Not in quorum Monitor hosts.
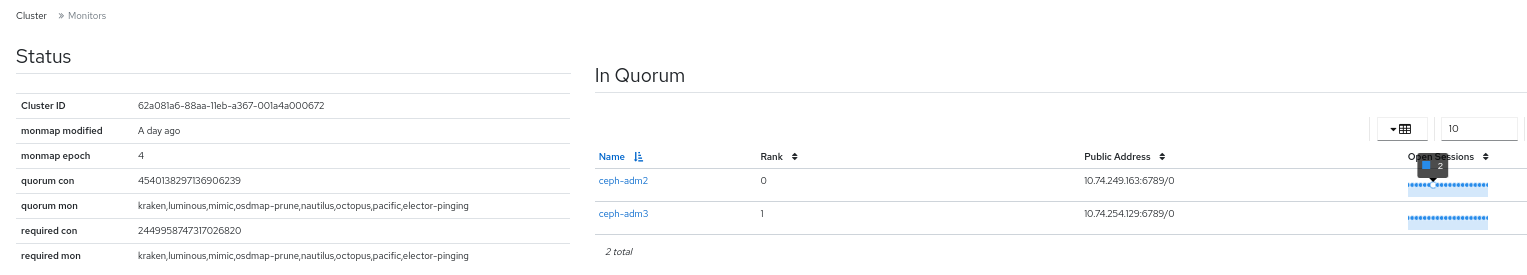
- To see the number of open sessions, hover the cursor over the blue dotted trail.
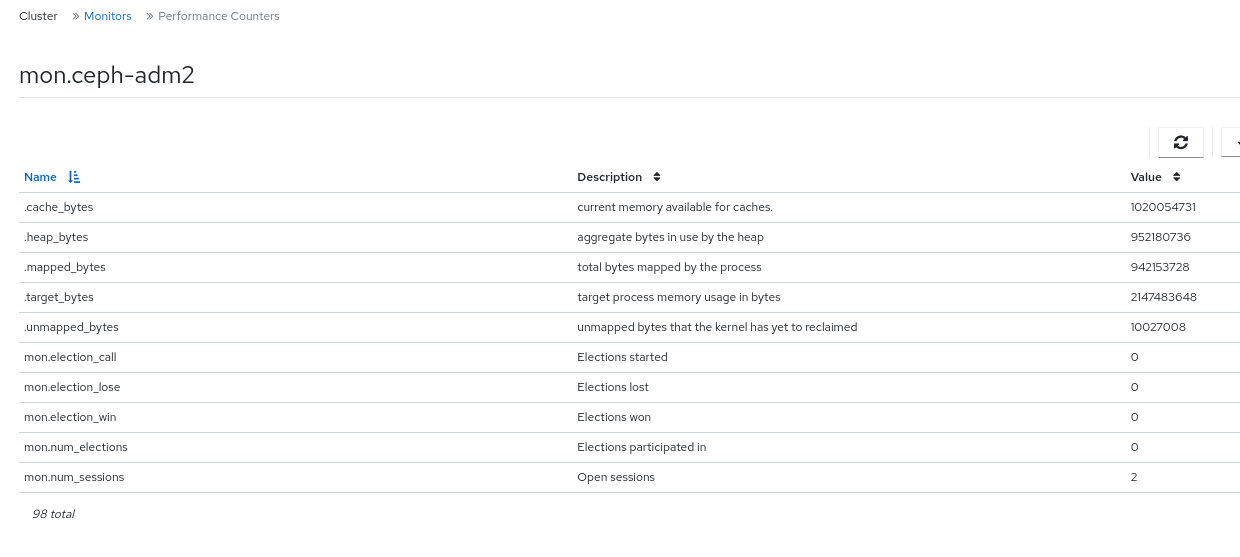
To see performance counters for any monitor, click its hostname.
View the performance counter of the monitor:
Additional Resources
- See the Ceph monitors section in the Red Hat Ceph Storage Operations guide.
- See the Ceph performance counters in the Red Hat Ceph Storage Administration Guide for more details.
6.5. Monitoring services of the Ceph cluster on the dashboard
You can monitor the services of the cluster on the Red Hat Ceph Storage Dashboard. You can view the details such as hostname, daemon type, daemon ID, container ID, container image name, container image ID, version status and last refreshed time.
Prerequisites
- A running Red Hat Ceph Storage cluster.
- Dashboard is installed.
- Hosts are added to the storage cluster.
- All the services are deployed on the storage cluster.
Procedure
- Log in to the Dashboard.
- From the Cluster drop-down menu, select Services.
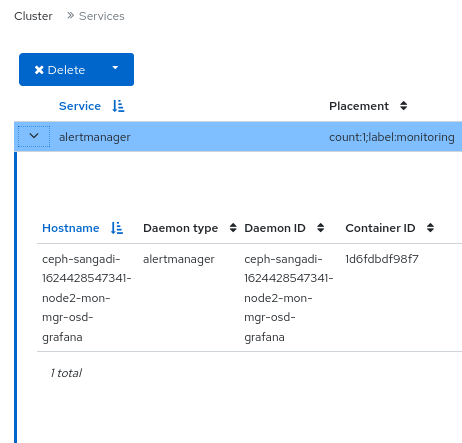
To view the details of a specific service, click the Expand/Collapse icon on it’s row.
Figure 6.4. Monitoring services of the Ceph cluster
Additional Resources
- See the Ceph Orchestrators in the Red Hat Ceph Storage Operations Guide for more details.
6.6. Monitoring Ceph OSDs on the dashboard
You can monitor the status of the Ceph OSDs on the landing page of the Red Hat Ceph Storage Dashboard. You can also view the details such as host, status, device class, number of placement groups (PGs), size flags, usage, and read or write operations time in the OSDs tab.
The following are the different tabs on the OSDs page:
- Devices - This tab has details such as Device ID, state of health, life expectancy, device name, and the daemons on the hosts.
- Attributes (OSD map) - This tab shows the cluster address, details of heartbeat, OSD state, and the other OSD attributes.
- Metadata - This tab shows the details of the OSD object store, the devices, the operating system, and the kernel details.
- Device health - For SMART-enabled devices, you can get the individual health status and SMART data.
- Performance counter - This tab gives details of the bytes written on the devices.
- Performance Details - This tab has details such as OSDs deployed, CPU utilization, RAM usage, network load, network drop rate, and OSD disk performance statistics.
Prerequisites
- A running Red Hat Ceph Storage cluster.
- Dashboard is installed.
- Hosts are added to the storage cluster.
- All the services including OSDs are deployed on the storage cluster.
Procedure
- Log in to the Dashboard.
- From the Cluster drop-down menu, select OSDs.
To view the details of a specific OSD, click the Expand/Collapse icon on it’s row.
Figure 6.5. Monitoring OSDs of the Ceph cluster
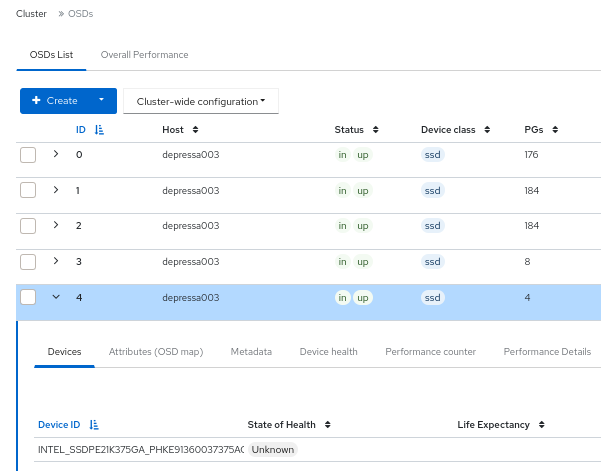
You can view additional details such as Devices, Attributes (OSD map), Metadata, Device Health, Performance counter, and Performance Details by clicking on the respective tabs.
Additional Resources
- See the Ceph Orchestrators in the Red Hat Ceph Storage Operations Guide for more details.
6.7. Monitoring HAProxy on the dashboard
The Ceph Object Gateway allows you to assign many instances of the object gateway to a single zone, so that you can scale out as load increases. Since each object gateway instance has its own IP address, you can use HAProxy to balance the load across Ceph Object Gateway servers.
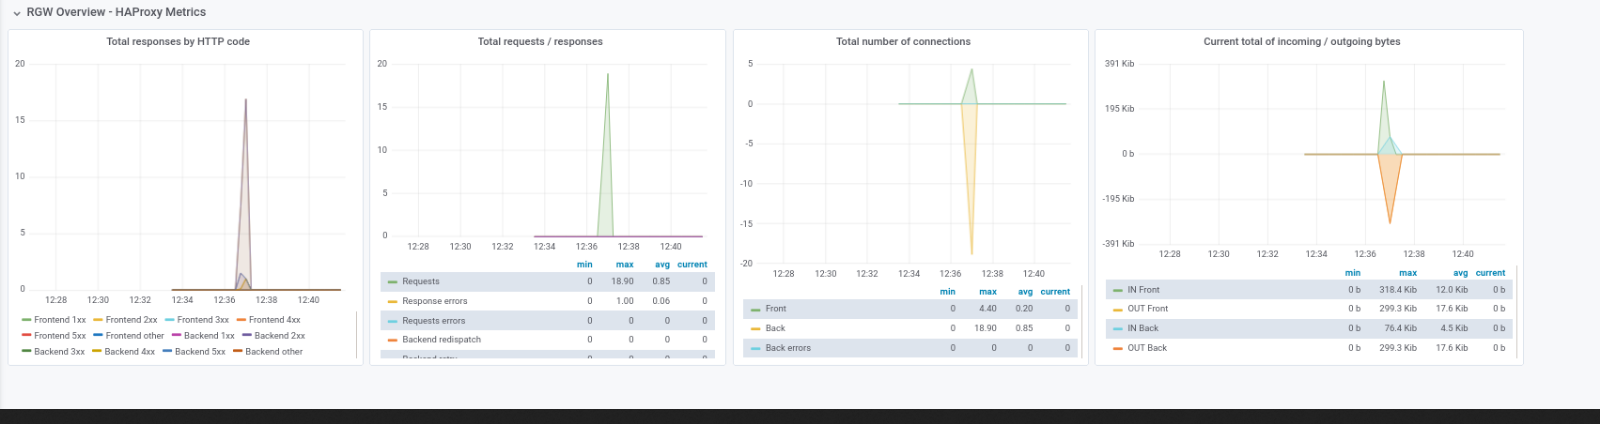
You can monitor the following HAProxy metrics on the dashboard:
- Total responses by HTTP code.
- Total requests/responses.
- Total number of connections.
- Current total number of incoming / outgoing bytes.
You can also get the Grafana details by running the ceph dashboard get-grafana-api-url command.
Prerequisites
- A running Red Hat Ceph Storage cluster.
- Admin level access on the storage dashboard.
- An existing Ceph Object Gateway service, without SSL. If you want SSL service, the certificate should be configured on the ingress service, not the Ceph Object Gateway service.
- Ingress service deployed using the Ceph Orchestrator.
- Monitoring stack components are created on the dashboard.
Procedure
Log in to the Grafana URL and select the RGW_Overview panel:
Syntax
https://DASHBOARD_URL:3000Example
https://dashboard_url:3000
- Verify the HAProxy metrics on the Grafana URL.
Launch the Ceph dashboard and log in with your credentials.
Example
https://dashboard_url:8443
- From the Cluster drop-down menu, select Object Gateway.
- Select Daemons.
- Select the Overall Performance tab.
Verification
Verify the Ceph Object Gateway HAProxy metrics:
Figure 6.6. HAProxy metrics
Additional Resources
- See the Configuring high availability for the Ceph Object Gateway in the Red Hat Ceph Storage Object Gateway Guide for more details.
6.8. Viewing the CRUSH map of the Ceph cluster on the dashboard
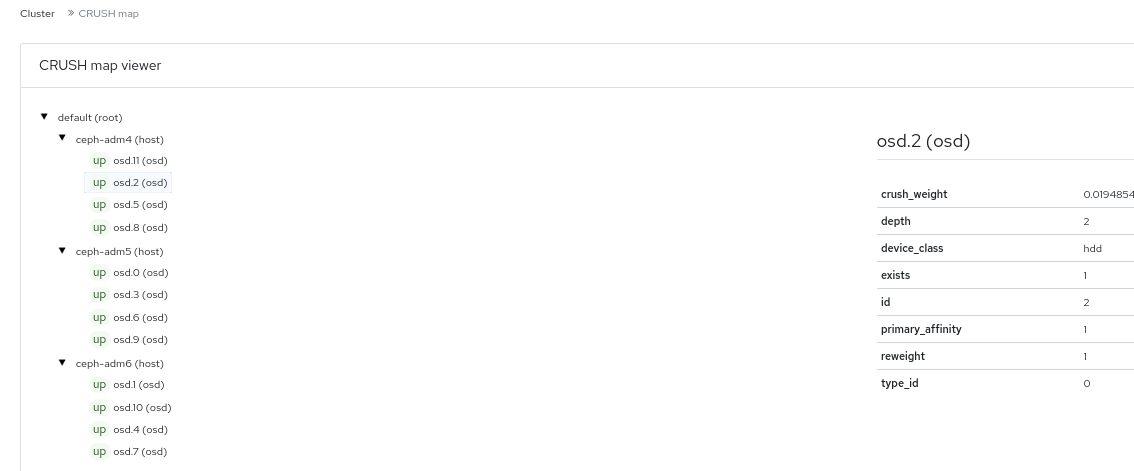
You can view the The CRUSH map that contains a list of OSDs and related information on the Red Hat Ceph Storage dashboard. Together, the CRUSH map and CRUSH algorithm determine how and where data is stored. The dashboard allows you to view different aspects of the CRUSH map, including OSD hosts, OSD daemons, ID numbers, device class, and more.
The CRUSH map allows you to determine which host a specific OSD ID is running on. This is helpful if there is an issue with an OSD.
Prerequisites
- A running Red Hat Ceph Storage cluster.
- Dashboard is installed.
- OSD daemons deployed on the storage cluster.
Procedure
- Log in to the Dashboard.
- From the Cluster drop-down menu, select CRUSH Map.
To view the details of the specific OSD, click it’s row.
Figure 6.7. CRUSH Map detail view
Additional Resources
- For more information about the CRUSH map, see CRUSH admin overview in the Red Hat Ceph Storage Storage strategies guide.
6.9. Filtering logs of the Ceph cluster on the dashboard
You can view and filter logs of the Red Hat Ceph Storage cluster on the dashboard based on several criteria. The criteria includes Priority, Keyword, Date, and Time range.
You can download the logs to the system or copy the logs to the clipboard as well for further analysis.
Prerequisites
- A running Red Hat Ceph Storage cluster.
- The Dashboard is installed.
- Log entries have been generated since the Ceph Monitor was last started.
The Dashboard logging feature only displays the thirty latest high level events. The events are stored in memory by the Ceph Monitor. The entries disappear after restarting the Monitor. If you need to review detailed or older logs, refer to the file based logs.
Procedure
- Log in to the Dashboard.
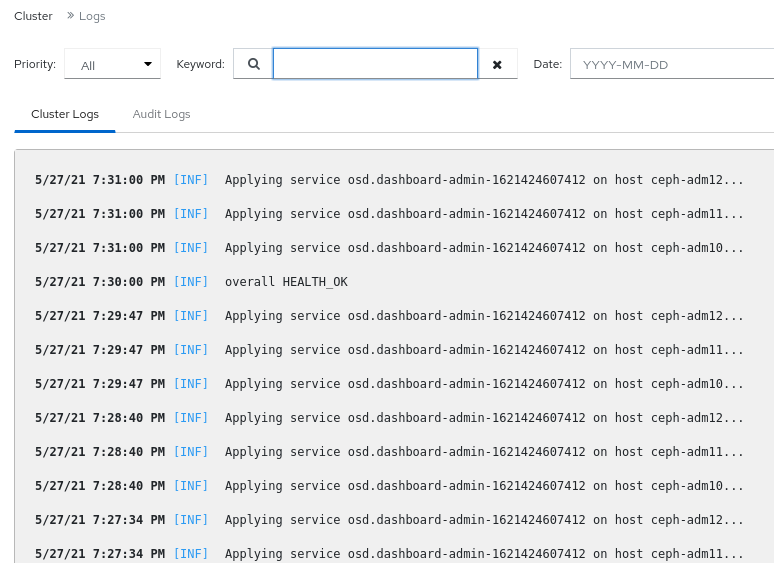
From the Cluster drop-down menu, select Logs.
Figure 6.8. Cluster logs
-
To filter by priority, click the
Prioritydrop-down menu and select either Debug, Info, Warning, Error, or All. -
To filter by keyword, enter text into the
Keywordfield. -
To filter by date, click the
Datefield and either use the date picker to select a date from the menu, or enter a date in the form of YYYY-MM-DD. -
To filter by time, enter a range in the
Time rangefields using the HH:MM - HH:MM format. Hours must be entered using numbers0to23. - To combine filters, set two or more filters.
-
To filter by priority, click the
- Click the Download icon or Copy to Clipboard icon to download the logs.
Additional Resources
- See the Configuring Logging chapter in the Red Hat Ceph StorageTroubleshooting Guide for more information.
- See the Understanding Ceph Logs section in the Red Hat Ceph Storage Troubleshooting Guide for more information.
6.10. Viewing centralized logs of the Ceph cluster on the dashboard
Ceph Dashboard allows you to view logs from all the clients in a centralized space in the Red Hat Ceph Storage cluster for efficient monitoring. This is achieved through using Loki, a log aggregation system designed to store and query logs, and Promtail, an agent that ships the contents of local logs to a private Grafana Loki instance.
Prerequisites
- A running Red Hat Ceph Storage cluster.
- Dashboard is installed.
- Grafana is configured and logged into on the cluster.
Procedure
- Log in to the Dashboard.
- From the Cluster drop-down menu, click Services.
- In the Services window, click + Create from the drop-down menu.
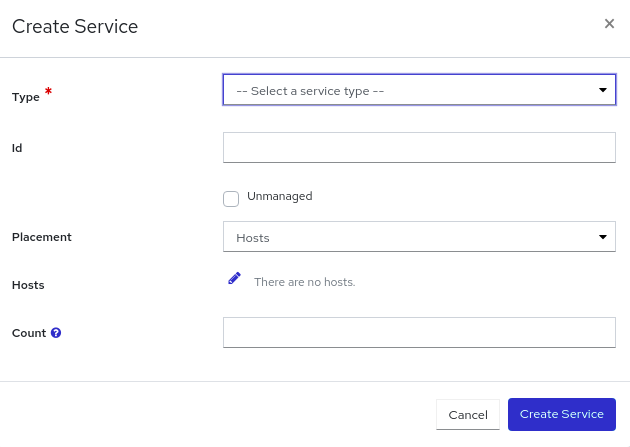
-
In the Create Service window, from the Type field, choose
loki, fill in the remaining details, and click Create Service. Repeat the previous step to create the
Promtailservice as well by choosingpromtailin the Type field. On successful creation, you can seelokiandpromtailservices running in the list of services.Figure 6.9. Creating Loki and Promtail services
 Note
NoteBy default, Promtail service is deployed on all the running hosts.
- To enable logging to files, from the Cluster drop-down menu, click Configuration.
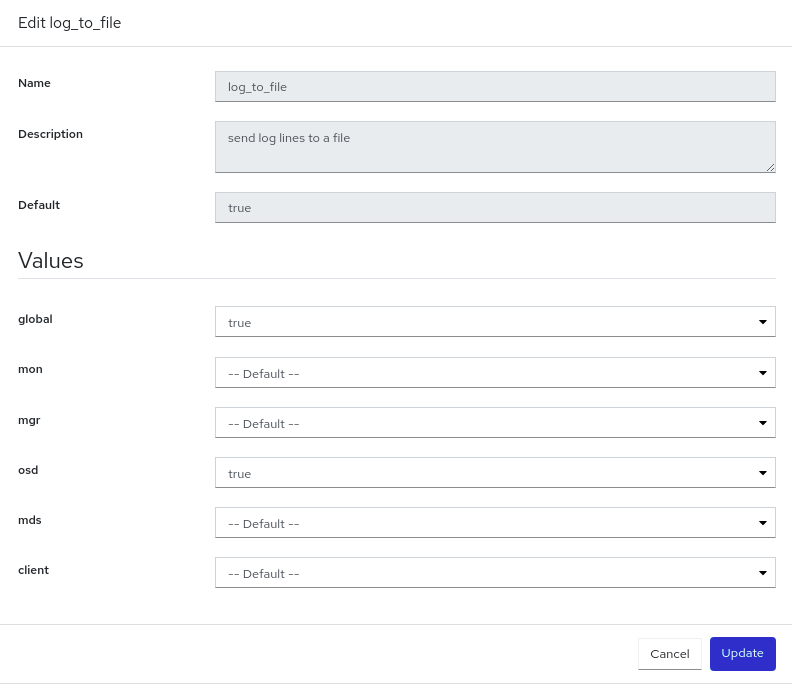
-
Search for
log_to_filein the search bar and click Edit. In the Edit log_to_file window, set global to
true.Figure 6.10. Configuring log files
Repeat steps 6 to 8 to configure global to
truefor themon_cluster_log_to_filefile as well, by searching formon_cluster_log_to_filein the search bar.NoteBoth
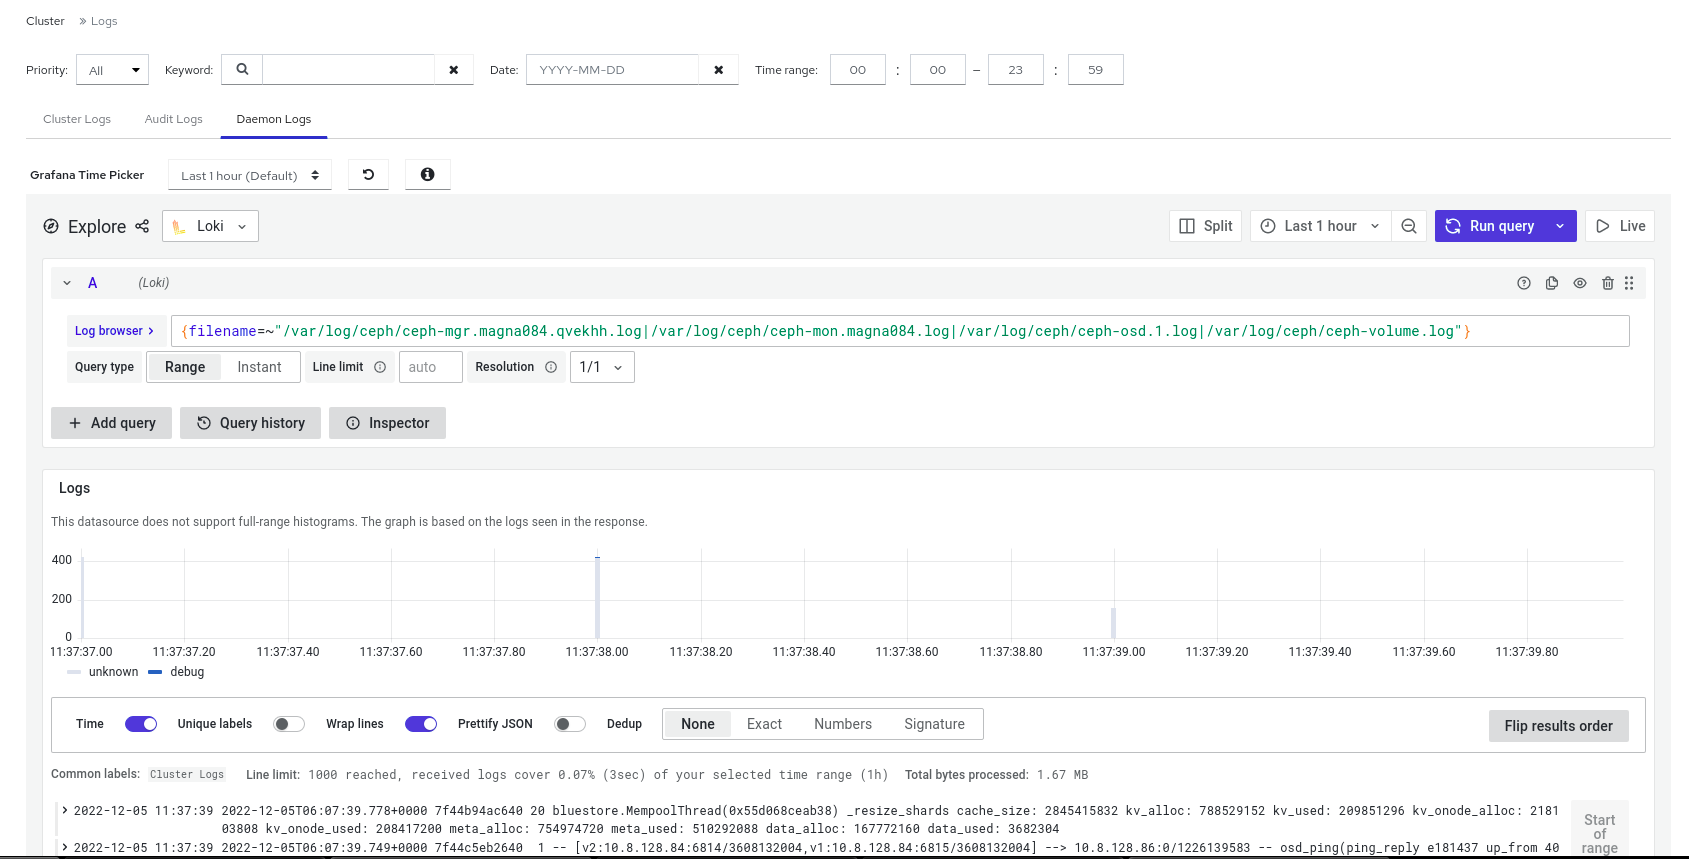
log_to_fileandmon_cluster_log_to_filefiles need to be configured.Navigate to Logs under Cluster and click Daemon Logs tab to view the centralized logs. Use Log browser to select files and click Show logs to view the logs from that file.
Figure 6.11. View centralized logs
 Note
NoteIf you do not see the logs, you need to sign in to Grafana and reload the page.
6.11. Monitoring pools of the Ceph cluster on the dashboard
You can view the details, performance details, configuration, and overall performance of the pools in a cluster on the Red Hat Ceph Storage Dashboard.
A pool plays a critical role in how the Ceph storage cluster distributes and stores data. If you have deployed a cluster without creating a pool, Ceph uses the default pools for storing data.
Prerequisites
- A running Red Hat Ceph Storage cluster.
- Dashboard is installed.
- Pools are created
Procedure
- Log in to the Dashboard.
- On the navigation bar, select Pools.
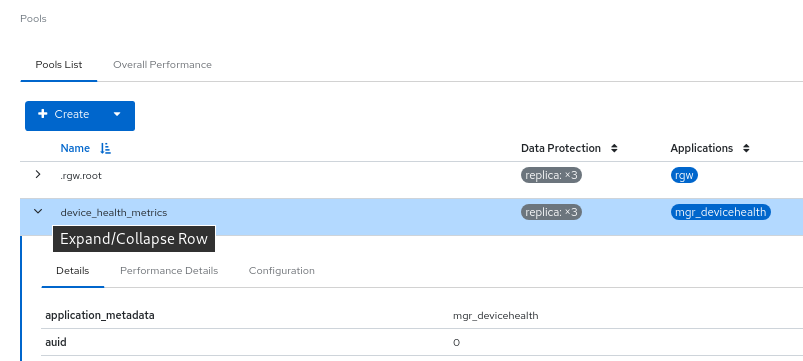
- View the pools list which gives the details of Data protection and the application for which the pool is enabled. Hover the mouse over Usage, Read bytes, and Write bytes for the required details.
To view more information about a pool, click the Expand/Collapse icon on it’s row.
Figure 6.12. Monitoring pools
Additional Resources
- For more information about pools, see Ceph pools in the Red Hat Ceph Storage Architecture guide.
- See the Creating pools on the Ceph dashboard section in the Red Hat Ceph Storage Dashboard Guide for more details.
6.12. Monitoring Ceph file systems on the dashboard
You can use the Red Hat Ceph Storage Dashboard to monitor Ceph File Systems (CephFS) and related components. There are four main tabs in File Systems:
- Details - View the metadata servers (MDS) and their rank plus any standby daemons, pools and their usage,and performance counters.
- Clients - View list of clients that have mounted the file systems.
- Directories - View list of directories.
- Performance - View the performance of the file systems.
Prerequisites
- A running Red Hat Ceph Storage cluster.
- Dashboard is installed.
- MDS service is deployed on at least one of the hosts.
- Ceph File System is installed.
Procedure
- Log in to the dashboard.
- On the navigation bar, click Filesystems.
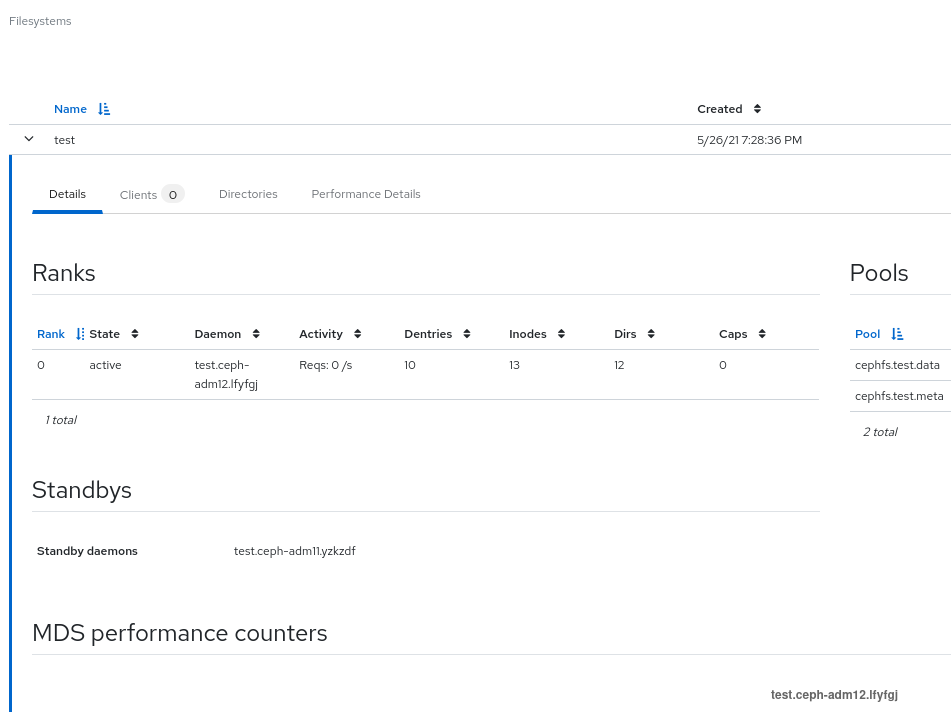
To view more information about the file system, click the Expand/Collapse icon on it’s row.
Figure 6.13. Monitoring Ceph File Systems
Additional Resources
- For more information, see the File System Guide.
6.13. Monitoring Ceph object gateway daemons on the dashboard
You can use the Red Hat Ceph Storage Dashboard to monitor Ceph object gateway daemons. You can view the details, performance counters and performance details of the Ceph object gateway daemons.
Prerequisites
- A running Red Hat Ceph Storage cluster.
- Dashboard is installed.
- At least one Ceph object gateway daemon configured in the storage cluster.
Procedure
- Log in to the dashboard.
- On the navigation bar, click Object Gateway.
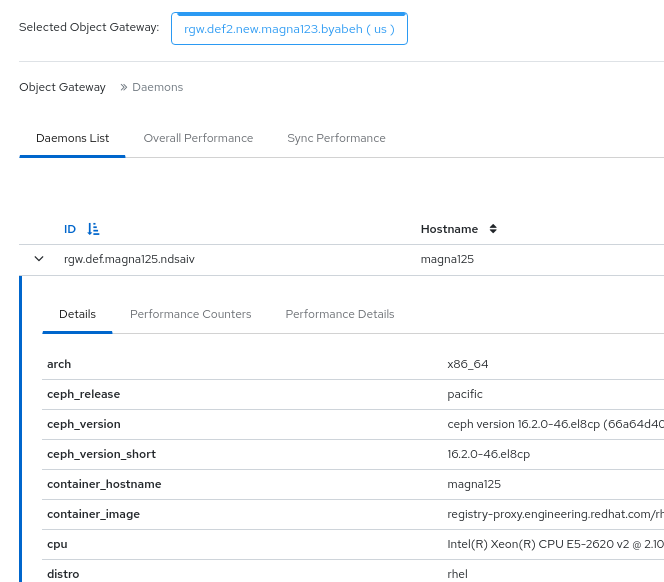
To view more information about the Ceph object gateway daemon, click the Expand/Collapse icon on it’s row.
Figure 6.14. Monitoring Ceph object gateway daemons
If you have configured multiple Ceph Object Gateway daemons, click on Sync Performance tab and view the multi-site performance counters.
Additional Resources
- For more information, see the Red Hat Ceph Storage Ceph object gateway Guide.
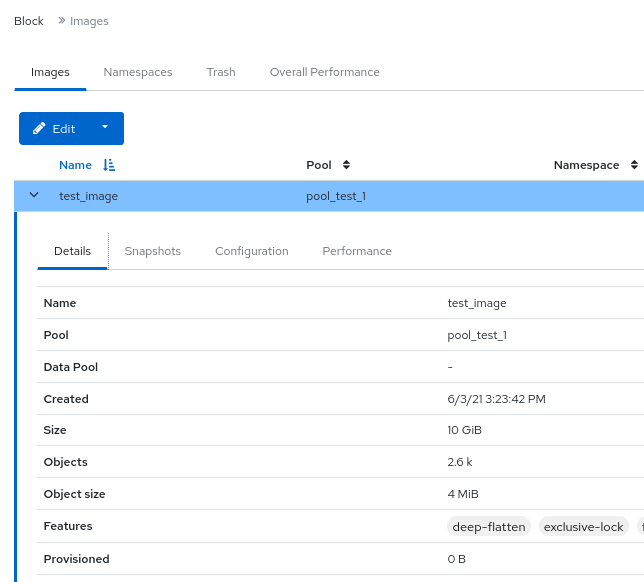
6.14. Monitoring Block device images on the Ceph dashboard.
You can use the Red Hat Ceph Storage Dashboard to monitor and manage Block device images. You can view the details, snapshots, configuration details, and performance details of the images.
Prerequisites
- A running Red Hat Ceph Storage cluster.
- Dashboard is installed.
- A pool with the rbd application enabled is created.
- An image is created.
Procedure
- Log in to the dashboard.
- On the navigation bar, click Block.
To view more information about the images, click the Expand/Collapse icon on it’s row.
Figure 6.15. Monitoring Block device images
Additional Resources
- See the Creating images on the Ceph dashboard section in the Red Hat Ceph Storage Dashboard Guide for more details. .