
Chapter 2. Ceph Dashboard installation and access
As a system administrator, you can access the dashboard with the credentials provided on bootstrapping the cluster.
Cephadm installs the dashboard by default. Following is an example of the dashboard URL:
URL: https://host01:8443/
User: admin
Password: zbiql951ar
Update the browser and clear the cookies prior to accessing the dashboard URL.
The following are the Cephadm bootstrap options that are available for the Ceph dashboard configurations:
- [–initial-dashboard-user INITIAL_DASHBOARD_USER] - Use this option while bootstrapping to set initial-dashboard-user.
- [–initial-dashboard-password INITIAL_DASHBOARD_PASSWORD] - Use this option while bootstrapping to set initial-dashboard-password.
- [–ssl-dashboard-port SSL_DASHBOARD_PORT] - Use this option while bootstrapping to set custom dashboard port other than default 8443.
- [–dashboard-key DASHBOARD_KEY] - Use this option while bootstrapping to set Custom key for SSL.
- [–dashboard-crt DASHBOARD_CRT] - Use this option while bootstrapping to set Custom certificate for SSL.
- [–skip-dashboard] - Use this option while bootstrapping to deploy Ceph without dashboard.
- [–dashboard-password-noupdate] - Use this option while bootstrapping if you used above two options and don’t want to reset password at the first time login.
- [–allow-fqdn-hostname] - Use this option while bootstrapping to allow hostname that is fully-qualified.
- [–skip-prepare-host] - Use this option while bootstrapping to skip preparing the host.
To avoid connectivity issues with dashboard related external URL, use the fully qualified domain names (FQDN) for hostnames, for example, host01.ceph.redhat.com.
Open the Grafana URL directly in the client internet browser and accept the security exception to see the graphs on the Ceph dashboard. Reload the browser to view the changes.
Example
[root@host01 ~]# cephadm bootstrap --mon-ip 127.0.0.1 --registry-json cephadm.txt --initial-dashboard-user admin --initial-dashboard-password zbiql951ar --dashboard-password-noupdate --allow-fqdn-hostname
While boostrapping the storage cluster using cephadm, you can use the --image option for either custom container images or local container images.
You have to change the password the first time you log into the dashboard with the credentials provided on bootstrapping only if --dashboard-password-noupdate option is not used while bootstrapping. You can find the Ceph dashboard credentials in the var/log/ceph/cephadm.log file. Search with the "Ceph Dashboard is now available at" string.
This section covers the following tasks:
- Network port requirements for Ceph dashboard.
- Accessing the Ceph dashboard.
- Expanding the cluster on the Ceph dashboard.
- Toggling Ceph dashboard features.
- Understanding the landing page of the Ceph dashboard.
- Enabling Red Hat Ceph Storage Dashboard manually.
- Changing the dashboard password using the Ceph dashboard.
- Changing the Ceph dashboard password using the command line interface.
-
Setting
adminuser password for Grafana. - Creating an admin account for syncing users to the Ceph dashboard.
- Syncing users to the Ceph dashboard using the Red Hat Single Sign-On.
- Enabling single sign-on for the Ceph dashboard.
- Disabling single sign-on for the Ceph dashboard.
2.1. Network port requirements for Ceph Dashboard
The Ceph dashboard components use certain TCP network ports which must be accessible. By default, the network ports are automatically opened in firewalld during installation of Red Hat Ceph Storage.
Table 2.1. TCP Port Requirements
| Port | Use | Originating Host | Destination Host |
|---|---|---|---|
| 8443 | The dashboard web interface | IP addresses that need access to Ceph Dashboard UI and the host under Grafana server, since the AlertManager service can also initiate connections to the Dashboard for reporting alerts. | The Ceph Manager hosts. |
| 3000 | Grafana | IP addresses that need access to Grafana Dashboard UI and all Ceph Manager hosts and Grafana server. | The host or hosts running Grafana server. |
| 2049 | NFS-Ganesha | IP addresses that need access to NFS. | The IP addresses that provide NFS services. |
| 9095 | Default Prometheus server for basic Prometheus graphs | IP addresses that need access to Prometheus UI and all Ceph Manager hosts and Grafana server or Hosts running Prometheus. | The host or hosts running Prometheus. |
| 9093 | Prometheus Alertmanager | IP addresses that need access to Alertmanager Web UI and all Ceph Manager hosts and Grafana server or Hosts running Prometheus. | All Ceph Manager hosts and the host under Grafana server. |
| 9094 | Prometheus Alertmanager for configuring a highly available cluster made from multiple instances | All Ceph Manager hosts and the host under Grafana server. |
Prometheus Alertmanager High Availability (peer daemon sync), so both |
| 9100 |
The Prometheus | Hosts running Prometheus that need to view Node Exporter metrics Web UI and All Ceph Manager hosts and Grafana server or Hosts running Prometheus. | All storage cluster hosts, including MONs, OSDS, Grafana server host. |
| 9283 | Ceph Manager Prometheus exporter module | Hosts running Prometheus that need access to Ceph Exporter metrics Web UI and Grafana server. | All Ceph Manager hosts. |
Additional Resources
- For more information, see the Red Hat Ceph Storage Installation Guide.
- For more information, see Using and configuring firewalls in Configuring and managing networking.
2.2. Accessing the Ceph dashboard
You can access the Ceph dashboard to administer and monitor your Red Hat Ceph Storage cluster.
Prerequisites
- Successful installation of Red Hat Ceph Storage Dashboard.
- NTP is synchronizing clocks properly.
Procedure
Enter the following URL in a web browser:
Syntax
https://HOST_NAME:PORT
Replace:
- HOST_NAME with the fully qualified domain name (FQDN) of the active manager host.
PORT with port
8443Example
https://host01:8443
You can also get the URL of the dashboard by running the following command in the Cephadm shell:
Example
[ceph: root@host01 /]# ceph mgr services
This command will show you all endpoints that are currently configured. Look for the
dashboardkey to obtain the URL for accessing the dashboard.
-
On the login page, enter the username
adminand the default password provided during bootstrapping. - You have to change the password the first time you log in to the Red Hat Ceph Storage dashboard.
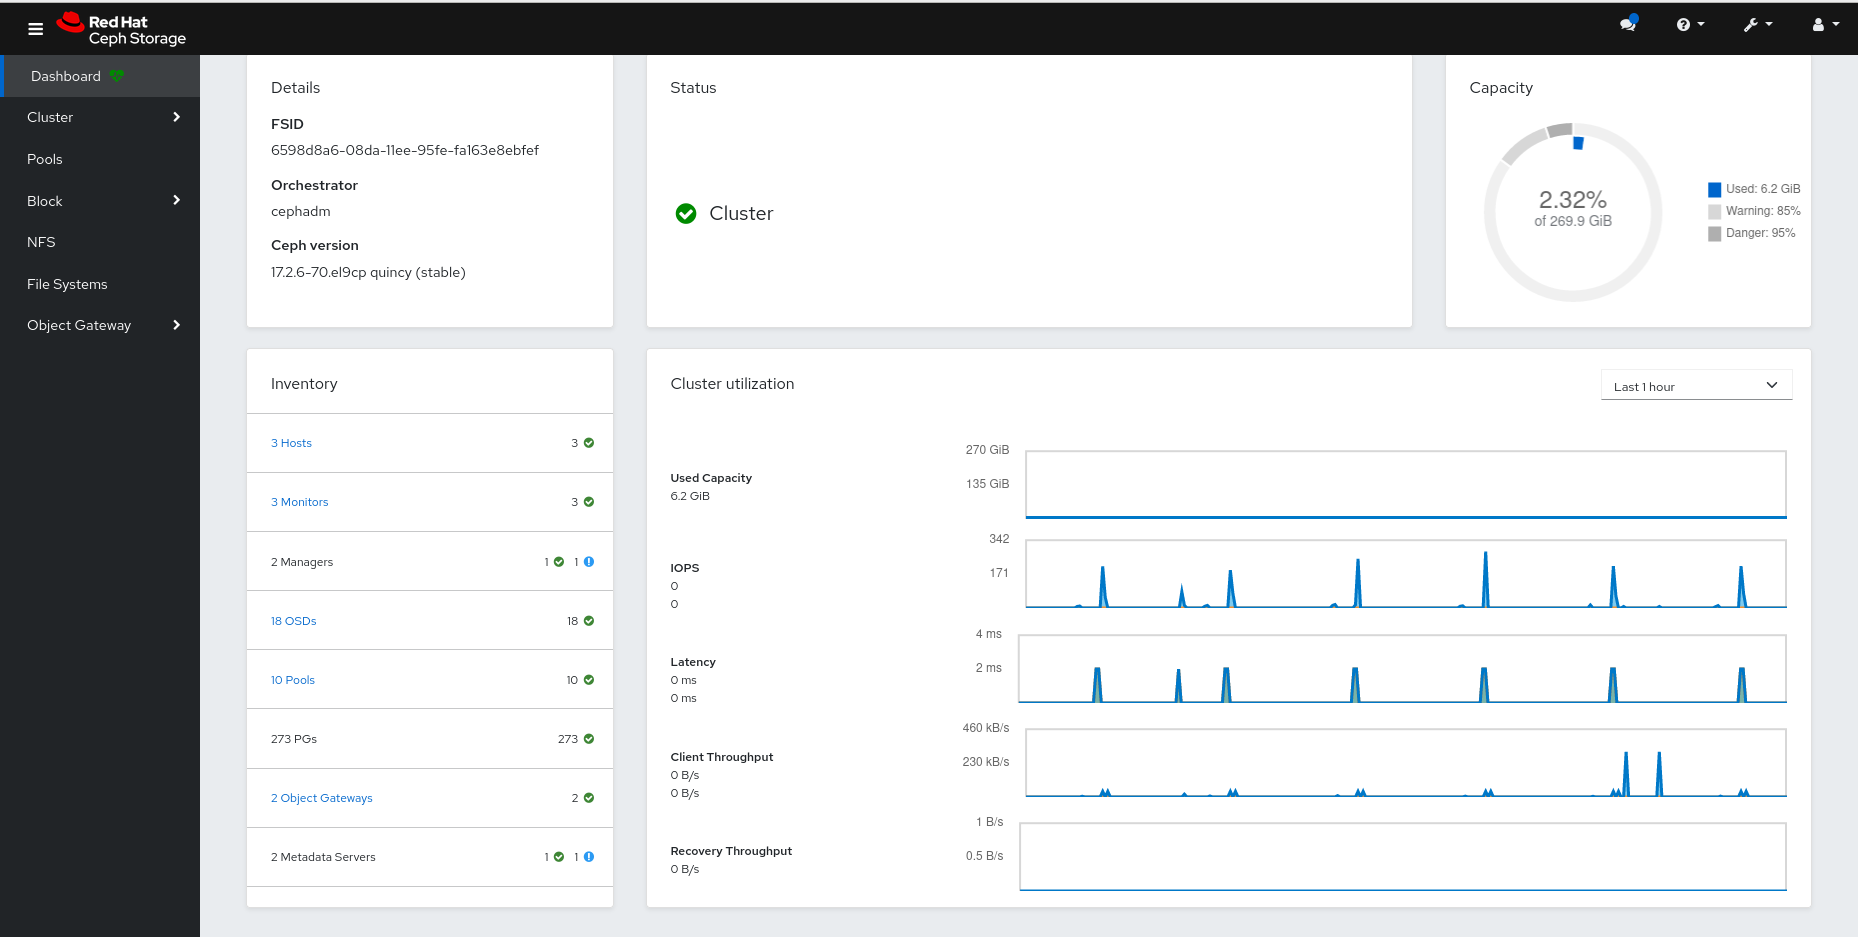
After logging in, the dashboard default landing page is displayed, which provides details, a high-level overview of status, performance, inventory, and capacity metrics of the Red Hat Ceph Storage cluster.
Figure 2.1. Ceph dashboard landing page
-
Click the menu icon (
 ) on the dashboard landing page to collapse or display the options in the vertical menu.
Additional Resources
- For more information, see Changing the dashboard password using the Ceph dashboard in the Red Hat Ceph Storage Dashboard guide.
2.3. Expanding the cluster on the Ceph dashboard
You can use the dashboard to expand the Red Hat Ceph Storage cluster for adding hosts, adding OSDs, and creating services such as Alertmanager, Cephadm-exporter, CephFS-mirror, Grafana, ingress, MDS, NFS, node-exporter, Prometheus, RBD-mirror, and Ceph Object Gateway.
Once you bootstrap a new storage cluster, the Ceph Monitor and Ceph Manager daemons are created and the cluster is in HEALTH_WARN state. After creating all the services for the cluster on the dashboard, the health of the cluster changes from HEALTH_WARN to HEALTH_OK status.
Prerequisites
- Bootstrapped storage cluster. See Bootstrapping a new storage cluster section in the Red Hat Ceph Storage Installation Guide for more details.
-
At least
cluster-managerrole for the user on the Red Hat Ceph Storage Dashboard. See the User roles and permissions on the Ceph dashboard section in the Red Hat Ceph Storage Dashboard Guide for more details.
Procedure
Copy the admin key from the bootstrapped host to other hosts:
Syntax
ssh-copy-id -f -i /etc/ceph/ceph.pub root@HOST_NAMEExample
[ceph: root@host01 /]# ssh-copy-id -f -i /etc/ceph/ceph.pub root@host02
[ceph: root@host01 /]# ssh-copy-id -f -i /etc/ceph/ceph.pub root@host03
- Log in to the dashboard with the default credentials provided during bootstrap.
- Change the password and log in to the dashboard with the new password .
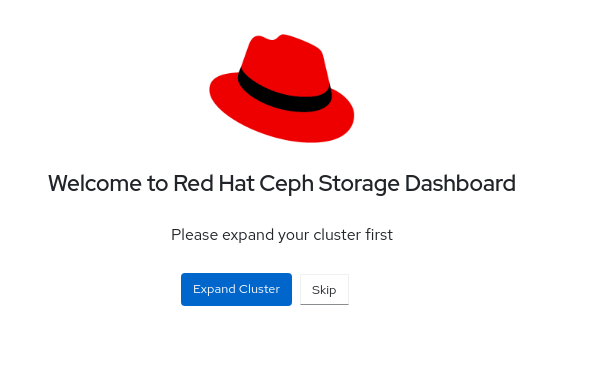
On the landing page, click Expand Cluster.
Figure 2.2. Expand cluster
Add hosts:
- In the Add Hosts window, click +Add.
Provide the hostname. This is same as the hostname that was provided while copying the key from the bootstrapped host.
NoteYou can use the tool tip in the Add Hosts dialog box for more details.
- Optional: Provide the respective IP address of the host.
- Optional: Select the labels for the hosts on which the services are going to be created.
- Click Add Host.
- Follow the above steps for all the hosts in the storage cluster.
- In the Add Hosts window, click Next.
Create OSDs:
- In the Create OSDs window, for Primary devices, Click +Add.
- In the Primary Devices window, filter for the device and select the device.
- Click Add.
- Optional: In the Create OSDs window, if you have any shared devices such as WAL or DB devices, then add the devices.
- Optional: Click on the check-box Encryption to encrypt the features.
- In the Create OSDs window, click Next.
Create services:
- In the Create Services window, click +Create.
In the Create Service dialog box,
- Select the type of the service from the drop-down.
- Provide the service ID, a unique name of the service.
- Provide the placement by hosts or label.
- Select the hosts.
- Provide the number of daemons or services that need to be deployed.
- Click Create Service.
- In the Create Service window, Click Next.
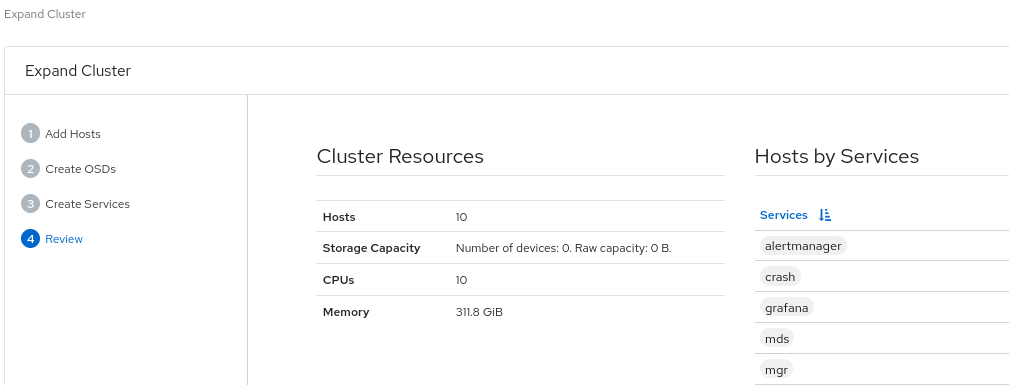
Review the Cluster Resources, Hosts by Services, Host Details. If you want to edit any parameter, click Back and follow the above steps.
Figure 2.3. Review cluster
- Click Expand Cluster.
- You get a notification that the cluster expansion was successful.
- The cluster health changes to HEALTH_OK status on the dashboard.
Verification
Log in to the
cephadmshell:Example
[root@host01 ~]# cephadm shell
Run the
ceph -scommand.Example
[ceph: root@host01 /]# ceph -s
The health of the cluster is HEALTH_OK.
Additional Resources
- See the User roles and permissions on the Ceph dashboard section in the Red Hat Ceph Storage Dashboard Guide for more details.
- See the Red Hat Ceph Storage Installation Guide for more details.
2.4. Toggling Ceph dashboard features
You can customize the Red Hat Ceph Storage dashboard components by enabling or disabling features on demand. All features are enabled by default. When disabling a feature, the web-interface elements become hidden and the associated REST API end-points reject any further requests for that feature. Enabling and disabling dashboard features can be done from the command-line interface or the web interface.
Available features:
Ceph Block Devices:
-
Image management,
rbd -
Mirroring,
mirroring
-
Image management,
-
Ceph Filesystem,
cephfs -
Ceph Object Gateway,
rgw -
NFS Ganesha gateway,
nfs
By default, the Ceph Manager is collocated with the Ceph Monitor.
You can disable multiple features at once.
Once a feature is disabled, it can take up to 20 seconds to reflect the change in the web interface.
Prerequisites
- Installation and configuration of the Red Hat Ceph Storage dashboard software.
- User access to the Ceph Manager host or the dashboard web interface.
- Root level access to the Ceph Manager host.
Procedure
To toggle the dashboard features from the dashboard web interface:
- On the dashboard landing page, navigate to Cluster drop-down menu.
- Select Manager Modules, and then select Dashboard.
- In the Edit Manager module page, you can enable or disable the dashboard features by checking or unchecking the selection box next to the feature name.
- Once the selections have been made, scroll down and click Update.
To toggle the dashboard features from the command-line interface:
Log in to the Cephadm shell:
Example
[root@host01 ~]# cephadm shell
List the feature status:
Example
[ceph: root@host01 /]# ceph dashboard feature status
Disable a feature:
[ceph: root@host01 /]# ceph dashboard feature disable rgw
This example disables the Ceph Object Gateway feature.
Enable a feature:
[ceph: root@host01 /]# ceph dashboard feature enable cephfs
This example enables the Ceph Filesystem feature.
2.5. Understanding the landing page of the Ceph dashboard
The landing page displays an overview of the entire Ceph cluster using navigation bars and individual panels.
The navigation bar provides the following options:
- Messages about tasks and notifications.
- Link to the documentation, Ceph Rest API, and details about the Red Hat Ceph Storage Dashboard.
- Link to user management and telemetry configuration.
- Link to change password and sign out of the dashboard.
Figure 2.4. Navigation bar

Apart from that, the individual panel displays specific information about the state of the cluster.
Categories
The landing page organizes panels into the following three categories:
- Status
- Capacity
- Performance
Figure 2.5. Ceph dashboard landing page
Status panel
The status panels display the health of the cluster and host and daemon states.
Cluster Status: Displays the current health status of the Ceph storage cluster.
Hosts: Displays the total number of hosts in the Ceph storage cluster.
Monitors: Displays the number of Ceph Monitors and the quorum status.
OSDs: Displays the total number of OSDs in the Ceph Storage cluster and the number that are up, and in.
Managers: Displays the number and status of the Manager Daemons.
Object Gateways: Displays the number of Object Gateways in the Ceph storage cluster.
Metadata Servers: Displays the number and status of metadata servers for Ceph Filesystems (CephFS).
Capacity panel
The capacity panel displays storage usage metrics.
Raw Capacity: Displays the utilization and availability of the raw storage capacity of the cluster.
Objects: Displays the total number of objects in the pools and a graph dividing objects into states of Healthy, Misplaced, Degraded, or Unfound.
PG Status: Displays the total number of Placement Groups and a graph dividing PGs into states of Clean, Working, Warning, or Unknown. To simplify display of PG states Working and Warning actually each encompass multiple states.
The Working state includes PGs with any of these states:
- activating
- backfill_wait
- backfilling
- creating
- deep
- degraded
- forced_backfill
- forced_recovery
- peering
- peered
- recovering
- recovery_wait
- repair
- scrubbing
- snaptrim
- snaptrim_wait
The Warning state includes PGs with any of these states:
- backfill_toofull
- backfill_unfound
- down
- incomplete
- inconsistent
- recovery_toofull
- recovery_unfound
- remapped
- snaptrim_error
- stale
- undersized
Pools: Displays the number of storage pools in the Ceph cluster.
PGs per OSD: Displays the number of placement groups per OSD.
Performance panel
The performance panel display information related to data transfer speeds.
Client Read/Write: Displays total input/output operations per second, reads per second, and writes per second.
Client Throughput: Displays total client throughput, read throughput, and write throughput.
Recovery Throughput: Displays the rate of cluster healing and balancing operations. For example, the status of any background data that may be moving due to a loss of disk is displayed.
Scrubbing: Displays whether Ceph is scrubbing data to verify its integrity.
Additional Resources
- For more information, see Monitoring the cluster on the Ceph dashboard section in the Red Hat Ceph Storage Dashboard guide for more information.
2.6. Changing the dashboard password using the Ceph dashboard
By default, the password for accessing dashboard is randomly generated by the system while bootstrapping the cluster. You have to change the password the first time you log in to the Red Hat Ceph Storage dashboard. You can change the password for the admin user using the dashboard.
Prerequisites
- A running Red Hat Ceph Storage cluster.
Procedure
Log in to the dashboard:
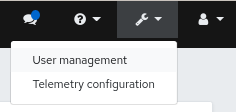
https://HOST_NAME:8443Click the Dashboard Settings icon and then click User management.
Figure 2.6. User management
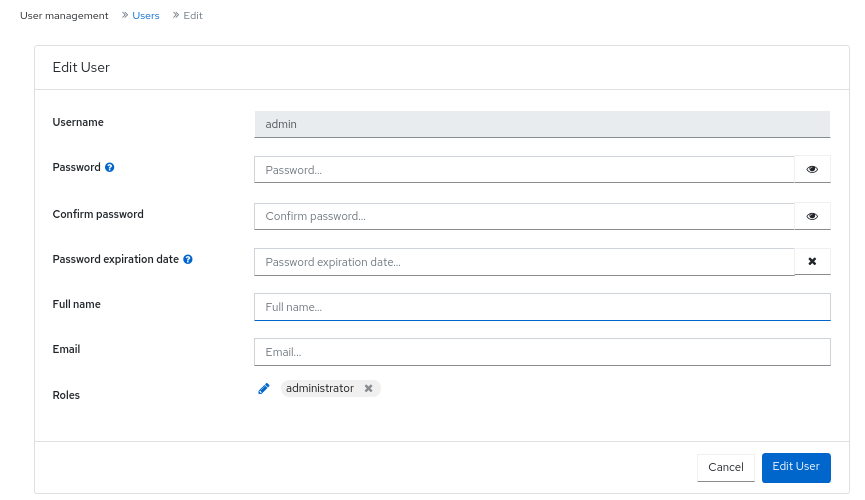
- To change the password of admin, click it’s row.
- From the Edit drop-down menu, select Edit.
In the Edit User window, enter the new password, and change the other parameters, and then Click Edit User.
Figure 2.7. Edit user management
You will be logged out and redirected to the log-in screen. A notification appears confirming the password change.
2.7. Changing the Ceph dashboard password using the command line interface
If you have forgotten your Ceph dashboard password, you can change the password using the command line interface.
Prerequisites
- A running Red Hat Ceph Storage cluster.
- Root-level access to the host on which the dashboard is installed.
Procedure
Log into the Cephadm shell:
Example
[root@host01 ~]# cephadm shell
Create the
dashboard_password.ymlfile:Example
[ceph: root@host01 /]# touch dashboard_password.yml
Edit the file and add the new dashboard password:
Example
[ceph: root@host01 /]# vi dashboard_password.yml
Reset the dashboard password:
Syntax
ceph dashboard ac-user-set-password DASHBOARD_USERNAME -i PASSWORD_FILE
Example
[ceph: root@host01 /]# ceph dashboard ac-user-set-password admin -i dashboard_password.yml
{"username": "admin", "password": "$2b$12$i5RmvN1PolR61Fay0mPgt.GDpcga1QpYsaHUbJfoqaHd1rfFFx7XS", "roles": ["administrator"], "name": null, "email": null, "lastUpdate": , "enabled": true, "pwdExpirationDate": null, "pwdUpdateRequired": false}
Verification
- Log in to the dashboard with your new password.
2.8. Setting admin user password for Grafana
By default, cephadm does not create an admin user for Grafana. With the Ceph Orchestrator, you can create an admin user and set the password.
With these credentials, you can log in to the storage cluster’s Grafana URL with the given password for the admin user.
Prerequisites
- A running Red Hat Ceph Storage cluster with the monitoring stack installed.
-
Root-level access to the
cephadmhost. -
The
dashboardmodule enabled.
Procedure
As a root user, create a
grafana.ymlfile and provide the following details:Syntax
service_type: grafana
spec:
  initial_admin_password: PASSWORD
Example
service_type: grafana
spec:
  initial_admin_password: mypassword
Mount the
grafana.ymlfile under a directory in the container:Example
[root@host01 ~]# cephadm shell --mount grafana.yml:/var/lib/ceph/grafana.yml
NoteEvery time you exit the shell, you have to mount the file in the container before deploying the daemon.
Optional: Check if the
dashboardCeph Manager module is enabled:Example
[ceph: root@host01 /]# ceph mgr module ls
Optional: Enable the
dashboardCeph Manager module:Example
[ceph: root@host01 /]# ceph mgr module enable dashboard
Apply the specification using the
orchcommand:Syntax
ceph orch apply -i FILE_NAME.ymlExample
[ceph: root@host01 /]# ceph orch apply -i /var/lib/ceph/grafana.yml
Redeploy
grafanaservice:Example
[ceph: root@host01 /]# ceph orch redeploy grafana
This creates an admin user called
adminwith the given password and the user can log in to the Grafana URL with these credentials.
Verification:
Log in to Grafana with the credentials:
Syntax
https://HOST_NAME:PORT
Example
https://host01:3000/
2.9. Enabling Red Hat Ceph Storage Dashboard manually
If you have installed a Red Hat Ceph Storage cluster by using --skip-dashboard option during bootstrap, you can see that the dashboard URL and credentials are not available in the bootstrap output. You can enable the dashboard manually using the command-line interface. Although the monitoring stack components such as Prometheus, Grafana, Alertmanager, and node-exporter are deployed, they are disabled and you have to enable them manually.
Prerequisite
-
A running Red Hat Ceph Storage cluster installed with
--skip-dashboardoption during bootstrap. - Root-level access to the host on which the dashboard needs to be enabled.
Procedure
Log into the Cephadm shell:
Example
[root@host01 ~]# cephadm shell
Check the Ceph Manager services:
Example
[ceph: root@host01 /]# ceph mgr services

{
    "prometheus": "http://10.8.0.101:9283/"
}
You can see that the Dashboard URL is not configured.
Enable the dashboard module:
Example
[ceph: root@host01 /]# ceph mgr module enable dashboard
Create the self-signed certificate for the dashboard access:
Example
[ceph: root@host01 /]# ceph dashboard create-self-signed-cert
NoteYou can disable the certificate verification to avoid certification errors.
Check the Ceph Manager services:
Example
[ceph: root@host01 /]# ceph mgr services

{
    "dashboard": "https://10.8.0.101:8443/",
    "prometheus": "http://10.8.0.101:9283/"
}
Create the admin user and password to access the Red Hat Ceph Storage dashboard:
Syntax
echo -n "PASSWORD" > PASSWORD_FILE
ceph dashboard ac-user-create admin -i PASSWORD_FILE administrator
Example
[ceph: root@host01 /]# echo -n "p@ssw0rd" > password.txt
[ceph: root@host01 /]# ceph dashboard ac-user-create admin -i password.txt administrator
- Enable the monitoring stack. See the Enabling monitoring stack section in the Red Hat Ceph Storage Dashboard Guide for details.
Additional Resources
- See the Deploying the monitoring stack using the Ceph Orchestrator section in the Red Hat Ceph Storage Operations Guide.
2.10. Creating an admin account for syncing users to the Ceph dashboard
You have to create an admin account to synchronize users to the Ceph dashboard.
After creating the account, use Red Hat Single Sign-on (SSO) to synchronize users to the Ceph dashboard. See the Syncing users to the Ceph dashboard using Red Hat Single Sign-On section in the Red Hat Ceph Storage Dashboard Guide.
Prerequisites
- A running Red Hat Ceph Storage cluster.
- Dashboard is installed.
- Admin level access to the dashboard.
- Users are added to the dashboard.
- Root-level access on all the hosts.
- Red hat Single Sign-On installed from a ZIP file. See the Installing Red Hat Single Sign-On from a zip file for additional information.
Procedure
- Download the Red Hat Single Sign-On 7.4.0 Server on the system where Red Hat Ceph Storage is installed.
Unzip the folder:
[root@host01 ~]# unzip rhsso-7.4.0.zip
Navigate to the
standalone/configurationdirectory and open thestandalone.xmlfor editing:[root@host01 ~]# cd standalone/configuration [root@host01 configuration]# vi standalone.xml
-
Replace all instances of
localhostand two instances of127.0.0.1with the IP address of the machine where Red Hat SSO is installed. Optional: For Red Hat Enterprise Linux 8, users might get Certificate Authority (CA) issues. Import the custom certificates from CA and move them into the keystore with the exact java version.
Example
[root@host01 ~]# keytool -import -noprompt -trustcacerts -alias ca -file ../ca.cer -keystore /etc/java/java-1.8.0-openjdk/java-1.8.0-openjdk-1.8.0.272.b10-3.el8_3.x86_64/lib/security/cacert
To start the server from the
bindirectory ofrh-sso-7.4folder, run thestandaloneboot script:[root@host01 bin]# ./standalone.sh
Create the admin account in https: IP_ADDRESS :8080/auth with a username and password:
NoteYou have to create an admin account only the first time that you log into the console
- Log into the admin console with the credentials created.
Additional Resources
- For adding roles for users on the dashboard, see the Creating roles on the Ceph dashboard section in the Red Hat Ceph Storage Dashboard Guide for more information.
- For creating users on the dashboard, see the Creating users on the Ceph dashboard section in the Red Hat Ceph Storage Dashboard Guide.
2.11. Syncing users to the Ceph dashboard using Red Hat Single Sign-On
You can use Red Hat Single Sign-on (SSO) with Lightweight Directory Access Protocol (LDAP) integration to synchronize users to the Red Hat Ceph Storage Dashboard.
The users are added to specific realms in which they can access the dashboard through SSO without any additional requirements of a password.
Prerequisites
- A running Red Hat Ceph Storage cluster.
- Dashboard is installed.
- Admin level access to the dashboard.
- Users are added to the dashboard. See the Creating users on Ceph dashboard section in the Red Hat Ceph Storage Dashboard Guide.
- Root-level access on all the hosts.
- Admin account created for syncing users. See the Creating an admin account for syncing users to the Ceph dashboard section in the Red Hat Ceph Storage Dashboard Guide.
Procedure
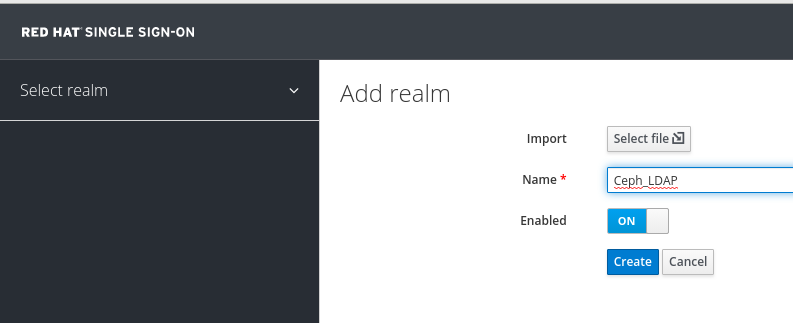
- To create a realm, click the Master drop-down menu. In this realm, you can provide access to users and applications.
In the Add Realm window, enter a case-sensitive realm name and set the parameter Enabled to ON and click Create:
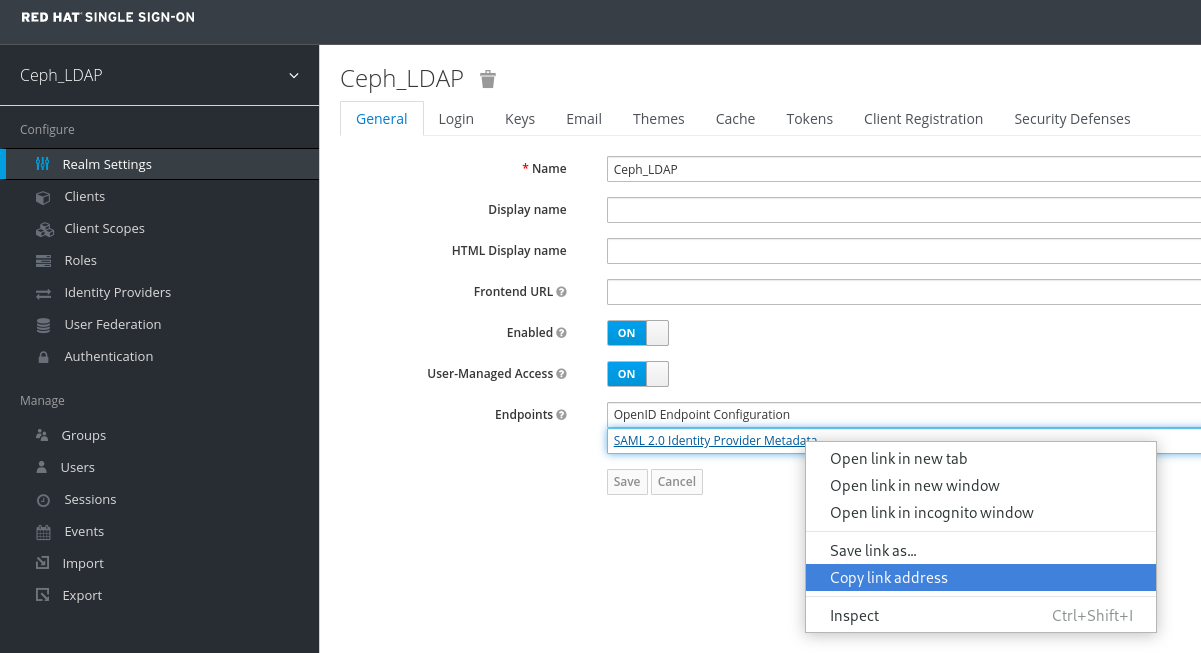
In the Realm Settings tab, set the following parameters and click Save:
- Enabled - ON
- User-Managed Access - ON
Make a note of the link address of SAML 2.0 Identity Provider Metadata to paste in Client Settings.
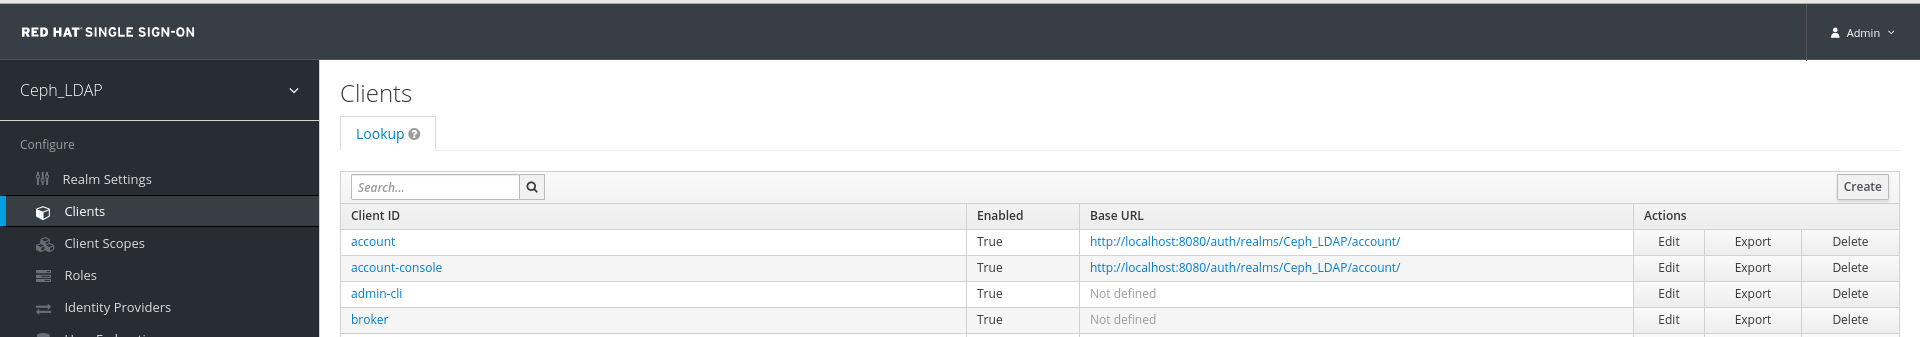
In the Clients tab, click Create:
In the Add Client window, set the following parameters and click Save:
Client ID - BASE_URL:8443/auth/saml2/metadata
Example
https://example.ceph.redhat.com:8443/auth/saml2/metadata
- Client Protocol - saml
In the Client window, under Settings tab, set the following parameters:
Table 2.2. Client Settings tab
Name of the parameter Syntax Example Client IDBASE_URL:8443/auth/saml2/metadata
https://example.ceph.redhat.com:8443/auth/saml2/metadata
EnabledON
ON
Client Protocolsaml
saml
Include AuthnStatementON
ON
Sign DocumentsON
ON
Signature AlgorithmRSA_SHA1
RSA_SHA1
SAML Signature Key NameKEY_ID
KEY_ID
Valid Redirect URLsBASE_URL:8443/*
https://example.ceph.redhat.com:8443/*
Base URLBASE_URL:8443
https://example.ceph.redhat.com:8443/
Master SAML Processing URLhttps://localhost:8080/auth/realms/REALM_NAME/protocol/saml/descriptor
https://localhost:8080/auth/realms/Ceph_LDAP/protocol/saml/descriptor
NotePaste the link of SAML 2.0 Identity Provider Metadata from Realm Settings tab.
Under Fine Grain SAML Endpoint Configuration, set the following parameters and click Save:
Table 2.3. Fine Grain SAML configuration
Name of the parameter Syntax Example Assertion Consumer Service POST Binding URLBASE_URL:8443/#/dashboard
https://example.ceph.redhat.com:8443/#/dashboard
Assertion Consumer Service Redirect Binding URLBASE_URL:8443/#/dashboard
https://example.ceph.redhat.com:8443/#/dashboard
Logout Service Redirect Binding URLBASE_URL:8443/
https://example.ceph.redhat.com:8443/
In the Clients window, Mappers tab, set the following parameters and click Save:
Table 2.4. Client Mappers tab
Name of the parameter Value Protocolsaml
Nameusername
Mapper PropertyUser Property
Propertyusername
SAML Attribute nameusername
In the Clients Scope tab, select role_list:
- In Mappers tab, select role list, set the Single Role Attribute to ON.
Select User_Federation tab:
- In User Federation window, select ldap from the drop-down menu:
In User_Federation window, Settings tab, set the following parameters and click Save:
Table 2.5. User Federation Settings tab
Name of the parameter Value Console Display Namerh-ldap
Import UsersON
Edit_ModeREAD_ONLY
Username LDAP attributeusername
RDN LDAP attributeusername
UUID LDAP attributensuniqueid
User Object ClassesinetOrgPerson
organizationalPersonrhatPerson
Connection URLExample: ldap://ldap.corp.redhat.com Click Test Connection. You will get a notification that the LDAP connection is successful.
Users DNou=users, dc=example, dc=com
Bind Typesimple
Click Test authentication. You will get a notification that the LDAP authentication is successful.
In Mappers tab, select first name row and edit the following parameter and Click Save:
- LDAP Attribute - givenName
In User_Federation tab, Settings tab, Click Synchronize all users:
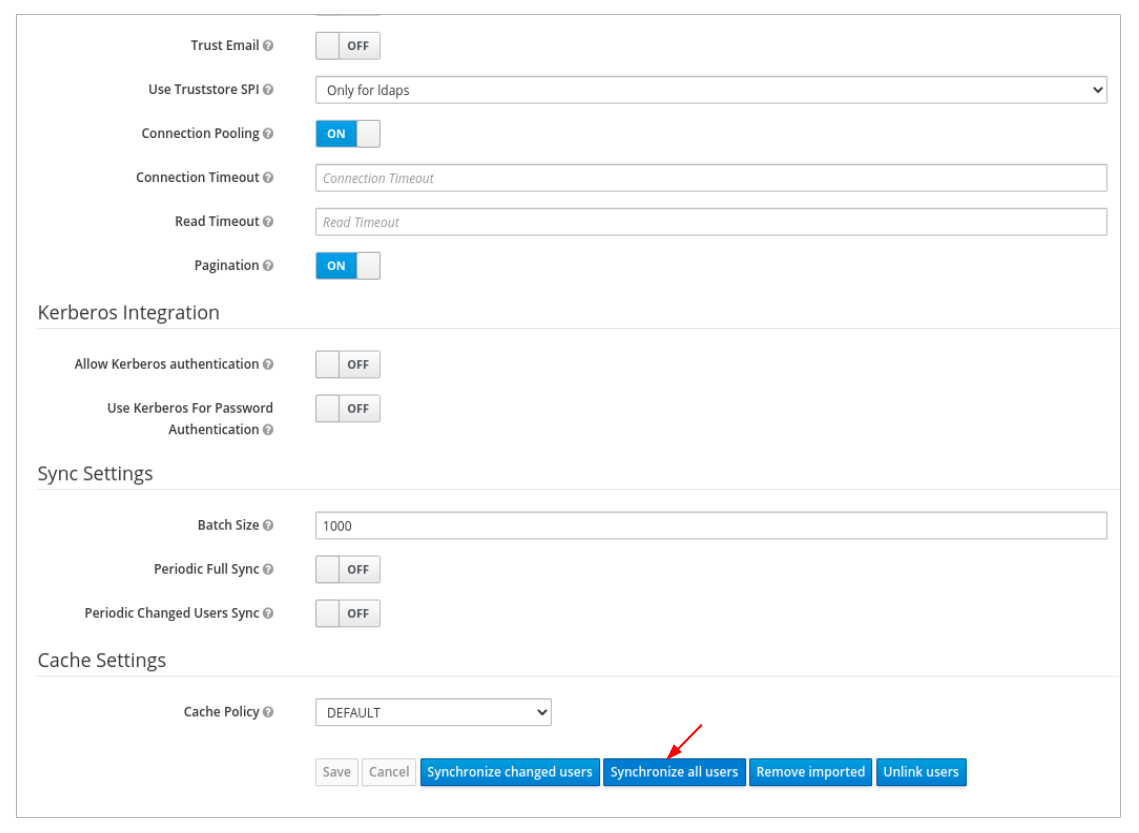
You will get a notification that the sync of users is finished successfully.
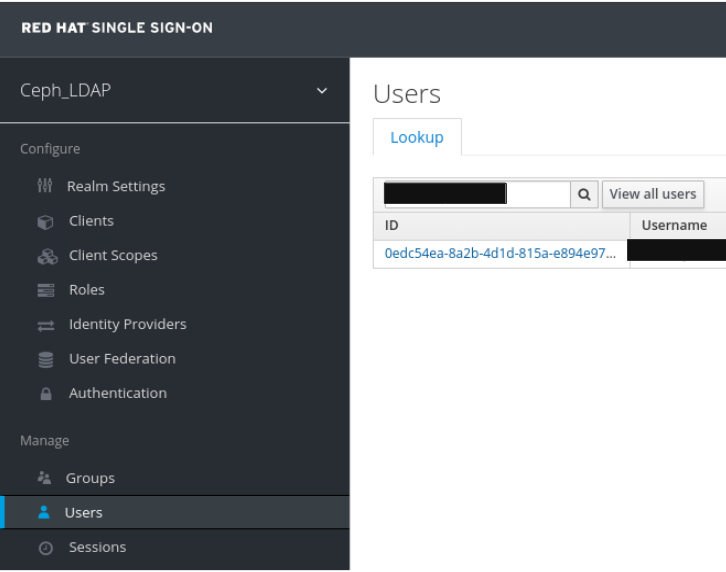
In the Users tab, search for the user added to the dashboard and click the Search icon:
To view the user , click the specific row. You should see the federation link as the name provided for the User Federation.
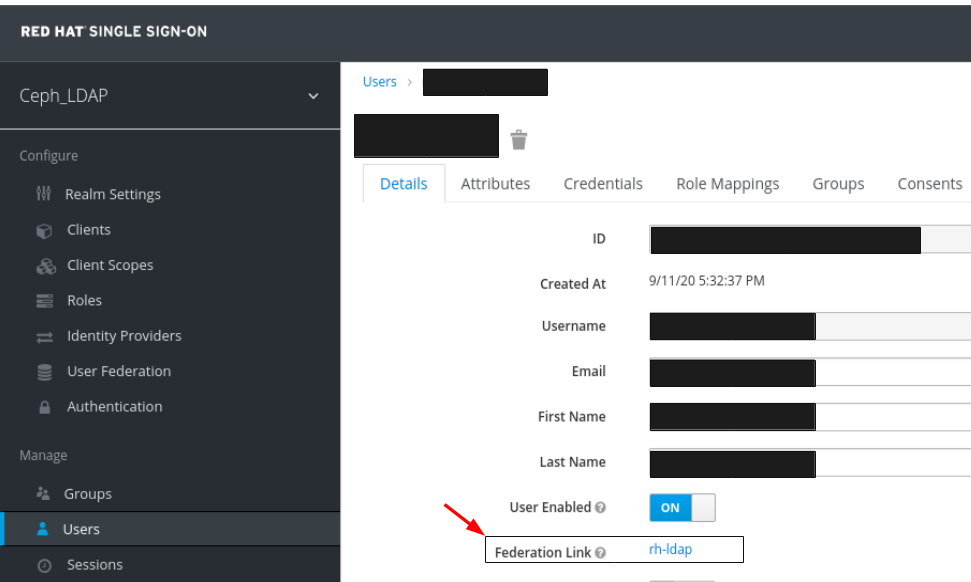 Important
Do not add users manually as the users will not be synchronized by LDAP. If added manually, delete the user by clicking Delete.
Verification
Users added to the realm and the dashboard can access the Ceph dashboard with their mail address and password.
Example
https://example.ceph.redhat.com:8443
Additional Resources
- For adding roles for users on the dashboard, see the Creating roles on the Ceph dashboard section in the Red Hat Ceph Storage Dashboard Guide for more information.
2.12. Enabling Single Sign-On for the Ceph Dashboard
The Ceph Dashboard supports external authentication of users with the Security Assertion Markup Language (SAML) 2.0 protocol. Before using single sign-On (SSO) with the Ceph dashboard, create the dashboard user accounts and assign the desired roles. The Ceph Dashboard performs authorization of the users and the authentication process is performed by an existing Identity Provider (IdP). You can enable single sign-on using the SAML protocol.
Prerequisites
- A running Red Hat Ceph Storage cluster.
- Installation of the Ceph Dashboard.
- Root-level access to The Ceph Manager hosts.
Procedure
To configure SSO on Ceph Dashboard, run the following command:
Syntax
cephadm shell CEPH_MGR_HOST ceph dashboard sso setup saml2 CEPH_DASHBOARD_BASE_URL IDP_METADATA IDP_USERNAME_ATTRIBUTE IDP_ENTITY_ID SP_X_509_CERT SP_PRIVATE_KEY
Example
[root@host01 ~]# cephadm shell host01 ceph dashboard sso setup saml2 https://dashboard_hostname.ceph.redhat.com:8443 idp-metadata.xml username https://10.70.59.125:8080/auth/realms/realm_name /home/certificate.txt /home/private-key.txt
Replace
-
CEPH_MGR_HOST with Ceph
mgrhost. For example,host01 - CEPH_DASHBOARD_BASE_URL with the base URL where Ceph Dashboard is accessible.
- IDP_METADATA with the URL to remote or local path or content of the IdP metadata XML. The supported URL types are http, https, and file.
- Optional: IDP_USERNAME_ATTRIBUTE with the attribute used to get the username from the authentication response. Defaults to uid.
- Optional: IDP_ENTITY_ID with the IdP entity ID when more than one entity ID exists on the IdP metadata.
- Optional: SP_X_509_CERT with the file path of the certificate used by Ceph Dashboard for signing and encryption.
- Optional: SP_PRIVATE_KEY with the file path of the private key used by Ceph Dashboard for signing and encryption.
-
CEPH_MGR_HOST with Ceph
Verify the current SAML 2.0 configuration:
Syntax
cephadm shell CEPH_MGR_HOST ceph dashboard sso show saml2Example
[root@host01 ~]# cephadm shell host01 ceph dashboard sso show saml2
To enable SSO, run the following command:
Syntax
cephadm shell CEPH_MGR_HOST ceph dashboard sso enable saml2
SSO is "enabled" with "SAML2" protocol.
Example
[root@host01 ~]# cephadm shell host01 ceph dashboard sso enable saml2
Open your dashboard URL.
Example
https://dashboard_hostname.ceph.redhat.com:8443
- On the SSO page, enter the login credentials. SSO redirects to the dashboard web interface.
Additional Resources
- To disable single sign-on, see Disabling Single Sign-on for the Ceph Dashboard in the Red Hat Ceph StorageDashboard Guide.
2.13. Disabling Single Sign-On for the Ceph Dashboard
You can disable single sign-on for Ceph Dashboard using the SAML 2.0 protocol.
Prerequisites
- A running Red Hat Ceph Storage cluster.
- Installation of the Ceph Dashboard.
- Root-level access to The Ceph Manager hosts.
- Single sign-on enabled for Ceph Dashboard
Procedure
To view status of SSO, run the following command:
Syntax
cephadm shell CEPH_MGR_HOST ceph dashboard sso statusExample
[root@host01 ~]#  cephadm shell host01 ceph dashboard sso status
SSO is "enabled" with "SAML2" protocol.
To disable SSO, run the following command:
Syntax
cephadm shell CEPH_MGR_HOST ceph dashboard sso disable
SSO is "disabled".
Example
[root@host01 ~]# cephadm shell host01 ceph dashboard sso disable
Additional Resources
- To enable single sign-on, see Enabling Single Sign-on for the Ceph Dashboard in the Red Hat Ceph StorageDashboard Guide.