
Administration Guide
Administration of Red Hat Ceph Storage
Abstract
Chapter 1. Ceph administration
A Red Hat Ceph Storage cluster is the foundation for all Ceph deployments. After deploying a Red Hat Ceph Storage cluster, there are administrative operations for keeping a Red Hat Ceph Storage cluster healthy and performing optimally.
The Red Hat Ceph Storage Administration Guide helps storage administrators to perform such tasks as:
- How do I check the health of my Red Hat Ceph Storage cluster?
- How do I start and stop the Red Hat Ceph Storage cluster services?
- How do I add or remove an OSD from a running Red Hat Ceph Storage cluster?
- How do I manage user authentication and access controls to the objects stored in a Red Hat Ceph Storage cluster?
- I want to understand how to use overrides with a Red Hat Ceph Storage cluster.
- I want to monitor the performance of the Red Hat Ceph Storage cluster.
A basic Ceph storage cluster consist of two types of daemons:
- A Ceph Object Storage Device (OSD) stores data as objects within placement groups assigned to the OSD
- A Ceph Monitor maintains a master copy of the cluster map
A production system will have three or more Ceph Monitors for high availability and typically a minimum of 50 OSDs for acceptable load balancing, data re-balancing and data recovery.
Chapter 2. Understanding process management for Ceph
As a storage administrator, you can manipulate the various Ceph daemons by type or instance in a Red Hat Ceph Storage cluster. Manipulating these daemons allows you to start, stop and restart all of the Ceph services as needed.
2.1. Ceph process management
In Red Hat Ceph Storage, all process management is done through the Systemd service. Each time you want to start, restart, and stop the Ceph daemons, you must specify the daemon type or the daemon instance.
Additional Resources
-
For more information on using
systemd, see Managing system services with systemctl.
2.2. Starting, stopping, and restarting all Ceph daemons using systemctl command
You can start, stop, and restart all Ceph daemons as the root user from the host where you want to stop the Ceph daemons.
Prerequisites
- A running Red Hat Ceph Storage cluster.
-
Having
rootaccess to the node.
Procedure
On the host where you want to start, stop, and restart the daemons, run the systemctl service to get the SERVICE_ID of the service.
Example
[root@host01 ~]# systemctl --type=service
ceph-499829b4-832f-11eb-8d6d-001a4a000635@mon.host01.service
Starting all Ceph daemons:
Syntax
systemctl start SERVICE_IDExample
[root@host01 ~]# systemctl start ceph-499829b4-832f-11eb-8d6d-001a4a000635@mon.host01.service
Stopping all Ceph daemons:
Syntax
systemctl stop SERVICE_IDExample
[root@host01 ~]# systemctl stop ceph-499829b4-832f-11eb-8d6d-001a4a000635@mon.host01.service
Restarting all Ceph daemons:
Syntax
systemctl restart SERVICE_IDExample
[root@host01 ~]# systemctl restart ceph-499829b4-832f-11eb-8d6d-001a4a000635@mon.host01.service
2.3. Starting, stopping, and restarting all Ceph services
Ceph services are logical groups of Ceph daemons of the same type, configured to run in the same Red Hat Ceph Storage cluster. The orchestration layer in Ceph allows the user to manage these services in a centralized way, making it easy to execute operations that affect all the Ceph daemons that belong to the same logical service. The Ceph daemons running in each host are managed through the Systemd service. You can start, stop, and restart all Ceph services from the host where you want to manage the Ceph services.
If you want to start,stop, or restart a specific Ceph daemon in a specific host, you need to use the SystemD service. To obtain a list of the SystemD services running in a specific host, connect to the host, and run the following command:
Example
[root@host01 ~]# systemctl list-units “ceph*”
The output will give you a list of the service names that you can use, to manage each Ceph daemon.
Prerequisites
- A running Red Hat Ceph Storage cluster.
-
Having
rootaccess to the node.
Procedure
Log into the Cephadm shell:
Example
[root@host01 ~]# cephadm shell
Run the
ceph orch lscommand to get a list of Ceph services configured in the Red Hat Ceph Storage cluster and to get the specific service ID.Example
[ceph: root@host01 /]# ceph orch ls
NAME                       RUNNING  REFRESHED  AGE  PLACEMENT  IMAGE NAME                                                       IMAGE ID
alertmanager                   1/1  4m ago     4M   count:1    registry.redhat.io/openshift4/ose-prometheus-alertmanager:v4.5   b7bae610cd46
crash                          3/3  4m ago     4M   *          registry.redhat.io/rhceph-alpha/rhceph-6-rhel9:latest            c88a5d60f510
grafana                        1/1  4m ago     4M   count:1    registry.redhat.io/rhceph-alpha/rhceph-6-dashboard-rhel9:latest  bd3d7748747b
mgr                            2/2  4m ago     4M   count:2    registry.redhat.io/rhceph-alpha/rhceph-6-rhel9:latest            c88a5d60f510
mon                            2/2  4m ago     10w  count:2    registry.redhat.io/rhceph-alpha/rhceph-6-rhel9:latest            c88a5d60f510
nfs.foo                        0/1  -          -    count:1    <unknown>                                                        <unknown>
node-exporter                  1/3  4m ago     4M   *          registry.redhat.io/openshift4/ose-prometheus-node-exporter:v4.5  mix
osd.all-available-devices      5/5  4m ago     3M   *          registry.redhat.io/rhceph-alpha/rhceph-6-rhel9:latest            c88a5d60f510
prometheus                     1/1  4m ago     4M   count:1    registry.redhat.io/openshift4/ose-prometheus:v4.6                bebb0ddef7f0
rgw.test_realm.test_zone       2/2  4m ago     3M   count:2    registry.redhat.io/rhceph-alpha/rhceph-6-rhel9:latest            c88a5d60f510
To start a specific service, run the following command:
Syntax
ceph orch start SERVICE_IDExample
[ceph: root@host01 /]# ceph orch start node-exporter
To stop a specific service, run the following command:
ImportantThe
ceph orch stop SERVICE_IDcommand results in the Red Hat Ceph Storage cluster being inaccessible, only for the MON and MGR service. It is recommended to use thesystemctl stop SERVICE_IDcommand to stop a specific daemon in the host.Syntax
ceph orch stop SERVICE_IDExample
[ceph: root@host01 /]# ceph orch stop node-exporter
In the example the
ceph orch stop node-exportercommand removes all the daemons of thenode exporterservice.To restart a specific service, run the following command:
Syntax
ceph orch restart SERVICE_IDExample
[ceph: root@host01 /]# ceph orch restart node-exporter
2.4. Viewing log files of Ceph daemons that run in containers
Use the journald daemon from the container host to view a log file of a Ceph daemon from a container.
Prerequisites
- Installation of the Red Hat Ceph Storage software.
- Root-level access to the node.
Procedure
To view the entire Ceph log file, run a
journalctlcommand asrootcomposed in the following format:Syntax
journalctl -u ceph SERVICE_IDExample
[root@host01 ~]# journalctl -u ceph-499829b4-832f-11eb-8d6d-001a4a000635@osd.8.service
In the above example, you can view the entire log for the OSD with ID
osd.8.To show only the recent journal entries, use the
-foption.Syntax
journalctl -fu SERVICE_IDExample
[root@host01 ~]# journalctl -fu ceph-499829b4-832f-11eb-8d6d-001a4a000635@osd.8.service
You can also use the sosreport utility to view the journald logs. For more details about SOS reports, see the What is an sosreport and how to create one in Red Hat Enterprise Linux? solution on the Red Hat Customer Portal.
Additional Resources
-
The
journalctlmanual page.
2.5. Powering down and rebooting Red Hat Ceph Storage cluster
You can power down and reboot the Red Hat Ceph Storage cluster using two different approaches: systemctl commands and the Ceph Orchestrator. You can choose either approach to power down and reboot the cluster.
2.5.1. Powering down and rebooting the cluster using the systemctl commands
You can use the systemctl commands approach to power down and reboot the Red Hat Ceph Storage cluster. This approach follows the Linux way of stopping the services.
Prerequisites
- A running Red Hat Ceph Storage cluster.
- Root-level access.
Procedure
Powering down the Red Hat Ceph Storage cluster
- Stop the clients from using the Block Device images RADOS Gateway - Ceph Object Gateway on this cluster and any other clients.
Log into the Cephadm shell:
Example
[root@host01 ~]# cephadm shell
The cluster must be in healthy state (
Health_OKand all PGsactive+clean) before proceeding. Runceph statuson the host with the client keyrings, for example, the Ceph Monitor or OpenStack controller nodes, to ensure the cluster is healthy.Example
[ceph: root@host01 /]# ceph -s
If you use the Ceph File System (
CephFS), bring down theCephFScluster:Syntax
ceph fs set FS_NAME max_mds 1
ceph fs fail FS_NAME
ceph status
ceph fs set FS_NAME joinable false
Example
[ceph: root@host01 /]# ceph fs set cephfs max_mds 1
[ceph: root@host01 /]# ceph fs fail cephfs
[ceph: root@host01 /]# ceph status
[ceph: root@host01 /]# ceph fs set cephfs joinable false
Set the
noout,norecover,norebalance,nobackfill,nodown, andpauseflags. Run the following on a node with the client keyrings, for example, the Ceph Monitor or OpenStack controller node:Example
[ceph: root@host01 /]# ceph osd set noout
[ceph: root@host01 /]# ceph osd set norecover
[ceph: root@host01 /]# ceph osd set norebalance
[ceph: root@host01 /]# ceph osd set nobackfill
[ceph: root@host01 /]# ceph osd set nodown
[ceph: root@host01 /]# ceph osd set pause
ImportantThe above example is only for stopping the service and each OSD in the OSD node and it needs to be repeated on each OSD node.
- If the MDS and Ceph Object Gateway nodes are on their own dedicated nodes, power them off.
Shut down the OSD nodes one by one:
Example
[root@host01 ~]# systemctl stop ceph-499829b4-832f-11eb-8d6d-001a4a000635@osd.2.service
Shut down the monitor nodes one by one:
Example
[root@host01 ~]# systemctl stop ceph-499829b4-832f-11eb-8d6d-001a4a000635@mon.host01.service
- Shut down the admin node.
Rebooting the Red Hat Ceph Storage cluster
- If network equipment was involved, ensure it is powered ON and stable prior to powering ON any Ceph hosts or nodes.
- Power ON the administration node.
Power ON the monitor nodes:
Example
[root@host01 ~]# systemctl start ceph-499829b4-832f-11eb-8d6d-001a4a000635@mon.host01.service
ImportantThe above example is only for stopping the service and each OSD in the OSD node and it needs to be repeated on each OSD node.
Power ON the OSD nodes:
Example
[root@host01 ~]# systemctl start ceph-499829b4-832f-11eb-8d6d-001a4a000635@osd.2.service
- Wait for all the nodes to come up. Verify all the services are up and there are no connectivity issues between the nodes.
Unset the
noout,norecover,norebalance,nobackfill,nodownandpauseflags. Run the following on a node with the client keyrings, for example, the Ceph Monitor or OpenStack controller node:Example
[ceph: root@host01 /]# ceph osd unset noout
[ceph: root@host01 /]# ceph osd unset norecover
[ceph: root@host01 /]# ceph osd unset norebalance
[ceph: root@host01 /]# ceph osd unset nobackfill
[ceph: root@host01 /]# ceph osd unset nodown
[ceph: root@host01 /]# ceph osd unset pause
If you use the Ceph File System (
CephFS), bring theCephFScluster back up by setting thejoinableflag totrue:Syntax
ceph fs set FS_NAME joinable trueExample
[ceph: root@host01 /]# ceph fs set cephfs joinable true
Verification
-
Verify the cluster is in healthy state (
Health_OKand all PGsactive+clean). Runceph statuson a node with the client keyrings, for example, the Ceph Monitor or OpenStack controller nodes, to ensure the cluster is healthy.
Example
[ceph: root@host01 /]# ceph -s
Additional Resources
- For more information on installing Ceph, see the Red Hat Ceph Storage Installation Guide.
2.5.2. Powering down and rebooting the cluster using the Ceph Orchestrator
You can also use the capabilities of the Ceph Orchestrator to power down and reboot the Red Hat Ceph Storage cluster. In most cases, it is a single system login that can help in powering off the cluster.
The Ceph Orchestrator supports several operations, such as start, stop, and restart. You can use these commands with systemctl, for some cases, in powering down or rebooting the cluster.
Prerequisites
- A running Red Hat Ceph Storage cluster.
- Root-level access to the node.
Procedure
Powering down the Red Hat Ceph Storage cluster
- Stop the clients from using the user Block Device Image and Ceph Object Gateway on this cluster and any other clients.
Log into the Cephadm shell:
Example
[root@host01 ~]# cephadm shell
The cluster must be in healthy state (
Health_OKand all PGsactive+clean) before proceeding. Runceph statuson the host with the client keyrings, for example, the Ceph Monitor or OpenStack controller nodes, to ensure the cluster is healthy.Example
[ceph: root@host01 /]# ceph -s
If you use the Ceph File System (
CephFS), bring down theCephFScluster:Syntax
ceph fs set FS_NAME max_mds 1
ceph fs fail FS_NAME
ceph status
ceph fs set FS_NAME joinable false
ceph mds fail FS_NAME:N
Example
[ceph: root@host01 /]# ceph fs set cephfs max_mds 1
[ceph: root@host01 /]# ceph fs fail cephfs
[ceph: root@host01 /]# ceph status
[ceph: root@host01 /]# ceph fs set cephfs joinable false
[ceph: root@host01 /]# ceph mds fail cephfs:1
Set the
noout,norecover,norebalance,nobackfill,nodown, andpauseflags. Run the following on a node with the client keyrings, for example, the Ceph Monitor or OpenStack controller node:Example
[ceph: root@host01 /]# ceph osd set noout
[ceph: root@host01 /]# ceph osd set norecover
[ceph: root@host01 /]# ceph osd set norebalance
[ceph: root@host01 /]# ceph osd set nobackfill
[ceph: root@host01 /]# ceph osd set nodown
[ceph: root@host01 /]# ceph osd set pause
Stop the MDS service.
Fetch the MDS service name:
Example
[ceph: root@host01 /]# ceph orch ls --service-type mds
Stop the MDS service using the fetched name in the previous step:
Syntax
ceph orch stop SERVICE-NAME
Stop the Ceph Object Gateway services. Repeat for each deployed service.
Fetch the Ceph Object Gateway service names:
Example
[ceph: root@host01 /]# ceph orch ls --service-type rgw
Stop the Ceph Object Gateway service using the fetched name:
Syntax
ceph orch stop SERVICE-NAME
Stop the Alertmanager service:
Example
[ceph: root@host01 /]# ceph orch stop alertmanager
Stop the node-exporter service which is a part of the monitoring stack:
Example
[ceph: root@host01 /]# ceph orch stop node-exporter
Stop the Prometheus service:
Example
[ceph: root@host01 /]# ceph orch stop prometheus
Stop the Grafana dashboard service:
Example
[ceph: root@host01 /]# ceph orch stop grafana
Stop the crash service:
Example
[ceph: root@host01 /]# ceph orch stop crash
Shut down the OSD nodes from the cephadm node, one by one. Repeat this step for all the OSDs in the cluster.
Fetch the OSD ID:
Example
[ceph: root@host01 /]# ceph orch ps --daemon-type=osd
Shut down the OSD node using the OSD ID you fetched:
Example
[ceph: root@host01 /]# ceph orch daemon stop osd.1
Scheduled to stop osd.1 on host 'host02'
Stop the monitors one by one.
Identify the hosts hosting the monitors:
Example
[ceph: root@host01 /]# ceph orch ps --daemon-type mon
On each host, stop the monitor.
Identify the
systemctlunit name:Example
[ceph: root@host01 /]# systemctl list-units ceph-* | grep mon
Stop the service:
Syntax
systemct stop SERVICE-NAME
- Shut down all the hosts.
Rebooting the Red Hat Ceph Storage cluster
- If network equipment was involved, ensure it is powered ON and stable prior to powering ON any Ceph hosts or nodes.
- Power ON all the Ceph hosts.
Log into the administration node from the Cephadm shell:
Example
[root@host01 ~]# cephadm shell
Verify all the services are in running state:
Example
[ceph: root@host01 /]# ceph orch ls
Ensure the cluster health is `Health_OK`status:
Example
[ceph: root@host01 /]# ceph -s
Unset the
noout,norecover,norebalance,nobackfill,nodownandpauseflags. Run the following on a node with the client keyrings, for example, the Ceph Monitor or OpenStack controller node:Example
[ceph: root@host01 /]# ceph osd unset noout
[ceph: root@host01 /]# ceph osd unset norecover
[ceph: root@host01 /]# ceph osd unset norebalance
[ceph: root@host01 /]# ceph osd unset nobackfill
[ceph: root@host01 /]# ceph osd unset nodown
[ceph: root@host01 /]# ceph osd unset pause
If you use the Ceph File System (
CephFS), bring theCephFScluster back up by setting thejoinableflag totrue:Syntax
ceph fs set FS_NAME joinable trueExample
[ceph: root@host01 /]# ceph fs set cephfs joinable true
Verification
-
Verify the cluster is in healthy state (
Health_OKand all PGsactive+clean). Runceph statuson a node with the client keyrings, for example, the Ceph Monitor or OpenStack controller nodes, to ensure the cluster is healthy.
Example
[ceph: root@host01 /]# ceph -s
Additional Resources
- For more information on installing Ceph see the Red Hat Ceph Storage Installation Guide
Chapter 3. Monitoring a Ceph storage cluster
As a storage administrator, you can monitor the overall health of the Red Hat Ceph Storage cluster, along with monitoring the health of the individual components of Ceph.
Once you have a running Red Hat Ceph Storage cluster, you might begin monitoring the storage cluster to ensure that the Ceph Monitor and Ceph OSD daemons are running, at a high-level. Ceph storage cluster clients connect to a Ceph Monitor and receive the latest version of the storage cluster map before they can read and write data to the Ceph pools within the storage cluster. So the monitor cluster must have agreement on the state of the cluster before Ceph clients can read and write data.
Ceph OSDs must peer the placement groups on the primary OSD with the copies of the placement groups on secondary OSDs. If faults arise, peering will reflect something other than the active + clean state.
3.1. High-level monitoring of a Ceph storage cluster
As a storage administrator, you can monitor the health of the Ceph daemons to ensure that they are up and running. High level monitoring also involves checking the storage cluster capacity to ensure that the storage cluster does not exceed its full ratio. The Red Hat Ceph Storage Dashboard is the most common way to conduct high-level monitoring. However, you can also use the command-line interface, the Ceph admin socket or the Ceph API to monitor the storage cluster.
3.1.1. Checking the storage cluster health
After you start the Ceph storage cluster, and before you start reading or writing data, check the storage cluster’s health first.
Prerequisites
- A running Red Hat Ceph Storage cluster.
- Root-level access to the node.
Procedure
Log into the Cephadm shell:
Example
root@host01 ~]# cephadm shell
You can check on the health of the Ceph storage cluster with the following command:
Example
[ceph: root@host01 /]# ceph health
HEALTH_OK
You can check the status of the Ceph storage cluster by running
ceph statuscommand:Example
[ceph: root@host01 /]# ceph status
The output provides the following information:
- Cluster ID
- Cluster health status
- The monitor map epoch and the status of the monitor quorum.
- The OSD map epoch and the status of OSDs.
- The status of Ceph Managers.
- The status of Object Gateways.
- The placement group map version.
- The number of placement groups and pools.
- The notional amount of data stored and the number of objects stored.
- The total amount of data stored.
- The IO client operations.
An update on the upgrade process if the cluster is upgrading.
Upon starting the Ceph cluster, you will likely encounter a health warning such as
HEALTH_WARN XXX num placement groups stale. Wait a few moments and check it again. When the storage cluster is ready,ceph healthshould return a message such asHEALTH_OK. At that point, it is okay to begin using the cluster.
3.1.2. Watching storage cluster events
You can watch events that are happening with the Ceph storage cluster using the command-line interface.
Prerequisites
- A running Red Hat Ceph Storage cluster.
- Root-level access to the node.
Procedure
Log into the Cephadm shell:
Example
root@host01 ~]# cephadm shell
To watch the cluster’s ongoing events, run the following command:
Example
[ceph: root@host01 /]# ceph -w
  cluster:
    id:     8c9b0072-67ca-11eb-af06-001a4a0002a0
    health: HEALTH_OK

  services:
    mon: 2 daemons, quorum Ceph5-2,Ceph5-adm (age 3d)
    mgr: Ceph5-1.nqikfh(active, since 3w), standbys: Ceph5-adm.meckej
    osd: 5 osds: 5 up (since 2d), 5 in (since 8w)
    rgw: 2 daemons active (test_realm.test_zone.Ceph5-2.bfdwcn, test_realm.test_zone.Ceph5-adm.acndrh)

  data:
    pools:   11 pools, 273 pgs
    objects: 459 objects, 32 KiB
    usage:   2.6 GiB used, 72 GiB / 75 GiB avail
    pgs:     273 active+clean

  io:
    client:   170 B/s rd, 730 KiB/s wr, 0 op/s rd, 729 op/s wr

2021-06-02 15:45:21.655871 osd.0 [INF] 17.71 deep-scrub ok
2021-06-02 15:45:47.880608 osd.1 [INF] 1.0 scrub ok
2021-06-02 15:45:48.865375 osd.1 [INF] 1.3 scrub ok
2021-06-02 15:45:50.866479 osd.1 [INF] 1.4 scrub ok
2021-06-02 15:45:01.345821 mon.0 [INF] pgmap v41339: 952 pgs: 952 active+clean; 17130 MB data, 115 GB used, 167 GB / 297 GB avail
2021-06-02 15:45:05.718640 mon.0 [INF] pgmap v41340: 952 pgs: 1 active+clean+scrubbing+deep, 951 active+clean; 17130 MB data, 115 GB used, 167 GB / 297 GB avail
2021-06-02 15:45:53.997726 osd.1 [INF] 1.5 scrub ok
2021-06-02 15:45:06.734270 mon.0 [INF] pgmap v41341: 952 pgs: 1 active+clean+scrubbing+deep, 951 active+clean; 17130 MB data, 115 GB used, 167 GB / 297 GB avail
2021-06-02 15:45:15.722456 mon.0 [INF] pgmap v41342: 952 pgs: 952 active+clean; 17130 MB data, 115 GB used, 167 GB / 297 GB avail
2021-06-02 15:46:06.836430 osd.0 [INF] 17.75 deep-scrub ok
2021-06-02 15:45:55.720929 mon.0 [INF] pgmap v41343: 952 pgs: 1 active+clean+scrubbing+deep, 951 active+clean; 17130 MB data, 115 GB used, 167 GB / 297 GB avail
3.1.3. How Ceph calculates data usage
The used value reflects the actual amount of raw storage used. The xxx GB / xxx GB value means the amount available, the lesser of the two numbers, of the overall storage capacity of the cluster. The notional number reflects the size of the stored data before it is replicated, cloned or snapshotted. Therefore, the amount of data actually stored typically exceeds the notional amount stored, because Ceph creates replicas of the data and may also use storage capacity for cloning and snapshotting.
3.1.4. Understanding the storage clusters usage stats
To check a cluster’s data usage and data distribution among pools, use the df option. It is similar to the Linux df command.
The SIZE/AVAIL/RAW USED in the ceph df and ceph status command output are different if some OSDs are marked OUT of the cluster compared to when all OSDs are IN. The SIZE/AVAIL/RAW USED is calculated from sum of SIZE (osd disk size), RAW USE (total used space on disk), and AVAIL of all OSDs which are in IN state. You can see the total of SIZE/AVAIL/RAW USED for all OSDs in ceph osd df tree command output.
Example
[ceph: root@host01 /]#ceph df
--- RAW STORAGE ---
CLASS   SIZE    AVAIL     USED  RAW USED  %RAW USED
hdd    5 TiB  2.9 TiB  2.1 TiB   2.1 TiB      42.98
TOTAL  5 TiB  2.9 TiB  2.1 TiB   2.1 TiB      42.98

--- POOLS ---
POOL                        ID  PGS   STORED  OBJECTS     USED  %USED  MAX AVAIL
.mgr                         1    1  5.3 MiB        3   16 MiB      0    629 GiB
.rgw.root                    2   32  1.3 KiB        4   48 KiB      0    629 GiB
default.rgw.log              3   32  3.6 KiB      209  408 KiB      0    629 GiB
default.rgw.control          4   32      0 B        8      0 B      0    629 GiB
default.rgw.meta             5   32  1.7 KiB       10   96 KiB      0    629 GiB
default.rgw.buckets.index    7   32  5.5 MiB       22   17 MiB      0    629 GiB
default.rgw.buckets.data     8   32  807 KiB        3  2.4 MiB      0    629 GiB
default.rgw.buckets.non-ec   9   32  1.0 MiB        1  3.1 MiB      0    629 GiB
source-ecpool-86            11   32  1.2 TiB  391.13k  2.1 TiB  53.49    1.1 TiB
The ceph df detail command gives more details about other pool statistics such as quota objects, quota bytes, used compression, and under compression.
The RAW STORAGE section of the output provides an overview of the amount of storage the storage cluster manages for data.
- CLASS: The class of OSD device.
SIZE: The amount of storage capacity managed by the storage cluster.
In the above example, if the
SIZEis 90 GiB, it is the total size without the replication factor, which is three by default. The total available capacity with the replication factor is 90 GiB/3 = 30 GiB. Based on the full ratio, which is 0.85% by default, the maximum available space is 30 GiB * 0.85 = 25.5 GiBAVAIL: The amount of free space available in the storage cluster.
In the above example, if the
SIZEis 90 GiB and theUSEDspace is 6 GiB, then theAVAILspace is 84 GiB. The total available space with the replication factor, which is three by default, is 84 GiB/3 = 28 GiBUSED: The amount of raw storage consumed by user data.
In the above example, 100 MiB is the total space available after considering the replication factor. The actual available size is 33 MiB. RAW USED: The amount of raw storage consumed by user data, internal overhead, or reserved capacity.
-
% RAW USED: The percentage of RAW USED. Use this number in conjunction with the
full ratioandnear full ratioto ensure that you are not reaching the storage cluster’s capacity.
The POOLS section of the output provides a list of pools and the notional usage of each pool. The output from this section DOES NOT reflect replicas, clones or snapshots. For example, if you store an object with 1 MB of data, the notional usage will be 1 MB, but the actual usage may be 3 MB or more depending on the number of replicas for example, size = 3, clones and snapshots.
- POOL: The name of the pool.
- ID: The pool ID.
- STORED: The actual amount of data stored by the user in the pool. This value changes based on the raw usage data based on (k+M)/K values, number of object copies, and the number of objects degraded at the time of pool stats calculation.
-
OBJECTS: The notional number of objects stored per pool. It is
STOREDsize * replication factor. - USED: The notional amount of data stored in kilobytes, unless the number appends M for megabytes or G for gigabytes.
- %USED: The notional percentage of storage used per pool.
MAX AVAIL: An estimate of the notional amount of data that can be written to this pool. It is the amount of data that can be used before the first OSD becomes full. It considers the projected distribution of data across disks from the CRUSH map and uses the first OSD to fill up as the target.
In the above example,
MAX AVAILis 153.85 MB without considering the replication factor, which is three by default.See the Red Hat Knowledgebase article titled ceph df MAX AVAIL is incorrect for simple replicated pool to calculate the value of
MAX AVAIL.- QUOTA OBJECTS: The number of quota objects.
- QUOTA BYTES: The number of bytes in the quota objects.
- USED COMPR: The amount of space allocated for compressed data including his includes compressed data, allocation, replication and erasure coding overhead.
- UNDER COMPR: The amount of data passed through compression and beneficial enough to be stored in a compressed form.
The numbers in the POOLS section are notional. They are not inclusive of the number of replicas, snapshots or clones. As a result, the sum of the USED and %USED amounts will not add up to the RAW USED and %RAW USED amounts in the GLOBAL section of the output.
The MAX AVAIL value is a complicated function of the replication or erasure code used, the CRUSH rule that maps storage to devices, the utilization of those devices, and the configured mon_osd_full_ratio.
Additional Resources
- See How Ceph calculates data usage for details.
- See Understanding the OSD usage stats for details.
3.1.5. Understanding the OSD usage stats
Use the ceph osd df command to view OSD utilization stats.
Example
[ceph: root@host01 /]# ceph osd df
ID CLASS WEIGHT  REWEIGHT SIZE    USE     DATA    OMAP    META    AVAIL   %USE VAR  PGS
 3   hdd 0.90959  1.00000  931GiB 70.1GiB 69.1GiB      0B    1GiB  861GiB 7.53 2.93  66
 4   hdd 0.90959  1.00000  931GiB 1.30GiB  308MiB      0B    1GiB  930GiB 0.14 0.05  59
 0   hdd 0.90959  1.00000  931GiB 18.1GiB 17.1GiB      0B    1GiB  913GiB 1.94 0.76  57
MIN/MAX VAR: 0.02/2.98  STDDEV: 2.91
- ID: The name of the OSD.
- CLASS: The type of devices the OSD uses.
- WEIGHT: The weight of the OSD in the CRUSH map.
- REWEIGHT: The default reweight value.
- SIZE: The overall storage capacity of the OSD.
- USE: The OSD capacity.
- DATA: The amount of OSD capacity that is used by user data.
-
OMAP: An estimate value of the
bluefsstorage that is being used to store object map (omap) data (key value pairs stored inrocksdb). -
META: The
bluefsspace allocated, or the value set in thebluestore_bluefs_minparameter, whichever is larger, for internal metadata which is calculated as the total space allocated inbluefsminus the estimatedomapdata size. - AVAIL: The amount of free space available on the OSD.
- %USE: The notional percentage of storage used by the OSD
- VAR: The variation above or below average utilization.
- PGS: The number of placement groups in the OSD.
- MIN/MAX VAR: The minimum and maximum variation across all OSDs.
Additional Resources
- See How Ceph calculates data usage for details.
- See Understanding the OSD usage stats for details.
- See CRUSH Weights in Red Hat Ceph Storage Storage Strategies Guide for details.
3.1.6. Checking the storage cluster status
You can check the status of the Red Hat Ceph Storage cluster from the command-line interface. The status sub command or the -s argument will display the current status of the storage cluster.
Prerequisites
- A running Red Hat Ceph Storage cluster.
- Root-level access to the node.
Procedure
Log into the Cephadm shell:
Example
[root@host01 ~]# cephadm shell
To check a storage cluster’s status, execute the following:
Example
[ceph: root@host01 /]# ceph status
Or
Example
[ceph: root@host01 /]# ceph -s
In interactive mode, type
cephand press Enter:Example
[ceph: root@host01 /]# ceph
ceph> status
  cluster:
    id:     499829b4-832f-11eb-8d6d-001a4a000635
    health: HEALTH_WARN
            1 stray daemon(s) not managed by cephadm
            1/3 mons down, quorum host03,host02
            too many PGs per OSD (261 > max 250)

  services:
    mon:     3 daemons, quorum host03,host02 (age 3d), out of quorum: host01
    mgr:     host01.hdhzwn(active, since 9d), standbys: host05.eobuuv, host06.wquwpj
    osd:     12 osds: 11 up (since 2w), 11 in (since 5w)
    rgw:     2 daemons active (test_realm.test_zone.host04.hgbvnq, test_realm.test_zone.host05.yqqilm)
    rgw-nfs: 1 daemon active (nfs.foo.host06-rgw)

  data:
    pools:   8 pools, 960 pgs
    objects: 414 objects, 1.0 MiB
    usage:   5.7 GiB used, 214 GiB / 220 GiB avail
    pgs:     960 active+clean

  io:
    client:   41 KiB/s rd, 0 B/s wr, 41 op/s rd, 27 op/s wr

ceph> health
HEALTH_WARN 1 stray daemon(s) not managed by cephadm; 1/3 mons down, quorum host03,host02; too many PGs per OSD (261 > max 250)

ceph> mon stat
e3: 3 mons at {host01=[v2:10.74.255.0:3300/0,v1:10.74.255.0:6789/0],host02=[v2:10.74.249.253:3300/0,v1:10.74.249.253:6789/0],host03=[v2:10.74.251.164:3300/0,v1:10.74.251.164:6789/0]}, election epoch 6688, leader 1 host03, quorum 1,2 host03,host02
3.1.7. Checking the Ceph Monitor status
If the storage cluster has multiple Ceph Monitors, which is a requirement for a production Red Hat Ceph Storage cluster, then you can check the Ceph Monitor quorum status after starting the storage cluster, and before doing any reading or writing of data.
A quorum must be present when multiple Ceph Monitors are running.
Check the Ceph Monitor status periodically to ensure that they are running. If there is a problem with the Ceph Monitor, that prevents an agreement on the state of the storage cluster, the fault can prevent Ceph clients from reading and writing data.
Prerequisites
- A running Red Hat Ceph Storage cluster.
- Root-level access to the node.
Procedure
Log into the Cephadm shell:
Example
[root@host01 ~]# cephadm shell
To display the Ceph Monitor map, execute the following:
Example
[ceph: root@host01 /]# ceph mon stat
or
Example
[ceph: root@host01 /]# ceph mon dump
To check the quorum status for the storage cluster, execute the following:
[ceph: root@host01 /]# ceph quorum_status -f json-pretty
Ceph returns the quorum status.
Example
{
    "election_epoch": 6686,
    "quorum": [
        0,
        1,
        2
    ],
    "quorum_names": [
        "host01",
        "host03",
        "host02"
    ],
    "quorum_leader_name": "host01",
    "quorum_age": 424884,
    "features": {
        "quorum_con": "4540138297136906239",
        "quorum_mon": [
            "kraken",
            "luminous",
            "mimic",
            "osdmap-prune",
            "nautilus",
            "octopus",
            "pacific",
            "elector-pinging"
        ]
    },
    "monmap": {
        "epoch": 3,
        "fsid": "499829b4-832f-11eb-8d6d-001a4a000635",
        "modified": "2021-03-15T04:51:38.621737Z",
        "created": "2021-03-12T12:35:16.911339Z",
        "min_mon_release": 16,
        "min_mon_release_name": "pacific",
        "election_strategy": 1,
        "disallowed_leaders: ": "",
        "stretch_mode": false,
        "features": {
            "persistent": [
                "kraken",
                "luminous",
                "mimic",
                "osdmap-prune",
                "nautilus",
                "octopus",
                "pacific",
                "elector-pinging"
            ],
            "optional": []
        },
        "mons": [
            {
                "rank": 0,
                "name": "host01",
                "public_addrs": {
                    "addrvec": [
                        {
                            "type": "v2",
                            "addr": "10.74.255.0:3300",
                            "nonce": 0
                        },
                        {
                            "type": "v1",
                            "addr": "10.74.255.0:6789",
                            "nonce": 0
                        }
                    ]
                },
                "addr": "10.74.255.0:6789/0",
                "public_addr": "10.74.255.0:6789/0",
                "priority": 0,
                "weight": 0,
                "crush_location": "{}"
            },
            {
                "rank": 1,
                "name": "host03",
                "public_addrs": {
                    "addrvec": [
                        {
                            "type": "v2",
                            "addr": "10.74.251.164:3300",
                            "nonce": 0
                        },
                        {
                            "type": "v1",
                            "addr": "10.74.251.164:6789",
                            "nonce": 0
                        }
                    ]
                },
                "addr": "10.74.251.164:6789/0",
                "public_addr": "10.74.251.164:6789/0",
                "priority": 0,
                "weight": 0,
                "crush_location": "{}"
            },
            {
                "rank": 2,
                "name": "host02",
                "public_addrs": {
                    "addrvec": [
                        {
                            "type": "v2",
                            "addr": "10.74.249.253:3300",
                            "nonce": 0
                        },
                        {
                            "type": "v1",
                            "addr": "10.74.249.253:6789",
                            "nonce": 0
                        }
                    ]
                },
                "addr": "10.74.249.253:6789/0",
                "public_addr": "10.74.249.253:6789/0",
                "priority": 0,
                "weight": 0,
                "crush_location": "{}"
            }
        ]
    }
}
3.1.8. Using the Ceph administration socket
Use the administration socket to interact with a given daemon directly by using a UNIX socket file. For example, the socket enables you to:
- List the Ceph configuration at runtime
-
Set configuration values at runtime directly without relying on Monitors. This is useful when Monitors are
down. - Dump historic operations
- Dump the operation priority queue state
- Dump operations without rebooting
- Dump performance counters
In addition, using the socket is helpful when troubleshooting problems related to Ceph Monitors or OSDs.
Regardless, if the daemon is not running, a following error is returned when attempting to use the administration socket:
Error 111: Connection Refused
The administration socket is only available while a daemon is running. When you shut down the daemon properly, the administration socket is removed. However, if the daemon terminates unexpectedly, the administration socket might persist.
Prerequisites
- A running Red Hat Ceph Storage cluster.
- Root-level access to the node.
Procedure
Log into the Cephadm shell:
Example
[root@host01 ~]# cephadm shell
To use the socket:
Syntax
ceph daemon MONITOR_ID COMMAND
Replace:
-
MONITOR_IDof the daemon COMMANDwith the command to run. Usehelpto list the available commands for a given daemon.To view the status of a Ceph Monitor:
Example
[ceph: root@host01 /]# ceph daemon mon.host01 help
{
    "add_bootstrap_peer_hint": "add peer address as potential bootstrap peer for cluster bringup",
    "add_bootstrap_peer_hintv": "add peer address vector as potential bootstrap peer for cluster bringup",
    "compact": "cause compaction of monitor's leveldb/rocksdb storage",
    "config diff": "dump diff of current config and default config",
    "config diff get": "dump diff get <field>: dump diff of current and default config setting <field>",
    "config get": "config get <field>: get the config value",
    "config help": "get config setting schema and descriptions",
    "config set": "config set <field> <val> [<val> ...]: set a config variable",
    "config show": "dump current config settings",
    "config unset": "config unset <field>: unset a config variable",
    "connection scores dump": "show the scores used in connectivity-based elections",
    "connection scores reset": "reset the scores used in connectivity-based elections",
    "counter dump": "dump all labeled and non-labeled counters and their values",
    "counter schema": "dump all labeled and non-labeled counters schemas",
    "dump_historic_ops": "show recent ops",
    "dump_historic_slow_ops": "show recent slow ops",
    "dump_mempools": "get mempool stats",
    "get_command_descriptions": "list available commands",
    "git_version": "get git sha1",
    "heap": "show heap usage info (available only if compiled with tcmalloc)",
    "help": "list available commands",
    "injectargs": "inject configuration arguments into running daemon",
    "log dump": "dump recent log entries to log file",
    "log flush": "flush log entries to log file",
    "log reopen": "reopen log file",
    "mon_status": "report status of monitors",
    "ops": "show the ops currently in flight",
    "perf dump": "dump non-labeled counters and their values",
    "perf histogram dump": "dump perf histogram values",
    "perf histogram schema": "dump perf histogram schema",
    "perf reset": "perf reset <name>: perf reset all or one perfcounter name",
    "perf schema": "dump non-labeled counters schemas",
    "quorum enter": "force monitor back into quorum",
    "quorum exit": "force monitor out of the quorum",
    "sessions": "list existing sessions",
    "smart": "Query health metrics for underlying device",
    "sync_force": "force sync of and clear monitor store",
    "version": "get ceph version"
}
Example
[ceph: root@host01 /]# ceph daemon mon.host01 mon_status

{
    "name": "host01",
    "rank": 0,
    "state": "leader",
    "election_epoch": 120,
    "quorum": [
        0,
        1,
        2
    ],
    "quorum_age": 206358,
    "features": {
        "required_con": "2449958747317026820",
        "required_mon": [
            "kraken",
            "luminous",
            "mimic",
            "osdmap-prune",
            "nautilus",
            "octopus",
            "pacific",
            "elector-pinging"
        ],
        "quorum_con": "4540138297136906239",
        "quorum_mon": [
            "kraken",
            "luminous",
            "mimic",
            "osdmap-prune",
            "nautilus",
            "octopus",
            "pacific",
            "elector-pinging"
        ]
    },
    "outside_quorum": [],
    "extra_probe_peers": [],
    "sync_provider": [],
    "monmap": {
        "epoch": 3,
        "fsid": "81a4597a-b711-11eb-8cb8-001a4a000740",
        "modified": "2021-05-18T05:50:17.782128Z",
        "created": "2021-05-17T13:13:13.383313Z",
        "min_mon_release": 16,
        "min_mon_release_name": "pacific",
        "election_strategy": 1,
        "disallowed_leaders: ": "",
        "stretch_mode": false,
        "features": {
            "persistent": [
                "kraken",
                "luminous",
                "mimic",
                "osdmap-prune",
                "nautilus",
                "octopus",
                "pacific",
                "elector-pinging"
            ],
            "optional": []
        },
        "mons": [
            {
                "rank": 0,
                "name": "host01",
                "public_addrs": {
                    "addrvec": [
                        {
                            "type": "v2",
                            "addr": "10.74.249.41:3300",
                            "nonce": 0
                        },
                        {
                            "type": "v1",
                            "addr": "10.74.249.41:6789",
                            "nonce": 0
                        }
                    ]
                },
                "addr": "10.74.249.41:6789/0",
                "public_addr": "10.74.249.41:6789/0",
                "priority": 0,
                "weight": 0,
                "crush_location": "{}"
            },
            {
                "rank": 1,
                "name": "host02",
                "public_addrs": {
                    "addrvec": [
                        {
                            "type": "v2",
                            "addr": "10.74.249.55:3300",
                            "nonce": 0
                        },
                        {
                            "type": "v1",
                            "addr": "10.74.249.55:6789",
                            "nonce": 0
                        }
                    ]
                },
                "addr": "10.74.249.55:6789/0",
                "public_addr": "10.74.249.55:6789/0",
                "priority": 0,
                "weight": 0,
                "crush_location": "{}"
            },
            {
                "rank": 2,
                "name": "host03",
                "public_addrs": {
                    "addrvec": [
                        {
                            "type": "v2",
                            "addr": "10.74.249.49:3300",
                            "nonce": 0
                        },
                        {
                            "type": "v1",
                            "addr": "10.74.249.49:6789",
                            "nonce": 0
                        }
                    ]
                },
                "addr": "10.74.249.49:6789/0",
                "public_addr": "10.74.249.49:6789/0",
                "priority": 0,
                "weight": 0,
                "crush_location": "{}"
            }
        ]
    },
    "feature_map": {
        "mon": [
            {
                "features": "0x3f01cfb9fffdffff",
                "release": "luminous",
                "num": 1
            }
        ],
        "osd": [
            {
                "features": "0x3f01cfb9fffdffff",
                "release": "luminous",
                "num": 3
            }
        ]
    },
    "stretch_mode": false
}
-
Alternatively, specify the Ceph daemon by using its socket file:
Syntax
ceph daemon /var/run/ceph/SOCKET_FILE COMMAND
To view the status of a Ceph OSD named
osd.0on the specific host:Example
[ceph: root@host01 /]# ceph daemon /var/run/ceph/ceph-osd.0.asok status { "cluster_fsid": "9029b252-1668-11ee-9399-001a4a000429", "osd_fsid": "1de9b064-b7a5-4c54-9395-02ccda637d21", "whoami": 0, "state": "active", "oldest_map": 1, "newest_map": 58, "num_pgs": 33 }NoteYou can use
helpinstead ofstatusfor the various options that are available for the specific daemon.To list all socket files for the Ceph processes:
Example
[ceph: root@host01 /]# ls /var/run/ceph
Additional Resources
- See the Red Hat Ceph Storage Troubleshooting Guide for more information.
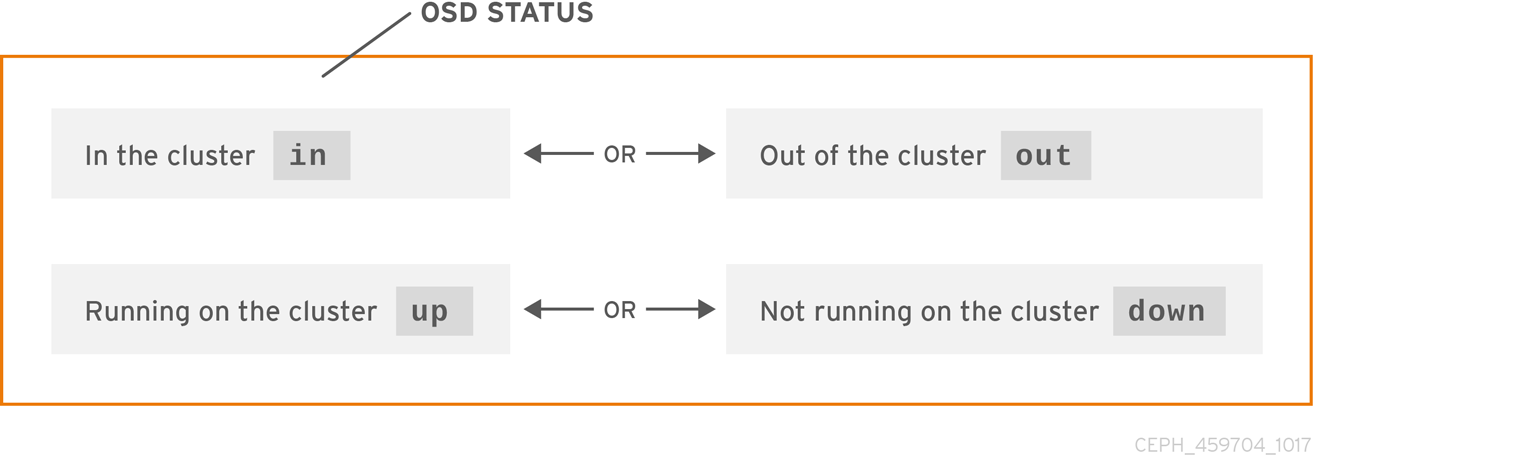
3.1.9. Understanding the Ceph OSD status
A Ceph OSD’s status is either in the storage cluster, or out of the storage cluster. It is either up and running, or it is down and not running. If a Ceph OSD is up, it can be either in the storage cluster, where data can be read and written, or it is out of the storage cluster. If it was in the storage cluster and recently moved out of the storage cluster, Ceph starts migrating placement groups to other Ceph OSDs. If a Ceph OSD is out of the storage cluster, CRUSH will not assign placement groups to the Ceph OSD. If a Ceph OSD is down, it should also be out.
If a Ceph OSD is down and in, there is a problem, and the storage cluster will not be in a healthy state.
If you execute a command such as ceph health, ceph -s or ceph -w, you might notice that the storage cluster does not always echo back HEALTH OK. Do not panic. With respect to Ceph OSDs, you can expect that the storage cluster will NOT echo HEALTH OK in a few expected circumstances:
- You have not started the storage cluster yet, and it is not responding.
- You have just started or restarted the storage cluster, and it is not ready yet, because the placement groups are getting created and the Ceph OSDs are in the process of peering.
- You just added or removed a Ceph OSD.
- You just modified the storage cluster map.
An important aspect of monitoring Ceph OSDs is to ensure that when the storage cluster is up and running that all Ceph OSDs that are in the storage cluster are up and running, too.
To see if all OSDs are running, execute:
Example
[ceph: root@host01 /]# ceph osd stat
or
Example
[ceph: root@host01 /]# ceph osd dump
The result should tell you the map epoch, eNNNN, the total number of OSDs, x, how many, y, are up, and how many, z, are in:
eNNNN: x osds: y up, z in
If the number of Ceph OSDs that are in the storage cluster are more than the number of Ceph OSDs that are up. Execute the following command to identify the ceph-osd daemons that are not running:
Example
[ceph: root@host01 /]# ceph osd tree

# id    weight  type name   up/down reweight
-1  3   pool default
-3  3       rack mainrack
-2  3           host osd-host
0   1               osd.0   up  1
1   1               osd.1   up  1
2   1               osd.2   up  1
The ability to search through a well-designed CRUSH hierarchy can help you troubleshoot the storage cluster by identifying the physical locations faster.
If a Ceph OSD is down, connect to the node and start it. You can use Red Hat Storage Console to restart the Ceph OSD daemon, or you can use the command line.
Syntax
systemctl start CEPH_OSD_SERVICE_ID
Example
[root@host01 ~]# systemctl start ceph-499829b4-832f-11eb-8d6d-001a4a000635@osd.6.service
Additional Resources
- See the Red Hat Ceph Storage Dashboard Guide for more details.
3.2. Low-level monitoring of a Ceph storage cluster
As a storage administrator, you can monitor the health of a Red Hat Ceph Storage cluster from a low-level perspective. Low-level monitoring typically involves ensuring that Ceph OSDs are peering properly. When peering faults occur, placement groups operate in a degraded state. This degraded state can be the result of many different things, such as hardware failure, a hung or crashed Ceph daemon, network latency, or a complete site outage.
3.2.1. Monitoring Placement Group Sets
When CRUSH assigns placement groups to Ceph OSDs, it looks at the number of replicas for the pool and assigns the placement group to Ceph OSDs such that each replica of the placement group gets assigned to a different Ceph OSD. For example, if the pool requires three replicas of a placement group, CRUSH may assign them to osd.1, osd.2 and osd.3 respectively. CRUSH actually seeks a pseudo-random placement that will take into account failure domains you set in the CRUSH map, so you will rarely see placement groups assigned to nearest neighbor Ceph OSDs in a large cluster. We refer to the set of Ceph OSDs that should contain the replicas of a particular placement group as the Acting Set. In some cases, an OSD in the Acting Set is down or otherwise not able to service requests for objects in the placement group. When these situations arise, do not panic. Common examples include:
- You added or removed an OSD. Then, CRUSH reassigned the placement group to other Ceph OSDs, thereby changing the composition of the acting set and spawning the migration of data with a "backfill" process.
-
A Ceph OSD was
down, was restarted and is nowrecovering. -
A Ceph OSD in the acting set is
downor unable to service requests, and another Ceph OSD has temporarily assumed its duties.
Ceph processes a client request using the Up Set, which is the set of Ceph OSDs that actually handle the requests. In most cases, the up set and the Acting Set are virtually identical. When they are not, it can indicate that Ceph is migrating data, an Ceph OSD is recovering, or that there is a problem, that is, Ceph usually echoes a HEALTH WARN state with a "stuck stale" message in such scenarios.
Prerequisites
- A running Red Hat Ceph Storage cluster.
- Root-level access to the node.
Procedure
Log into the Cephadm shell:
Example
[root@host01 ~]# cephadm shell
To retrieve a list of placement groups:
Example
[ceph: root@host01 /]# ceph pg dump
View which Ceph OSDs are in the Acting Set or in the Up Set for a given placement group:
Syntax
ceph pg map PG_NUMExample
[ceph: root@host01 /]# ceph pg map 128
NoteIf the Up Set and Acting Set do not match, this may be an indicator that the storage cluster rebalancing itself or of a potential problem with the storage cluster.
3.2.2. Ceph OSD peering
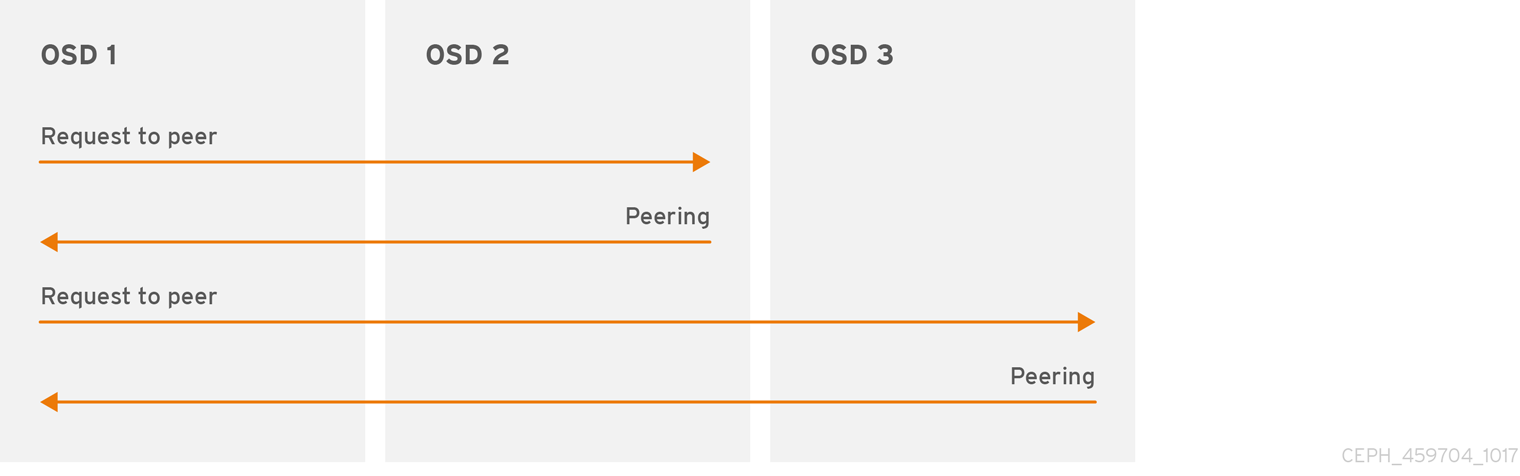
Before you can write data to a placement group, it must be in an active state, and it should be in a clean state. For Ceph to determine the current state of a placement group, the primary OSD of the placement group that is, the first OSD in the acting set, peers with the secondary and tertiary OSDs to establish agreement on the current state of the placement group. Assuming a pool with three replicas of the PG.
Figure 3.1. Peering
3.2.3. Placement Group States
If you execute a command such as ceph health, ceph -s or ceph -w, you may notice that the cluster does not always echo back HEALTH OK. After you check to see if the OSDs are running, you should also check placement group states. You should expect that the cluster will NOT echo HEALTH OK in a number of placement group peering-related circumstances:
- You have just created a pool and placement groups haven’t peered yet.
- The placement groups are recovering.
- You have just added an OSD to or removed an OSD from the cluster.
- You have just modified the CRUSH map and the placement groups are migrating.
- There is inconsistent data in different replicas of a placement group.
- Ceph is scrubbing a placement group’s replicas.
- Ceph doesn’t have enough storage capacity to complete backfilling operations.
If one of the foregoing circumstances causes Ceph to echo HEALTH WARN, don’t panic. In many cases, the cluster will recover on its own. In some cases, you may need to take action. An important aspect of monitoring placement groups is to ensure that when the cluster is up and running that all placement groups are active, and preferably in the clean state.
To see the status of all placement groups, execute:
Example
[ceph: root@host01 /]# ceph pg stat
The result should tell you the placement group map version, vNNNNNN, the total number of placement groups, x, and how many placement groups, y, are in a particular state such as active+clean:
vNNNNNN: x pgs: y active+clean; z bytes data, aa MB used, bb GB / cc GB avail
It is common for Ceph to report multiple states for placement groups.
Snapshot Trimming PG States
When snapshots exist, two additional PG states will be reported.
-
snaptrim: The PGs are currently being trimmed -
snaptrim_wait: The PGs are waiting to be trimmed
Example Output:
244 active+clean+snaptrim_wait
 32 active+clean+snaptrim
In addition to the placement group states, Ceph will also echo back the amount of data used, aa, the amount of storage capacity remaining, bb, and the total storage capacity for the placement group. These numbers can be important in a few cases:
-
You are reaching the
near full ratioorfull ratio. - Your data isn’t getting distributed across the cluster due to an error in the CRUSH configuration.
Placement Group IDs
Placement group IDs consist of the pool number, and not the pool name, followed by a period (.) and the placement group ID—a hexadecimal number. You can view pool numbers and their names from the output of ceph osd lspools. The default pool names data, metadata and rbd correspond to pool numbers 0, 1 and 2 respectively. A fully qualified placement group ID has the following form:
Syntax
POOL_NUM.PG_ID
Example output:
0.1f
To retrieve a list of placement groups:
Example
[ceph: root@host01 /]# ceph pg dump
To format the output in JSON format and save it to a file:
Syntax
ceph pg dump -o FILE_NAME --format=jsonExample
[ceph: root@host01 /]# ceph pg dump -o test --format=json
Query a particular placement group:
Syntax
ceph pg POOL_NUM.PG_ID query
Example
[ceph: root@host01 /]#  ceph pg 5.fe query
{
    "snap_trimq": "[]",
    "snap_trimq_len": 0,
    "state": "active+clean",
    "epoch": 2449,
    "up": [
        3,
        8,
        10
    ],
    "acting": [
        3,
        8,
        10
    ],
    "acting_recovery_backfill": [
        "3",
        "8",
        "10"
    ],
    "info": {
        "pgid": "5.ff",
        "last_update": "0'0",
        "last_complete": "0'0",
        "log_tail": "0'0",
        "last_user_version": 0,
        "last_backfill": "MAX",
        "purged_snaps": [],
        "history": {
            "epoch_created": 114,
            "epoch_pool_created": 82,
            "last_epoch_started": 2402,
            "last_interval_started": 2401,
            "last_epoch_clean": 2402,
            "last_interval_clean": 2401,
            "last_epoch_split": 114,
            "last_epoch_marked_full": 0,
            "same_up_since": 2401,
            "same_interval_since": 2401,
            "same_primary_since": 2086,
            "last_scrub": "0'0",
            "last_scrub_stamp": "2021-06-17T01:32:03.763988+0000",
            "last_deep_scrub": "0'0",
            "last_deep_scrub_stamp": "2021-06-17T01:32:03.763988+0000",
            "last_clean_scrub_stamp": "2021-06-17T01:32:03.763988+0000",
            "prior_readable_until_ub": 0
        },
        "stats": {
            "version": "0'0",
            "reported_seq": "2989",
            "reported_epoch": "2449",
            "state": "active+clean",
            "last_fresh": "2021-06-18T05:16:59.401080+0000",
            "last_change": "2021-06-17T01:32:03.764162+0000",
            "last_active": "2021-06-18T05:16:59.401080+0000",
....
Additional Resources
- See the chapter Object Storage Daemon (OSD) configuration options in the OSD Object storage daemon configuratopn options section in Red Hat Ceph Storage Configuration Guide for more details on the snapshot trimming settings.
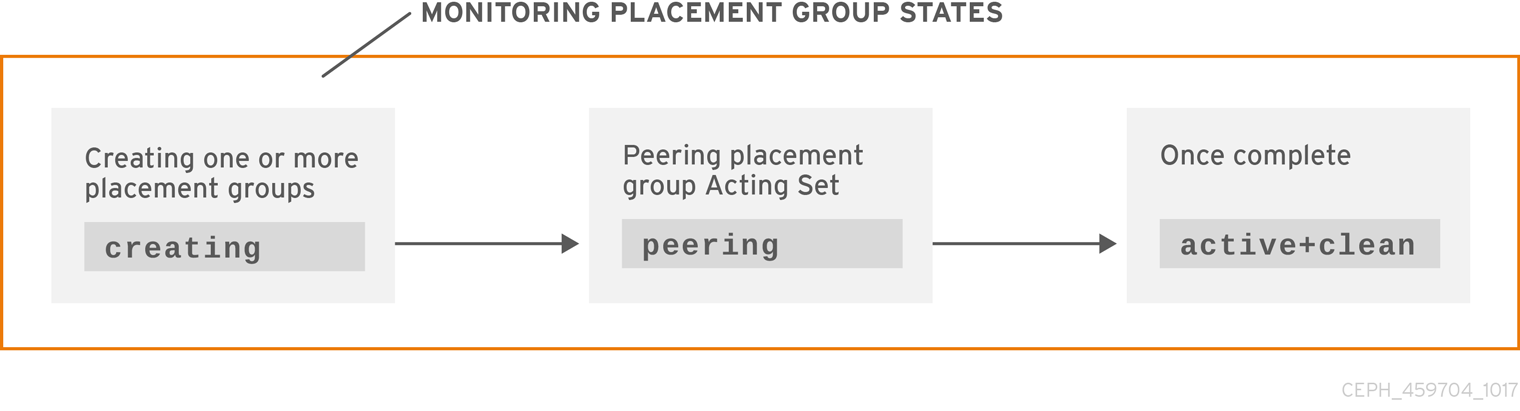
3.2.4. Placement Group creating state
When you create a pool, it will create the number of placement groups you specified. Ceph will echo creating when it is creating one or more placement groups. Once they are created, the OSDs that are part of a placement group’s Acting Set will peer. Once peering is complete, the placement group status should be active+clean, which means a Ceph client can begin writing to the placement group.
3.2.5. Placement group peering state
When Ceph is Peering a placement group, Ceph is bringing the OSDs that store the replicas of the placement group into agreement about the state of the objects and metadata in the placement group. When Ceph completes peering, this means that the OSDs that store the placement group agree about the current state of the placement group. However, completion of the peering process does NOT mean that each replica has the latest contents.
Authoritative History
Ceph will NOT acknowledge a write operation to a client, until all OSDs of the acting set persist the write operation. This practice ensures that at least one member of the acting set will have a record of every acknowledged write operation since the last successful peering operation.
With an accurate record of each acknowledged write operation, Ceph can construct and disseminate a new authoritative history of the placement group. A complete, and fully ordered set of operations that, if performed, would bring an OSD’s copy of a placement group up to date.
3.2.6. Placement group active state
Once Ceph completes the peering process, a placement group may become active. The active state means that the data in the placement group is generally available in the primary placement group and the replicas for read and write operations.
3.2.7. Placement Group clean state
When a placement group is in the clean state, the primary OSD and the replica OSDs have successfully peered and there are no stray replicas for the placement group. Ceph replicated all objects in the placement group the correct number of times.
3.2.8. Placement Group degraded state
When a client writes an object to the primary OSD, the primary OSD is responsible for writing the replicas to the replica OSDs. After the primary OSD writes the object to storage, the placement group will remain in a degraded state until the primary OSD has received an acknowledgement from the replica OSDs that Ceph created the replica objects successfully.
The reason a placement group can be active+degraded is that an OSD may be active even though it doesn’t hold all of the objects yet. If an OSD goes down, Ceph marks each placement group assigned to the OSD as degraded. The Ceph OSDs must peer again when the Ceph OSD comes back online. However, a client can still write a new object to a degraded placement group if it is active.
If an OSD is down and the degraded condition persists, Ceph may mark the down OSD as out of the cluster and remap the data from the down OSD to another OSD. The time between being marked down and being marked out is controlled by mon_osd_down_out_interval, which is set to 600 seconds by default.
A placement group can also be degraded, because Ceph cannot find one or more objects that Ceph thinks should be in the placement group. While you cannot read or write to unfound objects, you can still access all of the other objects in the degraded placement group.
For example, if there are nine OSDs in a three way replica pool. If OSD number 9 goes down, the PGs assigned to OSD 9 goes into a degraded state. If OSD 9 does not recover, it goes out of the storage cluster and the storage cluster rebalances. In that scenario, the PGs are degraded and then recover to an active state.
3.2.9. Placement Group recovering state
Ceph was designed for fault-tolerance at a scale where hardware and software problems are ongoing. When an OSD goes down, its contents may fall behind the current state of other replicas in the placement groups. When the OSD is back up, the contents of the placement groups must be updated to reflect the current state. During that time period, the OSD may reflect a recovering state.
Recovery is not always trivial, because a hardware failure might cause a cascading failure of multiple Ceph OSDs. For example, a network switch for a rack or cabinet may fail, which can cause the OSDs of a number of host machines to fall behind the current state of the storage cluster. Each one of the OSDs must recover once the fault is resolved.
Ceph provides a number of settings to balance the resource contention between new service requests and the need to recover data objects and restore the placement groups to the current state. The osd recovery delay start setting allows an OSD to restart, re-peer and even process some replay requests before starting the recovery process. The osd recovery threads setting limits the number of threads for the recovery process, by default one thread. The osd recovery thread timeout sets a thread timeout, because multiple Ceph OSDs can fail, restart and re-peer at staggered rates. The osd recovery max active setting limits the number of recovery requests a Ceph OSD works on simultaneously to prevent the Ceph OSD from failing to serve . The osd recovery max chunk setting limits the size of the recovered data chunks to prevent network congestion.
3.2.10. Back fill state
When a new Ceph OSD joins the storage cluster, CRUSH will reassign placement groups from OSDs in the cluster to the newly added Ceph OSD. Forcing the new OSD to accept the reassigned placement groups immediately can put excessive load on the new Ceph OSD. Backfilling the OSD with the placement groups allows this process to begin in the background. Once backfilling is complete, the new OSD will begin serving requests when it is ready.
During the backfill operations, you might see one of several states:
-
backfill_waitindicates that a backfill operation is pending, but isn’t underway yet -
backfillindicates that a backfill operation is underway -
backfill_too_fullindicates that a backfill operation was requested, but couldn’t be completed due to insufficient storage capacity.
When a placement group cannot be backfilled, it can be considered incomplete.
Ceph provides a number of settings to manage the load spike associated with reassigning placement groups to a Ceph OSD, especially a new Ceph OSD. By default, osd_max_backfills sets the maximum number of concurrent backfills to or from a Ceph OSD to 10. The osd backfill full ratio enables a Ceph OSD to refuse a backfill request if the OSD is approaching its full ratio, by default 85%. If an OSD refuses a backfill request, the osd backfill retry interval enables an OSD to retry the request, by default after 10 seconds. OSDs can also set osd backfill scan min and osd backfill scan max to manage scan intervals, by default 64 and 512.
For some workloads, it is beneficial to avoid regular recovery entirely and use backfill instead. Since backfilling occurs in the background, this allows I/O to proceed on the objects in the OSD. You can force a backfill rather than a recovery by setting the osd_min_pg_log_entries option to 1, and setting the osd_max_pg_log_entries option to 2. Contact your Red Hat Support account team for details on when this situation is appropriate for your workload.
3.2.11. Placement Group remapped state
When the Acting Set that services a placement group changes, the data migrates from the old acting set to the new acting set. It may take some time for a new primary OSD to service requests. So it may ask the old primary to continue to service requests until the placement group migration is complete. Once data migration completes, the mapping uses the primary OSD of the new acting set.
3.2.12. Placement Group stale state
While Ceph uses heartbeats to ensure that hosts and daemons are running, the ceph-osd daemons may also get into a stuck state where they aren’t reporting statistics in a timely manner. For example, a temporary network fault. By default, OSD daemons report their placement group, up thru, boot and failure statistics every half second, that is, 0.5, which is more frequent than the heartbeat thresholds. If the Primary OSD of a placement group’s acting set fails to report to the monitor or if other OSDs have reported the primary OSD down, the monitors will mark the placement group stale.
When you start the storage cluster, it is common to see the stale state until the peering process completes. After the storage cluster has been running for awhile, seeing placement groups in the stale state indicates that the primary OSD for those placement groups is down or not reporting placement group statistics to the monitor.
3.2.13. Placement Group misplaced state
There are some temporary backfilling scenarios where a PG gets mapped temporarily to an OSD. When that temporary situation should no longer be the case, the PGs might still reside in the temporary location and not in the proper location. In which case, they are said to be misplaced. That’s because the correct number of extra copies actually exist, but one or more copies is in the wrong place.
For example, there are 3 OSDs: 0,1,2 and all PGs map to some permutation of those three. If you add another OSD (OSD 3), some PGs will now map to OSD 3 instead of one of the others. However, until OSD 3 is backfilled, the PG will have a temporary mapping allowing it to continue to serve I/O from the old mapping. During that time, the PG is misplaced, because it has a temporary mapping, but not degraded, since there are 3 copies.
Example
pg 1.5: up=acting: [0,1,2]
ADD_OSD_3
pg 1.5: up: [0,3,1] acting: [0,1,2]
[0,1,2] is a temporary mapping, so the up set is not equal to the acting set and the PG is misplaced but not degraded since [0,1,2] is still three copies.
Example
pg 1.5: up=acting: [0,3,1]
OSD 3 is now backfilled and the temporary mapping is removed, not degraded and not misplaced.
3.2.14. Placement Group incomplete state
A PG goes into a incomplete state when there is incomplete content and peering fails, that is, when there are no complete OSDs which are current enough to perform recovery.
Lets say OSD 1, 2, and 3 are the acting OSD set and it switches to OSD 1, 4, and 3, then osd.1 will request a temporary acting set of OSD 1, 2, and 3 while backfilling 4. During this time, if OSD 1, 2, and 3 all go down, osd.4 will be the only one left which might not have fully backfilled all the data. At this time, the PG will go incomplete indicating that there are no complete OSDs which are current enough to perform recovery.
Alternately, if osd.4 is not involved and the acting set is simply OSD 1, 2, and 3 when OSD 1, 2, and 3 go down, the PG would likely go stale indicating that the mons have not heard anything on that PG since the acting set changed. The reason being there are no OSDs left to notify the new OSDs.
3.2.15. Identifying stuck Placement Groups
A placement group is not necessarily problematic just because it is not in a active+clean state. Generally, Ceph’s ability to self repair might not be working when placement groups get stuck. The stuck states include:
- Unclean: Placement groups contain objects that are not replicated the desired number of times. They should be recovering.
-
Inactive: Placement groups cannot process reads or writes because they are waiting for an OSD with the most up-to-date data to come back
up. -
Stale: Placement groups are in an unknown state, because the OSDs that host them have not reported to the monitor cluster in a while, and can be configured with the
mon osd report timeoutsetting.
Prerequisites
- A running Red Hat Ceph Storage cluster.
- Root-level access to the node.
Procedure
To identify stuck placement groups, execute the following:
Syntax
ceph pg dump_stuck {inactive|unclean|stale|undersized|degraded [inactive|unclean|stale|undersized|degraded...]} {<int>}Example
[ceph: root@host01 /]# ceph pg dump_stuck stale
OK
3.2.16. Finding an object’s location
The Ceph client retrieves the latest cluster map and the CRUSH algorithm calculates how to map the object to a placement group, and then calculates how to assign the placement group to an OSD dynamically.
Prerequisites
- A running Red Hat Ceph Storage cluster.
- Root-level access to the node.
Procedure
To find the object location, all you need is the object name and the pool name:
Syntax
ceph osd map POOL_NAME OBJECT_NAME
Example
[ceph: root@host01 /]# ceph osd map mypool myobject
Chapter 4. Stretch clusters for Ceph storage
As a storage administrator, you can configure stretch clusters by entering stretch mode with 2-site clusters.
Red Hat Ceph Storage is capable of withstanding the loss of Ceph OSDs because of its network and cluster, which are equally reliable with failures randomly distributed across the CRUSH map. If a number of OSDs is shut down, the remaining OSDs and monitors still manage to operate.
However, this might not be the best solution for some stretched cluster configurations where a significant part of the Ceph cluster can use only a single network component. The example is a single cluster located in multiple data centers, for which the user wants to sustain a loss of a full data center.
The standard configuration is with two data centers. Other configurations are in clouds or availability zones. Each site holds two copies of the data, therefore, the replication size is four. The third site should have a tiebreaker monitor, this can be a virtual machine or high-latency compared to the main sites. This monitor chooses one of the sites to restore data if the network connection fails and both data centers remain active.
The standard Ceph configuration survives many failures of the network or data centers and it never compromises data consistency. If you restore enough Ceph servers following a failure, it recovers. Ceph maintains availability if you lose a data center, but can still form a quorum of monitors and have all the data available with enough copies to satisfy pools’ min_size, or CRUSH rules that replicate again to meet the size.
There are no additional steps to power down a stretch cluster. You can see the Powering down and rebooting Red Hat Ceph Storage cluster for more information.
Stretch cluster failures
Red Hat Ceph Storage never compromises on data integrity and consistency. If there is a network failure or a loss of nodes and the services can still be restored, Ceph returns to normal functionality on its own.
However, there are situations where you lose data availability even if you have enough servers available to meet Ceph’s consistency and sizing constraints, or where you unexpectedly do not meet the constraints.
First important type of failure is caused by inconsistent networks. If there is a network split, Ceph might be unable to mark OSD as down to remove it from the acting placement group (PG) sets despite the primary OSD being unable to replicate data. When this happens, the I/O is not permitted because Ceph cannot meet its durability guarantees.
The second important category of failures is when it appears that you have data replicated across data enters, but the constraints are not sufficient to guarantee this. For example, you might have data centers A and B, and the CRUSH rule targets three copies and places a copy in each data center with a min_size of 2. The PG might go active with two copies in site A and no copies in site B, which means that if you lose site A, you lose the data and Ceph cannot operate on it. This situation is difficult to avoid with standard CRUSH rules.
4.1. Stretch mode for a storage cluster
To configure stretch clusters, you must enter the stretch mode. When stretch mode is enabled, the Ceph OSDs only take PGs as active when they peer across data centers, or whichever other CRUSH bucket type you specified, assuming both are active. Pools increase in size from the default three to four, with two copies on each site.
In stretch mode, Ceph OSDs are only allowed to connect to monitors within the same data center. New monitors are not allowed to join the cluster without specified location.
If all the OSDs and monitors from a data center become inaccessible at once, the surviving data center will enter a degraded stretch mode. This issues a warning, reduces the min_size to 1, and allows the cluster to reach an active state with the data from the remaining site.
The degraded state also triggers warnings that the pools are too small, because the pool size does not get changed. However, a special stretch mode flag prevents the OSDs from creating extra copies in the remaining data center, therefore it still keeps 2 copies.
When the missing data center becomes accesible again, the cluster enters recovery stretch mode. This changes the warning and allows peering, but still requires only the OSDs from the data center, which was up the whole time.
When all PGs are in a known state and are not degraded or incomplete, the cluster goes back to the regular stretch mode, ends the warning, and restores min_size to its starting value 2. The cluster again requires both sites to peer, not only the site that stayed up the whole time, therefore you can fail over to the other site, if necessary.
Stretch mode limitations
- It is not possible to exit from stretch mode once it is entered.
- You cannot use erasure-coded pools with clusters in stretch mode. You can neither enter the stretch mode with erasure-coded pools, nor create an erasure-coded pool when the stretch mode is active.
- Stretch mode with no more than two sites is supported.
The weights of the two sites should be the same. If they are not, you receive the following error:
Example
[ceph: root@host01 /]# ceph mon enable_stretch_mode host05 stretch_rule datacenter

Error EINVAL: the 2 datacenter instances in the cluster have differing weights 25947 and 15728 but stretch mode currently requires they be the same!
To achieve same weights on both sites, the Ceph OSDs deployed in the two sites should be of equal size, that is, storage capacity in the first site is equivalent to storage capacity in the second site.
- While it is not enforced, you should run two Ceph monitors on each site and a tiebreaker, for a total of five. This is because OSDs can only connect to monitors in their own site when in stretch mode.
- You have to create your own CRUSH rule, which provides two copies on each site, which totals to four on both sites.
-
You cannot enable stretch mode if you have existing pools with non-default size or
min_size. -
Because the cluster runs with
min_size 1when degraded, you should only use stretch mode with all-flash OSDs. This minimizes the time needed to recover once connectivity is restored, and minimizes the potential for data loss.
Additional Resources
- See Troubleshooting clusters in stretch mode for troubleshooting steps.
4.1.1. Setting the crush location for the daemons
Before you enter the stretch mode, you need to prepare the cluster by setting the crush location to the daemons in the Red Hat Ceph Storage cluster. There are two ways to do this:
- Bootstrap the cluster through a service configuration file, where the locations are added to the hosts as part of deployment.
-
Set the locations manually through
ceph osd crush add-bucketandceph osd crush movecommands after the cluster is deployed.
Method 1: Bootstrapping the cluster
Prerequisites
- Root-level access to the nodes.
Procedure
If you are bootstrapping your new storage cluster, you can create the service configuration
.yamlfile that adds the nodes to the Red Hat Ceph Storage cluster and also sets specific labels for where the services should run:Example
service_type: host
addr: host01
hostname: host01
location:
  root: default
  datacenter: DC1
labels:
  - osd
  - mon
  - mgr
---
service_type: host
addr: host02
hostname: host02
location:
  datacenter: DC1
labels:
  - osd
  - mon
---
service_type: host
addr: host03
hostname: host03
location:
  datacenter: DC1
labels:
  - osd
  - mds
  - rgw
---
service_type: host
addr: host04
hostname: host04
location:
  root: default
  datacenter: DC2
labels:
  - osd
  - mon
  - mgr
---
service_type: host
addr: host05
hostname: host05
location:
  datacenter: DC2
labels:
  - osd
  - mon
---
service_type: host
addr: host06
hostname: host06
location:
  datacenter: DC2
labels:
  - osd
  - mds
  - rgw
---
service_type: host
addr: host07
hostname: host07
labels:
  - mon
---
service_type: mon
placement:
  label: "mon"
---
service_id: cephfs
placement:
  label: "mds"
---
service_type: mgr
service_name: mgr
placement:
  label: "mgr"
---
service_type: osd
service_id: all-available-devices
service_name: osd.all-available-devices
placement:
  label: "osd"
spec:
  data_devices:
    all: true
---
service_type: rgw
service_id: objectgw
service_name: rgw.objectgw
placement:
  count: 2
  label: "rgw"
spec:
  rgw_frontend_port: 8080
Bootstrap the storage cluster with the
--apply-specoption:Syntax
cephadm bootstrap --apply-spec CONFIGURATION_FILE_NAME --mon-ip MONITOR_IP_ADDRESS --ssh-private-key PRIVATE_KEY --ssh-public-key PUBLIC_KEY --registry-url REGISTRY_URL --registry-username USER_NAME --registry-password PASSWORD
Example
[root@host01 ~]# cephadm bootstrap --apply-spec initial-config.yaml --mon-ip 10.10.128.68 --ssh-private-key /home/ceph/.ssh/id_rsa --ssh-public-key /home/ceph/.ssh/id_rsa.pub --registry-url registry.redhat.io --registry-username myuser1 --registry-password mypassword1
ImportantYou can use different command options with the
cephadm bootstrapcommand. However, always include the--apply-specoption to use the service configuration file and configure the host locations.
Additional Resources
-
See Bootstrapping a new storage cluster for more information about Ceph bootstrapping and different
cephadm bootstrapcommand options.
Method 2: Setting the locations after the deployment
Prerequisites
- Root-level access to the nodes.
Procedure
Add two buckets to which you plan to set the location of your non-tiebreaker monitors to the CRUSH map, specifying the bucket type as as
datacenter:Syntax
ceph osd crush add-bucket BUCKET_NAME BUCKET_TYPE
Example
[ceph: root@host01 /]# ceph osd crush add-bucket DC1 datacenter
[ceph: root@host01 /]# ceph osd crush add-bucket DC2 datacenter
Move the buckets under
root=default:Syntax
ceph osd crush move BUCKET_NAME root=defaultExample
[ceph: root@host01 /]# ceph osd crush move DC1 root=default
[ceph: root@host01 /]# ceph osd crush move DC2 root=default
Move the OSD hosts according to the required CRUSH placement:
Syntax
ceph osd crush move HOST datacenter=DATACENTER
Example
[ceph: root@host01 /]# ceph osd crush move host01 datacenter=DC1
4.1.2. Entering the stretch mode
The new stretch mode is designed to handle two sites. There is a lower risk of component availability outages with 2-site clusters.
Prerequisites
- Root-level access to the nodes.
- The crush location is set to the hosts.
Procedure
Set the location of each monitor, matching your CRUSH map:
Syntax
ceph mon set_location HOST datacenter=DATACENTER
Example
[ceph: root@host01 /]# ceph mon set_location host01 datacenter=DC1
[ceph: root@host01 /]# ceph mon set_location host02 datacenter=DC1
[ceph: root@host01 /]# ceph mon set_location host04 datacenter=DC2
[ceph: root@host01 /]# ceph mon set_location host05 datacenter=DC2
[ceph: root@host01 /]# ceph mon set_location host07 datacenter=DC3
Generate a CRUSH rule which places two copies on each data center:
Syntax
ceph osd getcrushmap > COMPILED_CRUSHMAP_FILENAME
crushtool -d COMPILED_CRUSHMAP_FILENAME -o DECOMPILED_CRUSHMAP_FILENAME
Example
[ceph: root@host01 /]# ceph osd getcrushmap > crush.map.bin
[ceph: root@host01 /]# crushtool -d crush.map.bin -o crush.map.txt
Edit the decompiled CRUSH map file to add a new rule:
Example
rule stretch_rule { id 1 1 type replicated min_size 1 max_size 10 step take DC1 2 step chooseleaf firstn 2 type host step emit step take DC2 3 step chooseleaf firstn 2 type host step emit }NoteThis rule makes the cluster have read-affinity towards data center
DC1. Therefore, all the reads or writes happen through Ceph OSDs placed inDC1.If this is not desirable, and reads or writes are to be distributed evenly across the zones, the crush rule is the following:
Example
rule stretch_rule {
id 1
type replicated
min_size 1
max_size 10
step take default
step choose firstn 0 type datacenter
step chooseleaf firstn 2 type host
step emit
}
In this rule, the data center is selected randomly and automatically.
See CRUSH rules for more information on
firstnandindepoptions.
Inject the CRUSH map to make the rule available to the cluster:
Syntax
crushtool -c DECOMPILED_CRUSHMAP_FILENAME -o COMPILED_CRUSHMAP_FILENAME
ceph osd setcrushmap -i COMPILED_CRUSHMAP_FILENAME
Example
[ceph: root@host01 /]# crushtool -c crush.map.txt -o crush2.map.bin
[ceph: root@host01 /]# ceph osd setcrushmap -i crush2.map.bin
If you do not run the monitors in connectivity mode, set the election strategy to
connectivity:Example
[ceph: root@host01 /]# ceph mon set election_strategy connectivity
Enter stretch mode by setting the location of the tiebreaker monitor to split across the data centers:
Syntax
ceph mon set_location HOST datacenter=DATACENTER
ceph mon enable_stretch_mode HOST stretch_rule datacenter
Example
[ceph: root@host01 /]# ceph mon set_location host07 datacenter=DC3
[ceph: root@host01 /]# ceph mon enable_stretch_mode host07 stretch_rule datacenter
In this example the monitor
mon.host07is the tiebreaker.ImportantThe location of the tiebreaker monitor should differ from the data centers to which you previously set the non-tiebreaker monitors. In the example above, it is data center
DC3.ImportantDo not add this data center to the CRUSH map as it results in the following error when you try to enter stretch mode:
Error EINVAL: there are 3 datacenters in the cluster but stretch mode currently only works with 2!
NoteIf you are writing your own tooling for deploying Ceph, you can use a new
--set-crush-locationoption when booting monitors, instead of running theceph mon set_locationcommand. This option accepts only a singlebucket=locationpair, for exampleceph-mon --set-crush-location 'datacenter=DC1', which must match the bucket type you specified when running theenable_stretch_modecommand.Verify that the stretch mode is enabled successfully:
Example
[ceph: root@host01 /]# ceph osd dump

epoch 361
fsid 1234ab78-1234-11ed-b1b1-de456ef0a89d
created 2023-01-16T05:47:28.482717+0000
modified 2023-01-17T17:36:50.066183+0000
flags sortbitwise,recovery_deletes,purged_snapdirs,pglog_hardlimit
crush_version 31
full_ratio 0.95
backfillfull_ratio 0.92
nearfull_ratio 0.85
require_min_compat_client luminous
min_compat_client luminous
require_osd_release quincy
stretch_mode_enabled true
stretch_bucket_count 2
degraded_stretch_mode 0
recovering_stretch_mode 0
stretch_mode_bucket 8
The
stretch_mode_enabledshould be set totrue. You can also see the number of stretch buckets, stretch mode buckets, and if the stretch mode is degraded or recovering.Verify that the monitors are in an appropriate locations:
Example
[ceph: root@host01 /]# ceph mon dump

epoch 19
fsid 1234ab78-1234-11ed-b1b1-de456ef0a89d
last_changed 2023-01-17T04:12:05.709475+0000
created 2023-01-16T05:47:25.631684+0000
min_mon_release 16 (pacific)
election_strategy: 3
stretch_mode_enabled 1
tiebreaker_mon host07
disallowed_leaders host07
0: [v2:132.224.169.63:3300/0,v1:132.224.169.63:6789/0] mon.host07; crush_location {datacenter=DC3}
1: [v2:220.141.179.34:3300/0,v1:220.141.179.34:6789/0] mon.host04; crush_location {datacenter=DC2}
2: [v2:40.90.220.224:3300/0,v1:40.90.220.224:6789/0] mon.host01; crush_location {datacenter=DC1}
3: [v2:60.140.141.144:3300/0,v1:60.140.141.144:6789/0] mon.host02; crush_location {datacenter=DC1}
4: [v2:186.184.61.92:3300/0,v1:186.184.61.92:6789/0] mon.host05; crush_location {datacenter=DC2}
dumped monmap epoch 19
You can also see which monitor is the tiebreaker, and the monitor election strategy.
Additional Resources
- See Configuring monitor election strategy for more information about monitor election strategy.
4.1.3. Adding OSD hosts in stretch mode
You can add Ceph OSDs in the stretch mode. The procedure is similar to the addition of the OSD hosts on a cluster where stretch mode is not enabled.
Prerequisites
- A running Red Hat Ceph Storage cluster.
- Stretch mode in enabled on a cluster.
- Root-level access to the nodes.
Procedure
List the available devices to deploy OSDs:
Syntax
ceph orch device ls [--hostname=HOST_1 HOST_2] [--wide] [--refresh]
Example
[ceph: root@host01 /]# ceph orch device ls
Deploy the OSDs on specific hosts or on all the available devices:
Create an OSD from a specific device on a specific host:
Syntax
ceph orch daemon add osd HOST:DEVICE_PATH
Example
[ceph: root@host01 /]# ceph orch daemon add osd host03:/dev/sdb
Deploy OSDs on any available and unused devices:
ImportantThis command creates collocated WAL and DB devices. If you want to create non-collocated devices, do not use this command.
Example
[ceph: root@host01 /]# ceph orch apply osd --all-available-devices
Move the OSD hosts under the CRUSH bucket:
Syntax
ceph osd crush move HOST datacenter=DATACENTER
Example
[ceph: root@host01 /]# ceph osd crush move host03 datacenter=DC1
[ceph: root@host01 /]# ceph osd crush move host06 datacenter=DC2
NoteEnsure you add the same topology nodes on both sites. Issues might arise if hosts are added only on one site.
Additional Resources
- See Adding OSDs for more information about the addition of Ceph OSDs.
Chapter 5. Override Ceph behavior
As a storage administrator, you need to understand how to use overrides for the Red Hat Ceph Storage cluster to change Ceph options during runtime.
5.1. Setting and unsetting Ceph override options
You can set and unset Ceph options to override Ceph’s default behavior.
Prerequisites
- A running Red Hat Ceph Storage cluster.
- Root-level access to the node.
Procedure
To override Ceph’s default behavior, use the
ceph osd setcommand and the behavior you wish to override:Syntax
ceph osd set FLAGOnce you set the behavior,
ceph healthwill reflect the override(s) that you have set for the cluster.Example
[ceph: root@host01 /]# ceph osd set noout
To cease overriding Ceph’s default behavior, use the
ceph osd unsetcommand and the override you wish to cease.Syntax
ceph osd unset FLAGExample
[ceph: root@host01 /]# ceph osd unset noout
| Flag | Description |
|---|---|
|
|
Prevents OSDs from being treated as |
|
|
Prevents OSDs from being treated as |
|
|
Prevents OSDs from being treated as |
|
|
Prevents OSDs from being treated as |
|
|
Makes a cluster appear to have reached its |
|
|
Ceph will stop processing read and write operations, but will not affect OSD |
|
| Ceph will prevent new backfill operations. |
|
| Ceph will prevent new rebalancing operations. |
|
| Ceph will prevent new recovery operations. |
|
| Ceph will prevent new scrubbing operations. |
|
| Ceph will prevent new deep scrubbing operations. |
|
| Ceph will disable the process that is looking for cold/dirty objects to flush and evict. |
5.2. Ceph override use cases
-
noin: Commonly used withnooutto address flapping OSDs. -
noout: If themon osd report timeoutis exceeded and an OSD has not reported to the monitor, the OSD will get markedout. If this happens erroneously, you can setnooutto prevent the OSD(s) from getting markedoutwhile you troubleshoot the issue. -
noup: Commonly used withnodownto address flapping OSDs. -
nodown: Networking issues may interrupt Ceph 'heartbeat' processes, and an OSD may beupbut still get marked down. You can setnodownto prevent OSDs from getting marked down while troubleshooting the issue. full: If a cluster is reaching itsfull_ratio, you can pre-emptively set the cluster tofulland expand capacity.NoteSetting the cluster to
fullwill prevent write operations.-
pause: If you need to troubleshoot a running Ceph cluster without clients reading and writing data, you can set the cluster topauseto prevent client operations. -
nobackfill: If you need to take an OSD or nodedowntemporarily, for example, upgrading daemons, you can setnobackfillso that Ceph will not backfill while the OSDs isdown. -
norecover: If you need to replace an OSD disk and don’t want the PGs to recover to another OSD while you are hotswapping disks, you can setnorecoverto prevent the other OSDs from copying a new set of PGs to other OSDs. -
noscrubandnodeep-scrubb: If you want to prevent scrubbing for example, to reduce overhead during high loads, recovery, backfilling, and rebalancing you can setnoscruband/ornodeep-scrubto prevent the cluster from scrubbing OSDs. -
notieragent: If you want to stop the tier agent process from finding cold objects to flush to the backing storage tier, you may setnotieragent.
Chapter 6. Ceph user management
As a storage administrator, you can manage the Ceph user base by providing authentication, and access control to objects in the Red Hat Ceph Storage cluster.
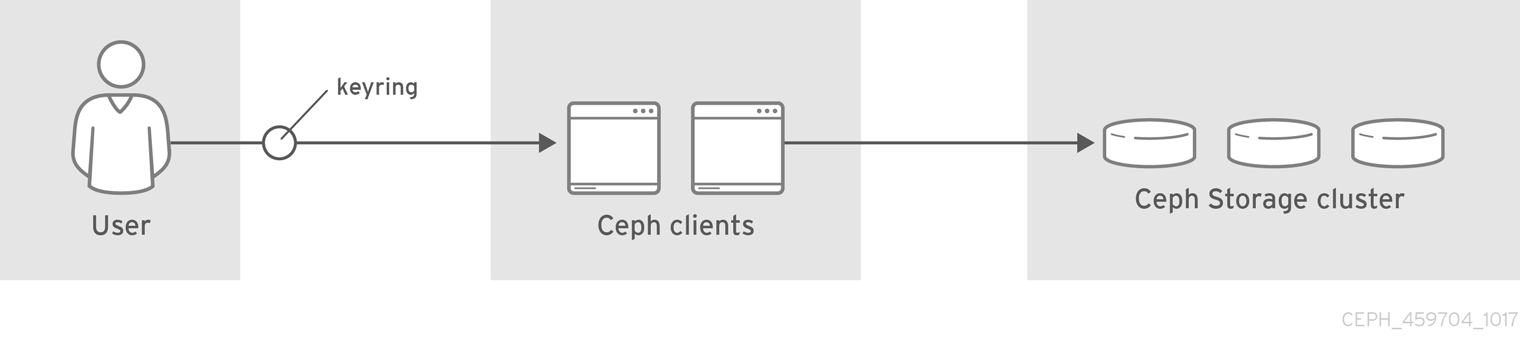
Cephadm manages the client keyrings for the Red Hat Ceph Storage cluster as long as the clients are within the scope of Cephadm. Users should not modify the keyrings that are managed by Cephadm, unless there is troubleshooting.
6.1. Ceph user management background
When Ceph runs with authentication and authorization enabled, you must specify a user name. If you do not specify a user name, Ceph will use the client.admin administrative user as the default user name.
Alternatively, you may use the CEPH_ARGS environment variable to avoid re-entry of the user name and secret.
Irrespective of the type of Ceph client, for example, block device, object store, file system, native API, or the Ceph command line, Ceph stores all data as objects within pools. Ceph users must have access to pools in order to read and write data. Additionally, administrative Ceph users must have permissions to execute Ceph’s administrative commands.
The following concepts can help you understand Ceph user management.
Storage Cluster Users
A user of the Red Hat Ceph Storage cluster is either an individual or as an application. Creating users allows you to control who can access the storage cluster, its pools, and the data within those pools.
Ceph has the notion of a type of user. For the purposes of user management, the type will always be client. Ceph identifies users in period (.) delimited form consisting of the user type and the user ID. For example, TYPE.ID, client.admin, or client.user1. The reason for user typing is that Ceph Monitors, and OSDs also use the Cephx protocol, but they are not clients. Distinguishing the user type helps to distinguish between client users and other users—streamlining access control, user monitoring and traceability.
Sometimes Ceph’s user type may seem confusing, because the Ceph command line allows you to specify a user with or without the type, depending upon the command line usage. If you specify --user or --id, you can omit the type. So client.user1 can be entered simply as user1. If you specify --name or -n, you must specify the type and name, such as client.user1. Red Hat recommends using the type and name as a best practice wherever possible.
A Red Hat Ceph Storage cluster user is not the same as a Ceph Object Gateway user. The object gateway uses a Red Hat Ceph Storage cluster user to communicate between the gateway daemon and the storage cluster, but the gateway has its own user management functionality for its end users.
Syntax
DAEMON_TYPE 'allow CAPABILITY' [DAEMON_TYPE 'allow CAPABILITY']
Monitor Caps: Monitor capabilities include
r,w,x,allow profile CAP, andprofile rbd.Example
mon 'allow rwx`
mon 'allow profile osd'
OSD Caps: OSD capabilities include
r,w,x,class-read,class-write,profile osd,profile rbd, andprofile rbd-read-only. Additionally, OSD capabilities also allow for pool and namespace settings. :Syntax
osd 'allow CAPABILITY' [pool=POOL_NAME] [namespace=NAMESPACE_NAME]
The Ceph Object Gateway daemon (radosgw) is a client of the Ceph storage cluster, so it isn’t represented as a Ceph storage cluster daemon type.
The following entries describe each capability.
|
| Precedes access settings for a daemon. |
|
| Gives the user read access. Required with monitors to retrieve the CRUSH map. |
|
| Gives the user write access to objects. |
|
|
Gives the user the capability to call class methods (that is, both read and write) and to conduct |
|
|
Gives the user the capability to call class read methods. Subset of |
|
|
Gives the user the capability to call class write methods. Subset of |
|
| Gives the user read, write and execute permissions for a particular daemon or pool, and the ability to execute admin commands. |
|
| Gives a user permissions to connect as an OSD to other OSDs or monitors. Conferred on OSDs to enable OSDs to handle replication heartbeat traffic and status reporting. |
|
| Gives a user permissions to bootstrap an OSD, so that they have permissions to add keys when bootstrapping an OSD. |
|
| Gives a user read-write access to the Ceph Block Devices. |
|
| Gives a user read-only access to the Ceph Block Devices. |
Pool
A pool defines a storage strategy for Ceph clients, and acts as a logical partition for that strategy.
In Ceph deployments, it is common to create a pool to support different types of use cases. For example, cloud volumes or images, object storage, hot storage, cold storage, and so on. When deploying Ceph as a back end for OpenStack, a typical deployment would have pools for volumes, images, backups and virtual machines, and users such as client.glance, client.cinder, and so on.
Namespace
Objects within a pool can be associated to a namespace—a logical group of objects within the pool. A user’s access to a pool can be associated with a namespace such that reads and writes by the user take place only within the namespace. Objects written to a namespace within the pool can only be accessed by users who have access to the namespace.
Currently, namespaces are only useful for applications written on top of librados. Ceph clients such as block device and object storage do not currently support this feature.
The rationale for namespaces is that pools can be a computationally expensive method of segregating data by use case, because each pool creates a set of placement groups that get mapped to OSDs. If multiple pools use the same CRUSH hierarchy and ruleset, OSD performance may degrade as load increases.
For example, a pool should have approximately 100 placement groups per OSD. So an exemplary cluster with 1000 OSDs would have 100,000 placement groups for one pool. Each pool mapped to the same CRUSH hierarchy and ruleset would create another 100,000 placement groups in the exemplary cluster. By contrast, writing an object to a namespace simply associates the namespace to the object name with out the computational overhead of a separate pool. Rather than creating a separate pool for a user or set of users, you may use a namespace.
Only available using librados at this time.
Additional Resources
- See the Red Hat Ceph Storage Configuration Guide for details on configuring the use of authentication.
6.2. Managing Ceph users
As a storage administrator, you can manage Ceph users by creating, modifying, deleting, and importing users. A Ceph client user can be either individuals or applications, which use Ceph clients to interact with the Red Hat Ceph Storage cluster daemons.
6.2.1. Listing Ceph users
You can list the users in the storage cluster using the command-line interface.
Prerequisites
- A running Red Hat Ceph Storage cluster.
- Root-level access to the node.
Procedure
To list the users in the storage cluster, execute the following:
Example
[ceph: root@host01 /]# ceph auth list
installed auth entries:

osd.10
	key: AQBW7U5gqOsEExAAg/CxSwZ/gSh8iOsDV3iQOA==
	caps: [mgr] allow profile osd
	caps: [mon] allow profile osd
	caps: [osd] allow *
osd.11
	key: AQBX7U5gtj/JIhAAPsLBNG+SfC2eMVEFkl3vfA==
	caps: [mgr] allow profile osd
	caps: [mon] allow profile osd
	caps: [osd] allow *
osd.9
	key: AQBV7U5g1XDULhAAKo2tw6ZhH1jki5aVui2v7g==
	caps: [mgr] allow profile osd
	caps: [mon] allow profile osd
	caps: [osd] allow *
client.admin
	key: AQADYEtgFfD3ExAAwH+C1qO7MSLE4TWRfD2g6g==
	caps: [mds] allow *
	caps: [mgr] allow *
	caps: [mon] allow *
	caps: [osd] allow *
client.bootstrap-mds
	key: AQAHYEtgpbkANBAANqoFlvzEXFwD8oB0w3TF4Q==
	caps: [mon] allow profile bootstrap-mds
client.bootstrap-mgr
	key: AQAHYEtg3dcANBAAVQf6brq3sxTSrCrPe0pKVQ==
	caps: [mon] allow profile bootstrap-mgr
client.bootstrap-osd
	key: AQAHYEtgD/QANBAATS9DuP3DbxEl86MTyKEmdw==
	caps: [mon] allow profile bootstrap-osd
client.bootstrap-rbd
	key: AQAHYEtgjxEBNBAANho25V9tWNNvIKnHknW59A==
	caps: [mon] allow profile bootstrap-rbd
client.bootstrap-rbd-mirror
	key: AQAHYEtgdE8BNBAAr6rLYxZci0b2hoIgH9GXYw==
	caps: [mon] allow profile bootstrap-rbd-mirror
client.bootstrap-rgw
	key: AQAHYEtgwGkBNBAAuRzI4WSrnowBhZxr2XtTFg==
	caps: [mon] allow profile bootstrap-rgw
client.crash.host04
	key: AQCQYEtgz8lGGhAAy5bJS8VH9fMdxuAZ3CqX5Q==
	caps: [mgr] profile crash
	caps: [mon] profile crash
client.crash.host02
	key: AQDuYUtgqgfdOhAAsyX+Mo35M+HFpURGad7nJA==
	caps: [mgr] profile crash
	caps: [mon] profile crash
client.crash.host03
	key: AQB98E5g5jHZAxAAklWSvmDsh2JaL5G7FvMrrA==
	caps: [mgr] profile crash
	caps: [mon] profile crash
client.nfs.foo.host03
	key: AQCgTk9gm+HvMxAAHbjG+XpdwL6prM/uMcdPdQ==
	caps: [mon] allow r
	caps: [osd] allow rw pool=nfs-ganesha namespace=foo
client.nfs.foo.host03-rgw
	key: AQCgTk9g8sJQNhAAPykcoYUuPc7IjubaFx09HQ==
	caps: [mon] allow r
	caps: [osd] allow rwx tag rgw *=*
client.rgw.test_realm.test_zone.host01.hgbvnq
	key: AQD5RE9gAQKdCRAAJzxDwD/dJObbInp9J95sXw==
	caps: [mgr] allow rw
	caps: [mon] allow *
	caps: [osd] allow rwx tag rgw *=*
client.rgw.test_realm.test_zone.host02.yqqilm
	key: AQD0RE9gkxA4ExAAFXp3pLJWdIhsyTe2ZR6Ilw==
	caps: [mgr] allow rw
	caps: [mon] allow *
	caps: [osd] allow rwx tag rgw *=*
mgr.host01.hdhzwn
	key: AQAEYEtg3lhIBxAAmHodoIpdvnxK0llWF80ltQ==
	caps: [mds] allow *
	caps: [mon] profile mgr
	caps: [osd] allow *
mgr.host02.eobuuv
	key: AQAn6U5gzUuiABAA2Fed+jPM1xwb4XDYtrQxaQ==
	caps: [mds] allow *
	caps: [mon] profile mgr
	caps: [osd] allow *
mgr.host03.wquwpj
	key: AQAd6U5gIzWsLBAAbOKUKZlUcAVe9kBLfajMKw==
	caps: [mds] allow *
	caps: [mon] profile mgr
	caps: [osd] allow *
The TYPE.ID notation for users applies such that osd.0 is a user of type osd and its ID is 0, client.admin is a user of type client and its ID is admin, that is, the default client.admin user. Note also that each entry has a key: VALUE entry, and one or more caps: entries.
You may use the -o FILE_NAME option with ceph auth list to save the output to a file.
6.2.2. Display Ceph user information
You can display a Ceph’s user information using the command-line interface.
Prerequisites
- A running Red Hat Ceph Storage cluster.
- Root-level access to the node.
Procedure
To retrieve a specific user, key and capabilities, execute the following:
Syntax
ceph auth export TYPE.ID
Example
[ceph: root@host01 /]# ceph auth export mgr.host02.eobuuv
You can also use the
-o FILE_NAMEoption.Syntax
ceph auth export TYPE.ID -o FILE_NAME
Example
[ceph: root@host01 /]# ceph auth export osd.9 -o filename
export auth(key=AQBV7U5g1XDULhAAKo2tw6ZhH1jki5aVui2v7g==)
The auth export command is identical to auth get, but also prints out the internal auid, which isn’t relevant to end users.
6.2.3. Add a new Ceph user
Adding a user creates a username, that is, TYPE.ID, a secret key and any capabilities included in the command you use to create the user.
A user’s key enables the user to authenticate with the Ceph storage cluster. The user’s capabilities authorize the user to read, write, or execute on Ceph monitors (mon), Ceph OSDs (osd) or Ceph Metadata Servers (mds).
There are a few ways to add a user:
-
ceph auth add: This command is the canonical way to add a user. It will create the user, generate a key and add any specified capabilities. -
ceph auth get-or-create: This command is often the most convenient way to create a user, because it returns a keyfile format with the user name (in brackets) and the key. If the user already exists, this command simply returns the user name and key in the keyfile format. You may use the-o FILE_NAMEoption to save the output to a file. -
ceph auth get-or-create-key: This command is a convenient way to create a user and return the user’s key only. This is useful for clients that need the key only, for example,libvirt. If the user already exists, this command simply returns the key. You may use the-o FILE_NAMEoption to save the output to a file.
When creating client users, you may create a user with no capabilities. A user with no capabilities is useless beyond mere authentication, because the client cannot retrieve the cluster map from the monitor. However, you can create a user with no capabilities if you wish to defer adding capabilities later using the ceph auth caps command.
A typical user has at least read capabilities on the Ceph monitor and read and write capability on Ceph OSDs. Additionally, a user’s OSD permissions are often restricted to accessing a particular pool. :
[ceph: root@host01 /]# ceph auth add client.john mon 'allow r' osd 'allow rw pool=mypool'
[ceph: root@host01 /]# ceph auth get-or-create client.paul mon 'allow r' osd 'allow rw pool=mypool'
[ceph: root@host01 /]# ceph auth get-or-create client.george mon 'allow r' osd 'allow rw pool=mypool' -o george.keyring
[ceph: root@host01 /]# ceph auth get-or-create-key client.ringo mon 'allow r' osd 'allow rw pool=mypool' -o ringo.key
If you provide a user with capabilities to OSDs, but you DO NOT restrict access to particular pools, the user will have access to ALL pools in the cluster!
6.2.4. Modifying a Ceph User
The ceph auth caps command allows you to specify a user and change the user’s capabilities.
Prerequisites
- A running Red Hat Ceph Storage cluster.
- Root-level access to the node.
Procedure
To add capabilities, use the form:
Syntax
ceph auth caps USERTYPE.USERID DAEMON 'allow [r|w|x|*|...] [pool=POOL_NAME] [namespace=NAMESPACE_NAME]'
Example
[ceph: root@host01 /]# ceph auth caps client.john mon 'allow r' osd 'allow rw pool=mypool'
[ceph: root@host01 /]# ceph auth caps client.paul mon 'allow rw' osd 'allow rwx pool=mypool'
[ceph: root@host01 /]# ceph auth caps client.brian-manager mon 'allow *' osd 'allow *'
To remove a capability, you may reset the capability. If you want the user to have no access to a particular daemon that was previously set, specify an empty string:
Example
[ceph: root@host01 /]# ceph auth caps client.ringo mon ' ' osd ' '
Additional Resources
- See Authorization capabilities for additional details on capabilities.
6.2.5. Deleting a Ceph user
You can delete a user from the Ceph storage cluster using the command-line interface.
Prerequisites
- A running Red Hat Ceph Storage cluster.
- Root-level access to the node.
Procedure
To delete a user, use
ceph auth del:Syntax
ceph auth del TYPE.ID
Example
[ceph: root@host01 /]# ceph auth del osd.6
6.2.6. Print a Ceph user key
You can display a Ceph user’s key information using the command-line interface.
Prerequisites
- A running Red Hat Ceph Storage cluster.
- Root-level access to the node.
Procedure
Print a user’s authentication key to standard output:
Syntax
ceph auth print-key TYPE.ID
Example
[ceph: root@host01 /]# ceph auth print-key osd.6

AQBQ7U5gAry3JRAA3NoPrqBBThpFMcRL6Sr+5w==[ceph: root@host01 /]#
Chapter 7. The ceph-volume utility
As a storage administrator, you can prepare, list, create, activate, deactivate, batch, trigger, zap, and migrate Ceph OSDs using the ceph-volume utility. The ceph-volume utility is a single-purpose command-line tool to deploy logical volumes as OSDs. It uses a plugin-type framework to deploy OSDs with different device technologies. The ceph-volume utility follows a similar workflow of the ceph-disk utility for deploying OSDs, with a predictable, and robust way of preparing, activating, and starting OSDs. Currently, the ceph-volume utility only supports the lvm plugin, with the plan to support others technologies in the future.
The ceph-disk command is deprecated.
7.1. Ceph volume lvm plugin
By making use of LVM tags, the lvm sub-command is able to store and re-discover by querying devices associated with OSDs so they can be activated. This includes support for lvm-based technologies like dm-cache as well.
When using ceph-volume, the use of dm-cache is transparent, and treats dm-cache like a logical volume. The performance gains and losses when using dm-cache will depend on the specific workload. Generally, random and sequential reads will see an increase in performance at smaller block sizes. While random and sequential writes will see a decrease in performance at larger block sizes.
To use the LVM plugin, add lvm as a subcommand to the ceph-volume command within the cephadm shell:
[ceph: root@host01 /]# ceph-volume lvm
Following are the lvm subcommands:
-
prepare- Format an LVM device and associate it with an OSD. -
activate- Discover and mount the LVM device associated with an OSD ID and start the Ceph OSD. -
list- List logical volumes and devices associated with Ceph. -
batch- Automatically size devices for multi-OSD provisioning with minimal interaction. -
deactivate- Deactivate OSDs. -
create- Create a new OSD from an LVM device. -
trigger- A systemd helper to activate an OSD. -
zap- Removes all data and filesystems from a logical volume or partition. -
migrate- Migrate BlueFS data from to another LVM device. -
new-wal- Allocate new WAL volume for the OSD at specified logical volume. -
new-db- Allocate new DB volume for the OSD at specified logical volume.
Using the create subcommand combines the prepare and activate subcommands into one subcommand.
Additional Resources
-
See the
createsubcommand section for more details.
7.2. Why does ceph-volume replace ceph-disk?
Up to Red Hat Ceph Storage 4, ceph-disk utility was used to prepare, activate, and create OSDs. Starting with Red Hat Ceph Storage 4, ceph-disk is replaced by the ceph-volume utility that aims to be a single purpose command-line tool to deploy logical volumes as OSDs, while maintaining a similar API to ceph-disk when preparing, activating, and creating OSDs.
How does ceph-volume work?
The ceph-volume is a modular tool that currently supports two ways of provisioning hardware devices, legacy ceph-disk devices and LVM (Logical Volume Manager) devices. The ceph-volume lvm command uses the LVM tags to store information about devices specific to Ceph and its relationship with OSDs. It uses these tags to later re-discover and query devices associated with OSDS so that it can activate them. It supports technologies based on LVM and dm-cache as well.
The ceph-volume utility uses dm-cache transparently and treats it as a logical volume. You might consider the performance gains and losses when using dm-cache, depending on the specific workload you are handling. Generally, the performance of random and sequential read operations increases at smaller block sizes; while the performance of random and sequential write operations decreases at larger block sizes. Using ceph-volume does not introduce any significant performance penalties.
The ceph-disk utility is deprecated.
The ceph-volume simple command can handle legacy ceph-disk devices, if these devices are still in use.
How does ceph-disk work?
The ceph-disk utility was required to support many different types of init systems, such as upstart or sysvinit, while being able to discover devices. For this reason, ceph-disk concentrates only on GUID Partition Table (GPT) partitions. Specifically on GPT GUIDs that label devices in a unique way to answer questions like:
-
Is this device a
journal? - Is this device an encrypted data partition?
- Was the device left partially prepared?
To solve these questions, ceph-disk uses UDEV rules to match the GUIDs.
What are disadvantages of using ceph-disk?
Using the UDEV rules to call ceph-disk can lead to a back-and-forth between the ceph-disk systemd unit and the ceph-disk executable. The process is very unreliable and time consuming and can cause OSDs to not come up at all during the boot process of a node. Moreover, it is hard to debug, or even replicate these problems given the asynchronous behavior of UDEV.
Because ceph-disk works with GPT partitions exclusively, it cannot support other technologies, such as Logical Volume Manager (LVM) volumes, or similar device mapper devices.
To ensure the GPT partitions work correctly with the device discovery workflow, ceph-disk requires a large number of special flags to be used. In addition, these partitions require devices to be exclusively owned by Ceph.
7.3. Preparing Ceph OSDs using ceph-volume
The prepare subcommand prepares an OSD back-end object store and consumes logical volumes (LV) for both the OSD data and journal. It does not modify the logical volumes, except for adding some extra metadata tags using LVM. These tags make volumes easier to discover, and they also identify the volumes as part of the Ceph Storage Cluster and the roles of those volumes in the storage cluster.
The BlueStore OSD backend supports the following configurations:
-
A block device, a
block.waldevice, and ablock.dbdevice -
A block device and a
block.waldevice -
A block device and a
block.dbdevice - A single block device
The prepare subcommand accepts a whole device or partition, or a logical volume for block.
Prerequisites
- Root-level access to the OSD nodes.
- Optionally, create logical volumes. If you provide a path to a physical device, the subcommand turns the device into a logical volume. This approach is simpler, but you cannot configure or change the way the logical volume is created.
Procedure
Extract the Ceph keyring:
Syntax
ceph auth get client.ID -o ceph.client.ID.keyring
Example
[ceph: root@host01 /]# ceph auth get client.bootstrap-osd -o /var/lib/ceph/bootstrap-osd/ceph.keyring
Prepare the LVM volumes:
Syntax
ceph-volume lvm prepare --bluestore --data VOLUME_GROUP/LOGICAL_VOLUME
Example
[ceph: root@host01 /]# ceph-volume lvm prepare --bluestore --data example_vg/data_lv
Optionally, if you want to use a separate device for RocksDB, specify the
--block.dband--block.waloptions:Syntax
ceph-volume lvm prepare --bluestore --block.db BLOCK_DB_DEVICE --block.wal BLOCK_WAL_DEVICE --data DATA_DEVICE
Example
[ceph: root@host01 /]# ceph-volume lvm prepare --bluestore --block.db /dev/sda --block.wal /dev/sdb --data /dev/sdc
Optionally, to encrypt data, use the
--dmcryptflag:Syntax
ceph-volume lvm prepare --bluestore --dmcrypt --data VOLUME_GROUP/LOGICAL_VOLUME
Example
[ceph: root@host01 /]# ceph-volume lvm prepare --bluestore --dmcrypt --data example_vg/data_lv
Additional Resources
- See the Activating Ceph OSDs using `ceph-volume` section in the Red Hat Ceph Storage Administration Guide for more details.
- See the Creating Ceph OSDs using `ceph-volume` section in the Red Hat Ceph Storage Administration Guide for more details.
7.4. Listing devices using ceph-volume
You can use the ceph-volume lvm list subcommand to list logical volumes and devices associated with a Ceph cluster, as long as they contain enough metadata to allow for that discovery. The output is grouped by the OSD ID associated with the devices. For logical volumes, the devices key is populated with the physical devices associated with the logical volume.
In some cases, the output of the ceph -s command shows the following error message:
1 devices have fault light turned on
In such cases, you can list the devices with ceph device ls-lights command which gives the details about the lights on the devices. Based on the information, you can turn off the lights on the devices.
Prerequisites
- A running Red Hat Ceph Storage cluster.
- Root-level access to the Ceph OSD node.
Procedure
List the devices in the Ceph cluster:
Example
[ceph: root@host01 /]# ceph-volume lvm list


====== osd.6 =======

  [block]       /dev/ceph-83909f70-95e9-4273-880e-5851612cbe53/osd-block-7ce687d9-07e7-4f8f-a34e-d1b0efb89920

      block device              /dev/ceph-83909f70-95e9-4273-880e-5851612cbe53/osd-block-7ce687d9-07e7-4f8f-a34e-d1b0efb89920
      block uuid                4d7gzX-Nzxp-UUG0-bNxQ-Jacr-l0mP-IPD8cX
      cephx lockbox secret
      cluster fsid              1ca9f6a8-d036-11ec-8263-fa163ee967ad
      cluster name              ceph
      crush device class        None
      encrypted                 0
      osd fsid                  7ce687d9-07e7-4f8f-a34e-d1b0efb89920
      osd id                    6
      osdspec affinity          all-available-devices
      type                      block
      vdo                       0
      devices                   /dev/vdc
Optional: List the devices in the storage cluster with the lights:
Example
[ceph: root@host01 /]# ceph device ls-lights

{
    "fault": [
        "SEAGATE_ST12000NM002G_ZL2KTGCK0000C149"
    ],
    "ident": []
}
Optional: Turn off the lights on the device:
Syntax
ceph device light off DEVICE_NAME FAULT/INDENT --force
Example
[ceph: root@host01 /]# ceph device light off SEAGATE_ST12000NM002G_ZL2KTGCK0000C149 fault --force
7.5. Activating Ceph OSDs using ceph-volume
The activation process enables a systemd unit at boot time, which allows the correct OSD identifier and its UUID to be enabled and mounted.
Prerequisites
- A running Red Hat Ceph Storage cluster.
- Root-level access to the Ceph OSD node.
-
Ceph OSDs prepared by the
ceph-volumeutility.
Procedure
Get the OSD ID and OSD FSID from an OSD node:
[ceph: root@host01 /]# ceph-volume lvm list
Activate the OSD:
Syntax
ceph-volume lvm activate --bluestore OSD_ID OSD_FSID
Example
[ceph: root@host01 /]# ceph-volume lvm activate --bluestore 10 7ce687d9-07e7-4f8f-a34e-d1b0efb89920
To activate all OSDs that are prepared for activation, use the
--alloption:Example
[ceph: root@host01 /]# ceph-volume lvm activate --all
Optionally, you can use the
triggersubcommand. This command cannot be used directly, and it is used bysystemdso that it proxies input toceph-volume lvm activate. This parses the metadata coming from systemd and startup, detecting the UUID and ID associated with an OSD.Syntax
ceph-volume lvm trigger SYSTEMD_DATAHere the SYSTEMD_DATA is in OSD_ID-OSD_FSID format.
Example
[ceph: root@host01 /]# ceph-volume lvm trigger 10 7ce687d9-07e7-4f8f-a34e-d1b0efb89920
Additional Resources
- See the Preparing Ceph OSDs using `ceph-volume` section in the Red Hat Ceph Storage Administration Guide for more details.
- See the Creating Ceph OSDs using `ceph-volume` section in the Red Hat Ceph Storage Administration Guide for more details.
7.6. Deactivating Ceph OSDs using ceph-volume
You can deactivate the Ceph OSDs using the ceph-volume lvm subcommand. This subcommand removes the volume groups and the logical volume.
Prerequisites
- A running Red Hat Ceph Storage cluster.
- Root-level access to the Ceph OSD node.
-
The Ceph OSDs are activated using the
ceph-volumeutility.
Procedure
Get the OSD ID from the OSD node:
[ceph: root@host01 /]# ceph-volume lvm list
Deactivate the OSD:
Syntax
ceph-volume lvm deactivate OSD_IDExample
[ceph: root@host01 /]# ceph-volume lvm deactivate 16
Additional Resources
- See the Activating Ceph OSDs using `ceph-volume` section in the Red Hat Ceph Storage Administration Guide for more details.
- See the Preparing Ceph OSDs using `ceph-volume` section in the Red Hat Ceph Storage Administration Guide for more details.
- See the Creating Ceph OSDs using `ceph-volume` section in the Red Hat Ceph Storage Administration Guide for more details.
7.7. Creating Ceph OSDs using ceph-volume
The create subcommand calls the prepare subcommand, and then calls the activate subcommand.
Prerequisites
- A running Red Hat Ceph Storage cluster.
- Root-level access to the Ceph OSD nodes.
If you prefer to have more control over the creation process, you can use the prepare and activate subcommands separately to create the OSD, instead of using create. You can use the two subcommands to gradually introduce new OSDs into a storage cluster, while avoiding having to rebalance large amounts of data. Both approaches work the same way, except that using the create subcommand causes the OSD to become up and in immediately after completion.
Procedure
To create a new OSD:
Syntax
ceph-volume lvm create --bluestore --data VOLUME_GROUP/LOGICAL_VOLUME
Example
[root@osd ~]# ceph-volume lvm create --bluestore --data example_vg/data_lv
Additional Resources
- See the Preparing Ceph OSDs using `ceph-volume` section in the Red Hat Ceph Storage Administration Guide for more details.
- See the Activating Ceph OSDs using `ceph-volume` section in the Red Hat Ceph Storage Administration Guide for more details.
7.8. Migrating BlueFS data
You can migrate the BlueStore file system (BlueFS) data, that is the RocksDB data, from the source volume to the target volume using the migrate LVM subcommand. The source volume, except the main one, is removed on success.
LVM volumes are primarily for the target only.
The new volumes are attached to the OSD, replacing one of the source drives.
Following are the placement rules for the LVM volumes:
- If source list has DB or WAL volume, then the target device replaces it.
-
if source list has slow volume only, then explicit allocation using the
new-dbornew-walcommand is needed.
The new-db and new-wal commands attaches the given logical volume to the given OSD as a DB or a WAL volume respectively.
Prerequisites
- A running Red Hat Ceph Storage cluster.
- Root-level access to the Ceph OSD node.
-
Ceph OSDs prepared by the
ceph-volumeutility. - Volume groups and Logical volumes are created.
Procedure
Log in the
cephadmshell:Example
[root@host01 ~]# cephadm shell
Stop the OSD to which you have to add the DB or the WAL device:
Example
[ceph: root@host01 /]# ceph orch daemon stop osd.1
Mount the new devices to the container:
Example
[root@host01 ~]# cephadm shell --mount /var/lib/ceph/72436d46-ca06-11ec-9809-ac1f6b5635ee/osd.1:/var/lib/ceph/osd/ceph-1
Attach the given logical volume to OSD as a DB/WAL device:
NoteThis command fails if the OSD has an attached DB.
Syntax
ceph-volume lvm new-db --osd-id OSD_ID --osd-fsid OSD_FSID --target VOLUME_GROUP_NAME/LOGICAL_VOLUME_NAME
Example
[ceph: root@host01 /]# ceph-volume lvm new-db --osd-id 1 --osd-fsid 7ce687d9-07e7-4f8f-a34e-d1b0efb89921 --target vgname/new_db
[ceph: root@host01 /]# ceph-volume lvm new-wal --osd-id 1 --osd-fsid 7ce687d9-07e7-4f8f-a34e-d1b0efb89921 --target vgname/new_wal
You can migrate BlueFS data in the following ways:
Move BlueFS data from main device to LV that is already attached as DB:
Syntax
ceph-volume lvm migrate --osd-id OSD_ID --osd-fsid OSD_UUID --from data --target VOLUME_GROUP_NAME/LOGICAL_VOLUME_NAME
Example
[ceph: root@host01 /]# ceph-volume lvm migrate --osd-id 1 --osd-fsid 0263644D-0BF1-4D6D-BC34-28BD98AE3BC8 --from data --target vgname/db
Move BlueFS data from shared main device to LV which shall be attached as a new DB:
Syntax
ceph-volume lvm migrate --osd-id OSD_ID --osd-fsid OSD_UUID --from data --target VOLUME_GROUP_NAME/LOGICAL_VOLUME_NAME
Example
[ceph: root@host01 /]# ceph-volume lvm migrate --osd-id 1 --osd-fsid 0263644D-0BF1-4D6D-BC34-28BD98AE3BC8 --from data --target vgname/new_db
Move BlueFS data from DB device to new LV, and replace the DB device:
Syntax
ceph-volume lvm migrate --osd-id OSD_ID --osd-fsid OSD_UUID --from db --target VOLUME_GROUP_NAME/LOGICAL_VOLUME_NAME
Example
[ceph: root@host01 /]# ceph-volume lvm migrate --osd-id 1 --osd-fsid 0263644D-0BF1-4D6D-BC34-28BD98AE3BC8 --from db --target vgname/new_db
Move BlueFS data from main and DB devices to new LV, and replace the DB device:
Syntax
ceph-volume lvm migrate --osd-id OSD_ID --osd-fsid OSD_UUID --from data db --target VOLUME_GROUP_NAME/LOGICAL_VOLUME_NAME
Example
[ceph: root@host01 /]# ceph-volume lvm migrate --osd-id 1 --osd-fsid 0263644D-0BF1-4D6D-BC34-28BD98AE3BC8 --from data db --target vgname/new_db
Move BlueFS data from main, DB, and WAL devices to new LV, remove the WAL device, and replace the the DB device:
Syntax
ceph-volume lvm migrate --osd-id OSD_ID --osd-fsid OSD_UUID --from data db wal --target VOLUME_GROUP_NAME/LOGICAL_VOLUME_NAME
Example
[ceph: root@host01 /]# ceph-volume lvm migrate --osd-id 1 --osd-fsid 0263644D-0BF1-4D6D-BC34-28BD98AE3BC8 --from data db --target vgname/new_db
Move BlueFS data from main, DB, and WAL devices to the main device, remove the WAL and DB devices:
Syntax
ceph-volume lvm migrate --osd-id OSD_ID --osd-fsid OSD_UUID --from db wal --target VOLUME_GROUP_NAME/LOGICAL_VOLUME_NAME
Example
[ceph: root@host01 /]# ceph-volume lvm migrate --osd-id 1 --osd-fsid 0263644D-0BF1-4D6D-BC34-28BD98AE3BC8 --from db wal --target vgname/data
7.9. Using batch mode with ceph-volume
The batch subcommand automates the creation of multiple OSDs when single devices are provided.
The ceph-volume command decides the best method to use to create the OSDs, based on drive type. Ceph OSD optimization depends on the available devices:
-
If all devices are traditional hard drives,
batchcreates one OSD per device. -
If all devices are solid state drives,
batchcreates two OSDs per device. -
If there is a mix of traditional hard drives and solid state drives,
batchuses the traditional hard drives for data, and creates the largest possible journal (block.db) on the solid state drive.
The batch subcommand does not support the creation of a separate logical volume for the write-ahead-log (block.wal) device.
Prerequisites
- A running Red Hat Ceph Storage cluster.
- Root-level access to the Ceph OSD nodes.
Procedure
To create OSDs on several drives:
Syntax
ceph-volume lvm batch --bluestore PATH_TO_DEVICE [PATH_TO_DEVICE]
Example
[ceph: root@host01 /]# ceph-volume lvm batch --bluestore /dev/sda /dev/sdb /dev/nvme0n1
Additional Resources
- See the Creating Ceph OSDs using `ceph-volume` section in the Red Hat Ceph Storage Administration Guide for more details.
7.10. Zapping data using ceph-volume
The zap subcommand removes all data and filesystems from a logical volume or partition.
You can use the zap subcommand to zap logical volumes, partitions, or raw devices that are used by Ceph OSDs for reuse. Any filesystems present on the given logical volume or partition are removed and all data is purged.
Optionally, you can use the --destroy flag for complete removal of a logical volume, partition, or the physical device.
Prerequisites
- A running Red Hat Ceph Storage cluster.
- Root-level access to the Ceph OSD node.
Procedure
Zap the logical volume:
Syntax
ceph-volume lvm zap VOLUME_GROUP_NAME/LOGICAL_VOLUME_NAME [--destroy]
Example
[ceph: root@host01 /]# ceph-volume lvm zap osd-vg/data-lv
Zap the partition:
Syntax
ceph-volume lvm zap DEVICE_PATH_PARTITION [--destroy]Example
[ceph: root@host01 /]# ceph-volume lvm zap /dev/sdc1
Zap the raw device:
Syntax
ceph-volume lvm zap DEVICE_PATH --destroyExample
[ceph: root@host01 /]# ceph-volume lvm zap /dev/sdc --destroy
Purge multiple devices with the OSD ID:
Syntax
ceph-volume lvm zap --destroy --osd-id OSD_IDExample
[ceph: root@host01 /]# ceph-volume lvm zap --destroy --osd-id 16
NoteAll the relative devices are zapped.
Purge OSDs with the FSID:
Syntax
ceph-volume lvm zap --destroy --osd-fsid OSD_FSIDExample
[ceph: root@host01 /]# ceph-volume lvm zap --destroy --osd-fsid 65d7b6b1-e41a-4a3c-b363-83ade63cb32b
NoteAll the relative devices are zapped.
Chapter 8. Ceph performance benchmark
As a storage administrator, you can benchmark performance of the Red Hat Ceph Storage cluster. The purpose of this section is to give Ceph administrators a basic understanding of Ceph’s native benchmarking tools. These tools will provide some insight into how the Ceph storage cluster is performing. This is not the definitive guide to Ceph performance benchmarking, nor is it a guide on how to tune Ceph accordingly.
8.1. Performance baseline
The OSD, including the journal, disks and the network throughput should each have a performance baseline to compare against. You can identify potential tuning opportunities by comparing the baseline performance data with the data from Ceph’s native tools. Red Hat Enterprise Linux has many built-in tools, along with a plethora of open source community tools, available to help accomplish these tasks.
Additional Resources
- For more details about some of the available tools, see this Knowledgebase article.
8.2. Benchmarking Ceph performance
Ceph includes the rados bench command to do performance benchmarking on a RADOS storage cluster. The command will execute a write test and two types of read tests. The --no-cleanup option is important to use when testing both read and write performance. By default the rados bench command will delete the objects it has written to the storage pool. Leaving behind these objects allows the two read tests to measure sequential and random read performance.
Before running these performance tests, drop all the file system caches by running the following:
Example
[ceph: root@host01 /]# echo 3 | sudo tee /proc/sys/vm/drop_caches && sudo sync
Prerequisites
- A running Red Hat Ceph Storage cluster.
- Root-level access to the node.
Procedure
Create a new storage pool:
Example
[ceph: root@host01 /]# ceph osd pool create testbench 100 100
Execute a write test for 10 seconds to the newly created storage pool:
Example
[ceph: root@host01 /]# rados bench -p testbench 10 write --no-cleanup

Maintaining 16 concurrent writes of 4194304 bytes for up to 10 seconds or 0 objects
 Object prefix: benchmark_data_cephn1.home.network_10510
   sec Cur ops   started  finished  avg MB/s  cur MB/s  last lat   avg lat
     0       0         0         0         0         0         -         0
     1      16        16         0         0         0         -         0
     2      16        16         0         0         0         -         0
     3      16        16         0         0         0         -         0
     4      16        17         1  0.998879         1   3.19824   3.19824
     5      16        18         2   1.59849         4   4.56163   3.87993
     6      16        18         2   1.33222         0         -   3.87993
     7      16        19         3   1.71239         2   6.90712     4.889
     8      16        25         9   4.49551        24   7.75362   6.71216
     9      16        25         9   3.99636         0         -   6.71216
    10      16        27        11   4.39632         4   9.65085   7.18999
    11      16        27        11   3.99685         0         -   7.18999
    12      16        27        11   3.66397         0         -   7.18999
    13      16        28        12   3.68975   1.33333   12.8124   7.65853
    14      16        28        12   3.42617         0         -   7.65853
    15      16        28        12   3.19785         0         -   7.65853
    16      11        28        17   4.24726   6.66667   12.5302   9.27548
    17      11        28        17   3.99751         0         -   9.27548
    18      11        28        17   3.77546         0         -   9.27548
    19      11        28        17   3.57683         0         -   9.27548
 Total time run:         19.505620
Total writes made:      28
Write size:             4194304
Bandwidth (MB/sec):     5.742

Stddev Bandwidth:       5.4617
Max bandwidth (MB/sec): 24
Min bandwidth (MB/sec): 0
Average Latency:        10.4064
Stddev Latency:         3.80038
Max latency:            19.503
Min latency:            3.19824
Execute a sequential read test for 10 seconds to the storage pool:
Example
[ceph: root@host01 /]# rados bench -p testbench 10 seq

sec Cur ops   started  finished  avg MB/s  cur MB/s  last lat   avg lat
  0       0         0         0         0         0         -         0
Total time run:        0.804869
Total reads made:      28
Read size:             4194304
Bandwidth (MB/sec):    139.153

Average Latency:       0.420841
Max latency:           0.706133
Min latency:           0.0816332
Execute a random read test for 10 seconds to the storage pool:
Example
[ceph: root@host01 /]# rados bench -p testbench 10 rand

sec Cur ops   started  finished  avg MB/s  cur MB/s  last lat   avg lat
  0       0         0         0         0         0         -         0
  1      16        46        30   119.801       120  0.440184  0.388125
  2      16        81        65   129.408       140  0.577359  0.417461
  3      16       120       104   138.175       156  0.597435  0.409318
  4      15       157       142   141.485       152  0.683111  0.419964
  5      16       206       190   151.553       192  0.310578  0.408343
  6      16       253       237   157.608       188 0.0745175  0.387207
  7      16       287       271   154.412       136  0.792774   0.39043
  8      16       325       309   154.044       152  0.314254   0.39876
  9      16       362       346   153.245       148  0.355576  0.406032
 10      16       405       389   155.092       172   0.64734  0.398372
Total time run:        10.302229
Total reads made:      405
Read size:             4194304
Bandwidth (MB/sec):    157.248

Average Latency:       0.405976
Max latency:           1.00869
Min latency:           0.0378431
To increase the number of concurrent reads and writes, use the
-toption, which the default is 16 threads. Also, the-bparameter can adjust the size of the object being written. The default object size is 4 MB. A safe maximum object size is 16 MB. Red Hat recommends running multiple copies of these benchmark tests to different pools. Doing this shows the changes in performance from multiple clients.Add the
--run-name LABELoption to control the names of the objects that get written during the benchmark test. Multiplerados benchcommands might be ran simultaneously by changing the--run-namelabel for each running command instance. This prevents potential I/O errors that can occur when multiple clients are trying to access the same object and allows for different clients to access different objects. The--run-nameoption is also useful when trying to simulate a real world workload.Example
[ceph: root@host01 /]# rados bench -p testbench 10 write -t 4 --run-name client1

Maintaining 4 concurrent writes of 4194304 bytes for up to 10 seconds or 0 objects
 Object prefix: benchmark_data_node1_12631
   sec Cur ops   started  finished  avg MB/s  cur MB/s  last lat   avg lat
     0       0         0         0         0         0         -         0
     1       4         4         0         0         0         -         0
     2       4         6         2   3.99099         4   1.94755   1.93361
     3       4         8         4   5.32498         8     2.978   2.44034
     4       4         8         4   3.99504         0         -   2.44034
     5       4        10         6   4.79504         4   2.92419    2.4629
     6       3        10         7   4.64471         4   3.02498    2.5432
     7       4        12         8   4.55287         4   3.12204   2.61555
     8       4        14        10    4.9821         8   2.55901   2.68396
     9       4        16        12   5.31621         8   2.68769   2.68081
    10       4        17        13   5.18488         4   2.11937   2.63763
    11       4        17        13   4.71431         0         -   2.63763
    12       4        18        14   4.65486         2    2.4836   2.62662
    13       4        18        14   4.29757         0         -   2.62662
Total time run:         13.123548
Total writes made:      18
Write size:             4194304
Bandwidth (MB/sec):     5.486

Stddev Bandwidth:       3.0991
Max bandwidth (MB/sec): 8
Min bandwidth (MB/sec): 0
Average Latency:        2.91578
Stddev Latency:         0.956993
Max latency:            5.72685
Min latency:            1.91967
Remove the data created by the
rados benchcommand:Example
[ceph: root@host01 /]# rados -p testbench cleanup
8.3. Benchmarking Ceph block performance
Ceph includes the rbd bench-write command to test sequential writes to the block device measuring throughput and latency. The default byte size is 4096, the default number of I/O threads is 16, and the default total number of bytes to write is 1 GB. These defaults can be modified by the --io-size, --io-threads and --io-total options respectively.
Prerequisites
- A running Red Hat Ceph Storage cluster.
- Root-level access to the node.
Procedure
Run the write performance test against the block device
Example
[root@host01 ~]# rbd bench --io-type write image01 --pool=testbench

bench-write  io_size 4096 io_threads 16 bytes 1073741824 pattern seq
  SEC       OPS   OPS/SEC   BYTES/SEC
    2     11127   5479.59  22444382.79
    3     11692   3901.91  15982220.33
    4     12372   2953.34  12096895.42
    5     12580   2300.05  9421008.60
    6     13141   2101.80  8608975.15
    7     13195    356.07  1458459.94
    8     13820    390.35  1598876.60
    9     14124    325.46  1333066.62
    ..
Additional Resources
-
See the Ceph block devices chapter in the Red Hat Ceph Storage Block Device Guide for more information on the
rbdcommand.
8.4. Benchmarking CephFS performance
You can use the FIO tool to benchmark Ceph File System (CephFS) performance. This tool can also be used to benchmark Ceph Block Device.
Prerequisites
- A running Red Hat Ceph Storage cluster.
- Root-level access to the node.
- FIO tool installed on the nodes. See the KCS How to install the Flexible I/O Tester (fio) performance benchmarking tool for more details.
- Block Device or the Ceph File System mounted on the node.
Procedure
Navigate to the node or the application where the Block Device or the CephFS is mounted:
Example
[root@host01 ~]# cd /mnt/ceph-block-device
[root@host01 ~]# cd /mnt/ceph-file-system
Run FIO command. Start the
bsvalue from 4k and repeat in power of 2 increments (4k, 8k, 16k, 32k … 128k… 512k, 1m, 2m, 4m ) and with differentiodepthsettings. You should also run tests at your expected workload operation size.Example for 4K tests with different iodepth values
fio --name=randwrite --rw=randwrite --direct=1 --ioengine=libaio --bs=4k --iodepth=32 --size=5G --runtime=60 --group_reporting=1
Example for 8K tests with different iodepth values
fio --name=randwrite --rw=randwrite --direct=1 --ioengine=libaio --bs=8k --iodepth=32 --size=5G --runtime=60 --group_reporting=1
NoteFor more information on the usage of
fiocommand, see thefioman page.
8.5. Benchmarking Ceph Object Gateway performance
You can use the s3cmd tool to benchmark Ceph Object Gateway performance.
Use get and put requests to determine the performance.
Prerequisites
- A running Red Hat Ceph Storage cluster.
- Root-level access to the node.
-
s3cmdinstalled on the nodes.
Procedure
Upload a file and measure the speed. The
timecommand measures the duration of upload.Syntax
time s3cmd put PATH_OF_SOURCE_FILE PATH_OF_DESTINATION_FILE
Example
time s3cmd put /path-to-local-file s3://bucket-name/remote/file
Replace
/path-to-local-filewith the file you want to upload ands3://bucket-name/remote/filewith the destination in your S3 bucket.Download a file and measure the speed. The
timecommand measures the duration of download.Syntax
time s3cmd get PATH_OF_DESTINATION_FILE DESTINATION_PATH
Example
time s3cmd get s3://bucket-name/remote/file /path-to-local-destination
Replace
s3://bucket-name/remote/filewith the S3 object you want to download and/path-to-local-destinationwith the local directory where you want to save the file.List all the objects in the specified bucket and measure response time.
Syntax
time s3cmd ls s3://BUCKET_NAMEExample
time s3cmd ls s3://bucket-name
-
Analyze the output to calculate upload/download speed and measure response time based on the duration reported by the
timecommand.
Chapter 9. Ceph performance counters
As a storage administrator, you can gather performance metrics of the Red Hat Ceph Storage cluster. The Ceph performance counters are a collection of internal infrastructure metrics. The collection, aggregation, and graphing of this metric data can be done by an assortment of tools and can be useful for performance analytics.
9.1. Access to Ceph performance counters
The performance counters are available through a socket interface for the Ceph Monitors and the OSDs. The socket file for each respective daemon is located under /var/run/ceph, by default. The performance counters are grouped together into collection names. These collections names represent a subsystem or an instance of a subsystem.
Here is the full list of the Monitor and the OSD collection name categories with a brief description for each :
Monitor Collection Name Categories
- Cluster Metrics - Displays information about the storage cluster: Monitors, OSDs, Pools, and PGs
-
Level Database Metrics - Displays information about the back-end
KeyValueStoredatabase - Monitor Metrics - Displays general monitor information
- Paxos Metrics - Displays information on cluster quorum management
- Throttle Metrics - Displays the statistics on how the monitor is throttling
OSD Collection Name Categories
- Write Back Throttle Metrics - Displays the statistics on how the write back throttle is tracking unflushed IO
-
Level Database Metrics - Displays information about the back-end
KeyValueStoredatabase - Objecter Metrics - Displays information on various object-based operations
- Read and Write Operations Metrics - Displays information on various read and write operations
- Recovery State Metrics - Displays - Displays latencies on various recovery states
- OSD Throttle Metrics - Display the statistics on how the OSD is throttling
RADOS Gateway Collection Name Categories
- Object Gateway Client Metrics - Displays statistics on GET and PUT requests
- Objecter Metrics - Displays information on various object-based operations
- Object Gateway Throttle Metrics - Display the statistics on how the OSD is throttling
9.2. Display the Ceph performance counters
The ceph daemon DAEMON_NAME perf schema command outputs the available metrics. Each metric has an associated bit field value type.
Prerequisites
- A running Red Hat Ceph Storage cluster.
- Root-level access to the node.
Procedure
To view the metric’s schema:
Synatx
ceph daemon DAEMON_NAME perf schemaNoteYou must run the
ceph daemoncommand from the node running the daemon.Executing
ceph daemon DAEMON_NAME perf schemacommand from the monitor node:Example
[ceph: root@host01 /]# ceph daemon mon.host01 perf schema
Executing the
ceph daemon DAEMON_NAME perf schemacommand from the OSD node:Example
[ceph: root@host01 /]# ceph daemon osd.11 perf schema
Table 9.1. The bit field value definitions
| Bit | Meaning |
|---|---|
|
|
|
|
|
|
|
|
|
|
|
|
Each value will have bit 1 or 2 set to indicate the type, either a floating point or an integer value. When bit 4 is set, there will be two values to read, a sum and a count. When bit 8 is set, the average for the previous interval would be the sum delta, since the previous read, divided by the count delta. Alternatively, dividing the values outright would provide the lifetime average value. Typically these are used to measure latencies, the number of requests and a sum of request latencies. Some bit values are combined, for example 5, 6 and 10. A bit value of 5 is a combination of bit 1 and bit 4. This means the average will be a floating point value. A bit value of 6 is a combination of bit 2 and bit 4. This means the average value will be an integer. A bit value of 10 is a combination of bit 2 and bit 8. This means the counter value will be an integer value.
Additional Resources
- See Average count and sum section in the Red Hat Ceph Storage Administration Guide for more details.
9.3. Dump the Ceph performance counters
The ceph daemon .. perf dump command outputs the current values and groups the metrics under the collection name for each subsystem.
Prerequisites
- A running Red Hat Ceph Storage cluster.
- Root-level access to the node.
Procedure
To view the current metric data:
Syntax
ceph daemon DAEMON_NAME perf dumpNoteYou must run the
ceph daemoncommand from the node running the daemon.Executing
ceph daemon .. perf dumpcommand from the Monitor node:[ceph: root@host01 /]# ceph daemon mon.host01 perf dump
Executing the
ceph daemon .. perf dumpcommand from the OSD node:[ceph: root@host01 /]# ceph daemon osd.11 perf dump
Additional Resources
- To view a short description of each Monitor metric available, please see the Ceph monitor metrics table.
9.4. Average count and sum
All latency numbers have a bit field value of 5. This field contains floating point values for the average count and sum. The avgcount is the number of operations within this range and the sum is the total latency in seconds. When dividing the sum by the avgcount this will provide you with an idea of the latency per operation.
Additional Resources
- To view a short description of each OSD metric available, please see the Ceph OSD table.
9.5. Ceph Monitor metrics
Table 9.2. Cluster Metrics Table
| Collection Name | Metric Name | Bit Field Value | Short Description |
|---|---|---|---|
|
|
| 2 | Number of monitors |
|
| 2 | Number of monitors in quorum | |
|
| 2 | Total number of OSD | |
|
| 2 | Number of OSDs that are up | |
|
| 2 | Number of OSDs that are in cluster | |
|
| 2 | Current epoch of OSD map | |
|
| 2 | Total capacity of cluster in bytes | |
|
| 2 | Number of used bytes on cluster | |
|
| 2 | Number of available bytes on cluster | |
|
| 2 | Number of pools | |
|
| 2 | Total number of placement groups | |
|
| 2 | Number of placement groups in active+clean state | |
|
| 2 | Number of placement groups in active state | |
|
| 2 | Number of placement groups in peering state | |
|
| 2 | Total number of objects on cluster | |
|
| 2 | Number of degraded (missing replicas) objects | |
|
| 2 | Number of misplaced (wrong location in the cluster) objects | |
|
| 2 | Number of unfound objects | |
|
| 2 | Total number of bytes of all objects | |
|
| 2 | Number of MDSs that are up | |
|
| 2 | Number of MDS that are in cluster | |
|
| 2 | Number of failed MDS | |
|
| 2 | Current epoch of MDS map |
Table 9.3. Level Database Metrics Table
| Collection Name | Metric Name | Bit Field Value | Short Description |
|---|---|---|---|
|
|
| 10 | Gets |
|
| 10 | Transactions | |
|
| 10 | Compactions | |
|
| 10 | Compactions by range | |
|
| 10 | Mergings of ranges in compaction queue | |
|
| 2 | Length of compaction queue |
Table 9.4. General Monitor Metrics Table
| Collection Name | Metric Name | Bit Field Value | Short Description |
|---|---|---|---|
|
|
| 2 | Current number of opened monitor sessions |
|
| 10 | Number of created monitor sessions | |
|
| 10 | Number of remove_session calls in monitor | |
|
| 10 | Number of trimed monitor sessions | |
|
| 10 | Number of elections monitor took part in | |
|
| 10 | Number of elections started by monitor | |
|
| 10 | Number of elections won by monitor | |
|
| 10 | Number of elections lost by monitor |
Table 9.5. Paxos Metrics Table
| Collection Name | Metric Name | Bit Field Value | Short Description |
|---|---|---|---|
|
|
| 10 | Starts in leader role |
|
| 10 | Starts in peon role | |
|
| 10 | Restarts | |
|
| 10 | Refreshes | |
|
| 5 | Refresh latency | |
|
| 10 | Started and handled begins | |
|
| 6 | Keys in transaction on begin | |
|
| 6 | Data in transaction on begin | |
|
| 5 | Latency of begin operation | |
|
| 10 | Commits | |
|
| 6 | Keys in transaction on commit | |
|
| 6 | Data in transaction on commit | |
|
| 5 | Commit latency | |
|
| 10 | Peon collects | |
|
| 6 | Keys in transaction on peon collect | |
|
| 6 | Data in transaction on peon collect | |
|
| 5 | Peon collect latency | |
|
| 10 | Uncommitted values in started and handled collects | |
|
| 10 | Collect timeouts | |
|
| 10 | Accept timeouts | |
|
| 10 | Lease acknowledgement timeouts | |
|
| 10 | Lease timeouts | |
|
| 10 | Store a shared state on disk | |
|
| 6 | Keys in transaction in stored state | |
|
| 6 | Data in transaction in stored state | |
|
| 5 | Storing state latency | |
|
| 10 | Sharings of state | |
|
| 6 | Keys in shared state | |
|
| 6 | Data in shared state | |
|
| 10 | New proposal number queries | |
|
| 5 | New proposal number getting latency |
Table 9.6. Throttle Metrics Table
| Collection Name | Metric Name | Bit Field Value | Short Description |
|---|---|---|---|
|
|
| 10 | Currently available throttle |
|
| 10 | Max value for throttle | |
|
| 10 | Gets | |
|
| 10 | Got data | |
|
| 10 | Get blocked during get_or_fail | |
|
| 10 | Successful get during get_or_fail | |
|
| 10 | Takes | |
|
| 10 | Taken data | |
|
| 10 | Puts | |
|
| 10 | Put data | |
|
| 5 | Waiting latency |
9.6. Ceph OSD metrics
Table 9.7. Write Back Throttle Metrics Table
| Collection Name | Metric Name | Bit Field Value | Short Description |
|---|---|---|---|
|
|
| 2 | Dirty data |
|
| 2 | Written data | |
|
| 2 | Dirty operations | |
|
| 2 | Written operations | |
|
| 2 | Entries waiting for write | |
|
| 2 | Written entries |
Table 9.8. Level Database Metrics Table
| Collection Name | Metric Name | Bit Field Value | Short Description |
|---|---|---|---|
|
|
| 10 | Gets |
|
| 10 | Transactions | |
|
| 10 | Compactions | |
|
| 10 | Compactions by range | |
|
| 10 | Mergings of ranges in compaction queue | |
|
| 2 | Length of compaction queue |
Table 9.9. Objecter Metrics Table
| Collection Name | Metric Name | Bit Field Value | Short Description |
|---|---|---|---|
|
|
| 2 | Active operations |
|
| 2 | Laggy operations | |
|
| 10 | Sent operations | |
|
| 10 | Sent data | |
|
| 10 | Resent operations | |
|
| 10 | Commit callbacks | |
|
| 10 | Operation commits | |
|
| 10 | Operation | |
|
| 10 | Read operations | |
|
| 10 | Write operations | |
|
| 10 | Read-modify-write operations | |
|
| 10 | PG operation | |
|
| 10 | Stat operations | |
|
| 10 | Create object operations | |
|
| 10 | Read operations | |
|
| 10 | Write operations | |
|
| 10 | Write full object operations | |
|
| 10 | Append operation | |
|
| 10 | Set object to zero operations | |
|
| 10 | Truncate object operations | |
|
| 10 | Delete object operations | |
|
| 10 | Map extent operations | |
|
| 10 | Sparse read operations | |
|
| 10 | Clone range operations | |
|
| 10 | Get xattr operations | |
|
| 10 | Set xattr operations | |
|
| 10 | Xattr comparison operations | |
|
| 10 | Remove xattr operations | |
|
| 10 | Reset xattr operations | |
|
| 10 | TMAP update operations | |
|
| 10 | TMAP put operations | |
|
| 10 | TMAP get operations | |
|
| 10 | Call (execute) operations | |
|
| 10 | Watch by object operations | |
|
| 10 | Notify about object operations | |
|
| 10 | Extended attribute comparison in multi operations | |
|
| 10 | Other operations | |
|
| 2 | Active lingering operations | |
|
| 10 | Sent lingering operations | |
|
| 10 | Resent lingering operations | |
|
| 10 | Sent pings to lingering operations | |
|
| 2 | Active pool operations | |
|
| 10 | Sent pool operations | |
|
| 10 | Resent pool operations | |
|
| 2 | Active get pool stat operations | |
|
| 10 | Pool stat operations sent | |
|
| 10 | Resent pool stats | |
|
| 2 | Statfs operations | |
|
| 10 | Sent FS stats | |
|
| 10 | Resent FS stats | |
|
| 2 | Active commands | |
|
| 10 | Sent commands | |
|
| 10 | Resent commands | |
|
| 2 | OSD map epoch | |
|
| 10 | Full OSD maps received | |
|
| 10 | Incremental OSD maps received | |
|
| 2 | Open sessions | |
|
| 10 | Sessions opened | |
|
| 10 | Sessions closed | |
|
| 2 | Laggy OSD sessions |
Table 9.10. Read and Write Operations Metrics Table
| Collection Name | Metric Name | Bit Field Value | Short Description |
|---|---|---|---|
|
|
| 2 | Replication operations currently being processed (primary) |
|
| 10 | Client operations total write size | |
|
| 10 | Client operations total read size | |
|
| 5 | Latency of client operations (including queue time) | |
|
| 5 | Latency of client operations (excluding queue time) | |
|
| 10 | Client read operations | |
|
| 10 | Client data read | |
|
| 5 | Latency of read operation (including queue time) | |
|
| 5 | Latency of read operation (excluding queue time) | |
|
| 10 | Client write operations | |
|
| 10 | Client data written | |
|
| 5 | Client write operation readable/applied latency | |
|
| 5 | Latency of write operation (including queue time) | |
|
| 5 | Latency of write operation (excluding queue time) | |
|
| 10 | Client read-modify-write operations | |
|
| 10 | Client read-modify-write operations write in | |
|
| 10 | Client read-modify-write operations read out | |
|
| 5 | Client read-modify-write operation readable/applied latency | |
|
| 5 | Latency of read-modify-write operation (including queue time) | |
|
| 5 | Latency of read-modify-write operation (excluding queue time) | |
|
| 10 | Suboperations | |
|
| 10 | Suboperations total size | |
|
| 5 | Suboperations latency | |
|
| 10 | Replicated writes | |
|
| 10 | Replicated written data size | |
|
| 5 | Replicated writes latency | |
|
| 10 | Suboperations pull requests | |
|
| 5 | Suboperations pull latency | |
|
| 10 | Suboperations push messages | |
|
| 10 | Suboperations pushed size | |
|
| 5 | Suboperations push latency | |
|
| 10 | Pull requests sent | |
|
| 10 | Push messages sent | |
|
| 10 | Pushed size | |
|
| 10 | Inbound push messages | |
|
| 10 | Inbound pushed size | |
|
| 10 | Started recovery operations | |
|
| 2 | CPU load | |
|
| 2 | Total allocated buffer size | |
|
| 2 | Placement groups | |
|
| 2 | Placement groups for which this osd is primary | |
|
| 2 | Placement groups for which this osd is replica | |
|
| 2 | Placement groups ready to be deleted from this osd | |
|
| 2 | Heartbeat (ping) peers we send to | |
|
| 2 | Heartbeat (ping) peers we recv from | |
|
| 10 | OSD map messages | |
|
| 10 | OSD map epochs | |
|
| 10 | OSD map duplicates | |
|
| 2 | OSD size | |
|
| 2 | Used space | |
|
| 2 | Available space | |
|
| 10 | Rados 'copy-from' operations | |
|
| 10 | Tier promotions | |
|
| 10 | Tier flushes | |
|
| 10 | Failed tier flushes | |
|
| 10 | Tier flush attempts | |
|
| 10 | Failed tier flush attempts | |
|
| 10 | Tier evictions | |
|
| 10 | Tier whiteouts | |
|
| 10 | Dirty tier flag set | |
|
| 10 | Dirty tier flag cleaned | |
|
| 10 | Tier delays (agent waiting) | |
|
| 10 | Tier proxy reads | |
|
| 10 | Tiering agent wake up | |
|
| 10 | Objects skipped by agent | |
|
| 10 | Tiering agent flushes | |
|
| 10 | Tiering agent evictions | |
|
| 10 | Object context cache hits | |
|
| 10 | Object context cache lookups | |
|
| 2 | Number of clients blocklisted |
Table 9.11. Recovery State Metrics Table
| Collection Name | Metric Name | Bit Field Value | Short Description |
|---|---|---|---|
|
|
| 5 | Initial recovery state latency |
|
| 5 | Started recovery state latency | |
|
| 5 | Reset recovery state latency | |
|
| 5 | Start recovery state latency | |
|
| 5 | Primary recovery state latency | |
|
| 5 | Peering recovery state latency | |
|
| 5 | Backfilling recovery state latency | |
|
| 5 | Wait remote backfill reserved recovery state latency | |
|
| 5 | Wait local backfill reserved recovery state latency | |
|
| 5 | Notbackfilling recovery state latency | |
|
| 5 | Repnotrecovering recovery state latency | |
|
| 5 | Rep wait recovery reserved recovery state latency | |
|
| 5 | Rep wait backfill reserved recovery state latency | |
|
| 5 | RepRecovering recovery state latency | |
|
| 5 | Activating recovery state latency | |
|
| 5 | Wait local recovery reserved recovery state latency | |
|
| 5 | Wait remote recovery reserved recovery state latency | |
|
| 5 | Recovering recovery state latency | |
|
| 5 | Recovered recovery state latency | |
|
| 5 | Clean recovery state latency | |
|
| 5 | Active recovery state latency | |
|
| 5 | Replicaactive recovery state latency | |
|
| 5 | Stray recovery state latency | |
|
| 5 | Getinfo recovery state latency | |
|
| 5 | Getlog recovery state latency | |
|
| 5 | Waitactingchange recovery state latency | |
|
| 5 | Incomplete recovery state latency | |
|
| 5 | Getmissing recovery state latency | |
|
| 5 | Waitupthru recovery state latency |
Table 9.12. OSD Throttle Metrics Table
| Collection Name | Metric Name | Bit Field Value | Short Description |
|---|---|---|---|
|
|
| 10 | Currently available throttle |
|
| 10 | Max value for throttle | |
|
| 10 | Gets | |
|
| 10 | Got data | |
|
| 10 | Get blocked during get_or_fail | |
|
| 10 | Successful get during get_or_fail | |
|
| 10 | Takes | |
|
| 10 | Taken data | |
|
| 10 | Puts | |
|
| 10 | Put data | |
|
| 5 | Waiting latency |
9.7. Ceph Object Gateway metrics
Table 9.13. Ceph Object Gateway Client Metrics Table
| Collection Name | Metric Name | Bit Field Value | Short Description |
|---|---|---|---|
|
|
| 10 | Requests |
|
| 10 | Aborted requests | |
|
| 10 | Gets | |
|
| 10 | Size of gets | |
|
| 5 | Get latency | |
|
| 10 | Puts | |
|
| 10 | Size of puts | |
|
| 5 | Put latency | |
|
| 2 | Queue length | |
|
| 2 | Active requests queue | |
|
| 10 | Cache hits | |
|
| 10 | Cache miss | |
|
| 10 | Keystone token cache hits | |
|
| 10 | Keystone token cache miss |
Table 9.14. Objecter Metrics Table
| Collection Name | Metric Name | Bit Field Value | Short Description |
|---|---|---|---|
|
|
| 2 | Active operations |
|
| 2 | Laggy operations | |
|
| 10 | Sent operations | |
|
| 10 | Sent data | |
|
| 10 | Resent operations | |
|
| 10 | Commit callbacks | |
|
| 10 | Operation commits | |
|
| 10 | Operation | |
|
| 10 | Read operations | |
|
| 10 | Write operations | |
|
| 10 | Read-modify-write operations | |
|
| 10 | PG operation | |
|
| 10 | Stat operations | |
|
| 10 | Create object operations | |
|
| 10 | Read operations | |
|
| 10 | Write operations | |
|
| 10 | Write full object operations | |
|
| 10 | Append operation | |
|
| 10 | Set object to zero operations | |
|
| 10 | Truncate object operations | |
|
| 10 | Delete object operations | |
|
| 10 | Map extent operations | |
|
| 10 | Sparse read operations | |
|
| 10 | Clone range operations | |
|
| 10 | Get xattr operations | |
|
| 10 | Set xattr operations | |
|
| 10 | Xattr comparison operations | |
|
| 10 | Remove xattr operations | |
|
| 10 | Reset xattr operations | |
|
| 10 | TMAP update operations | |
|
| 10 | TMAP put operations | |
|
| 10 | TMAP get operations | |
|
| 10 | Call (execute) operations | |
|
| 10 | Watch by object operations | |
|
| 10 | Notify about object operations | |
|
| 10 | Extended attribute comparison in multi operations | |
|
| 10 | Other operations | |
|
| 2 | Active lingering operations | |
|
| 10 | Sent lingering operations | |
|
| 10 | Resent lingering operations | |
|
| 10 | Sent pings to lingering operations | |
|
| 2 | Active pool operations | |
|
| 10 | Sent pool operations | |
|
| 10 | Resent pool operations | |
|
| 2 | Active get pool stat operations | |
|
| 10 | Pool stat operations sent | |
|
| 10 | Resent pool stats | |
|
| 2 | Statfs operations | |
|
| 10 | Sent FS stats | |
|
| 10 | Resent FS stats | |
|
| 2 | Active commands | |
|
| 10 | Sent commands | |
|
| 10 | Resent commands | |
|
| 2 | OSD map epoch | |
|
| 10 | Full OSD maps received | |
|
| 10 | Incremental OSD maps received | |
|
| 2 | Open sessions | |
|
| 10 | Sessions opened | |
|
| 10 | Sessions closed | |
|
| 2 | Laggy OSD sessions |
Table 9.15. Ceph Object Gateway Throttle Metrics Table
| Collection Name | Metric Name | Bit Field Value | Short Description |
|---|---|---|---|
|
|
| 10 | Currently available throttle |
|
| 10 | Max value for throttle | |
|
| 10 | Gets | |
|
| 10 | Got data | |
|
| 10 | Get blocked during get_or_fail | |
|
| 10 | Successful get during get_or_fail | |
|
| 10 | Takes | |
|
| 10 | Taken data | |
|
| 10 | Puts | |
|
| 10 | Put data | |
|
| 5 | Waiting latency |
Chapter 10. The mClock OSD scheduler
As a storage administrator, you can implement the Red Hat Ceph Storage’s quality of service (QoS) using mClock queueing scheduler. This is based on an adaptation of the mClock algorithm called dmClock.
The mClock OSD scheduler provides the desired QoS using configuration profiles to allocate proper reservation, weight, and limit tags to the service types.
The mClock OSD scheduler performs the QoS calculations for the different device types, that is SSD or HDD, by using the OSD’s IOPS capability (determined automatically) and maximum sequential bandwidth capability (See osd_mclock_max_sequential_bandwidth_hdd and osd_mclock_max_sequential_bandwidth_ssd in The mclock configuration options section).
10.1. Comparison of mClock OSD scheduler with WPQ OSD scheduler
The mClock OSD scheduler replaces the Weighted Priority Queue (WPQ) OSD scheduler as a default scheduler in Red Hat Ceph Storage 6.1.
The mClock scheduler is supported for BlueStore OSDs.
The WPQ OSD scheduler features a strict sub-queue, which is de-queued before the normal queue. The WPQ removes operations from a queue in relation to their priorities to prevent depletion of any queue. This helps in cases where some Ceph OSDs are more overloaded than others.
The mClock OSD scheduler currently features an immediate queue, into which operations that require immediate response are queued. The immediate queue is not handled by mClock and functions as a simple first in, first out queue and is given the first priority.
Operations, such as OSD replication operations, OSD operation replies, peering, recoveries marked with the highest priority, and so forth, are queued into the immediate queue. All other operations are enqueued into the mClock queue that works according to the mClock algorithm.
The mClock queue, mclock_scheduler, prioritizes operations based on which bucket they belong to, that is pg recovery, pg scrub, snap trim, client op, and pg deletion.
With background operations in progress, the average client throughputs, that is the input and output operations per second (IOPS), are significantly higher and latencies are lower with the mClock profiles when compared to the WPQ scheduler. That is because of mClock’s effective allocation of the QoS parameters.
Additional Resources
- See the mClock profiles section for more information.
10.2. The allocation of input and output resources
This section describes how the QoS controls work internally with reservation, limit, and weight allocation. The user is not expected to set these controls as the mClock profiles automatically set them. Tuning these controls can only be performed using the available mClock profiles.
The dmClock algorithm allocates the input and output (I/O) resources of the Ceph cluster in proportion to weights. It implements the constraints of minimum reservation and maximum limitation to ensure the services can compete for the resources fairly.
Currently, the mclock_scheduler operation queue divides Ceph services involving I/O resources into following buckets:
-
client op: the input and output operations per second (IOPS) issued by a client. -
pg deletion: the IOPS issued by primary Ceph OSD. -
snap trim: the snapshot trimming-related requests. -
pg recovery: the recovery-related requests. -
pg scrub: the scrub-related requests.
The resources are partitioned using the following three sets of tags, meaning that the share of each type of service is controlled by these three tags:
- Reservation
- Limit
- Weight
Reservation
The minimum IOPS allocated for the service. The more reservation a service has, the more resources it is guaranteed to possess, as long as it requires so.
For example, a service with the reservation set to 0.1 (or 10%) always has 10% of the OSD’s IOPS capacity allocated for itself. Therefore, even if the clients start to issue large amounts of I/O requests, they do not exhaust all the I/O resources and the service’s operations are not depleted even in a cluster with high load.
Limit
The maximum IOPS allocated for the service. The service does not get more than the set number of requests per second serviced, even if it requires so and no other services are competing with it. If a service crosses the enforced limit, the operation remains in the operation queue until the limit is restored.
If the value is set to 0 (disabled), the service is not restricted by the limit setting and it can use all the resources if there is no other competing operation. This is represented as "MAX" in the mClock profiles.
The reservation and limit parameter allocations are per-shard, based on the type of backing device, that is HDD or SSD, under the Ceph OSD. See OSD Object storage daemon configuration options for more details about osd_op_num_shards_hdd and osd_op_num_shards_ssd parameters.
Weight
The proportional share of capacity if extra capacity or system is not enough. The service can use a larger portion of the I/O resource, if its weight is higher than its competitor’s.
The reservation and limit values for a service are specified in terms of a proportion of the total IOPS capacity of the OSD. The proportion is represented as a percentage in the mClock profiles. The weight does not have a unit. The weights are relative to one another, so if one class of requests has a weight of 9 and another a weight of 1, then the requests are performed at a 9 to 1 ratio. However, that only happens once the reservations are met and those values include the operations performed under the reservation phase.
If the weight is set to W, then for a given class of requests the next one that enters has a weight tag of 1/W and the previous weight tag, or the current time, whichever is larger. That means, if W is too large and thus 1/W is too small, the calculated tag might never be assigned as it gets a value of the current time.
Therefore, values for weight should be always under the number of requests expected to be serviced each second.
10.3. Factors that impact mClock operation queues
There are three factors that can reduce the impact of the mClock operation queues within Red Hat Ceph Storage:
- The number of shards for client operations.
- The number of operations in the operation sequencer.
- The usage of distributed system for Ceph OSDs
The number of shards for client operations
Requests to a Ceph OSD are sharded by their placement group identifier. Each shard has its own mClock queue and these queues neither interact, nor share information amongst them.
The number of shards can be controlled with these configuration options:
-
osd_op_num_shards -
osd_op_num_shards_hdd -
osd_op_num_shards_ssd
A lower number of shards increase the impact of the mClock queues, but might have other damaging effects.
Use the default number of shards as defined by the configuration options osd_op_num_shards, osd_op_num_shards_hdd, and osd_op_num_shards_ssd.
The number of operations in the operation sequencer
Requests are transferred from the operation queue to the operation sequencer, in which they are processed. The mClock scheduler is located in the operation queue. It determines which operation to transfer to the operation sequencer.
The number of operations allowed in the operation sequencer is a complex issue. The aim is to keep enough operations in the operation sequencer so it always works on some, while it waits for disk and network access to complete other operations.
However, mClock no longer has control over an operation that is transferred to the operation sequencer. Therefore, to maximize the impact of mClock, the goal is also to keep as few operations in the operation sequencer as possible.
The configuration options that influence the number of operations in the operation sequencer are:
-
bluestore_throttle_bytes -
bluestore_throttle_deferred_bytes -
bluestore_throttle_cost_per_io -
bluestore_throttle_cost_per_io_hdd -
bluestore_throttle_cost_per_io_ssd
Use the default values as defined by the bluestore_throttle_bytes and bluestore_throttle_deferred_bytes options. However, these options can be determined during the benchmarking phase.
The usage of distributed system for Ceph OSDs
The third factor that affects the impact of the mClock algorithm is the usage of a distributed system, where requests are made to multiple Ceph OSDs, and each Ceph OSD can have multiple shards. However, Red Hat Ceph Storage currently uses the mClock algorithm, which is not a distributed version of mClock.
dmClock is the distributed version of mClock.
Additional Resources
-
See Object Storage Daemon (OSD) configuration options for more details about
osd_op_num_shards_hddandosd_op_num_shards_ssdparameters. - See BlueStore configuration options for more details about BlueStore throttle parameters.
- See Manually benchmarking OSDs for more information.
10.4. The mClock configuration
To make the mClock more user-friendly and intuitive, the mClock configuration profiles are introduced in Red Hat Ceph Storage 6. The mClock profiles hide the low-level details from users, making it easier to configure and use mClock.
The following input parameters are required for an mClock profile to configure the quality of service (QoS) related parameters:
- The total capacity of input and output operations per second (IOPS) for each Ceph OSD. This is determined automatically.
-
The maximum sequential bandwidth capacity (MiB/s) of each OS. See
osd_mclock_max_sequential_bandwidth_[hdd/ssd]option -
An mClock profile type to be enabled. The default is
balanced.
Using the settings in the specified profile, a Ceph OSD determines and applies the lower-level mClock and Ceph parameters. The parameters applied by the mClock profile make it possible to tune the QoS between the client I/O and background operations in the OSD.
Additional Resources
- See The Ceph OSD capacity determination for more information about the automated OSD capacity determination.
10.5. mClock clients
The mClock scheduler handles requests from different types of Ceph services. Each service is considered by mClock as a type of client. Depending on the type of requests handled, mClock clients are classified into the buckets:
- Client - Handles input and output (I/O) requests issued by external clients of Ceph.
- Background recovery - Handles internal recovery requests.
- Background best-effort - Handles internal backfill, scrub, snap trim, and placement group (PG) deletion requests.
The mClock scheduler derives the cost of an operation used in the QoS calculations from osd_mclock_max_capacity_iops_hdd | osd_mclock_max_capacity_iops_ssd, osd_mclock_max_sequential_bandwidth_hdd | osd_mclock_max_sequential_bandwidth_ssd and osd_op_num_shards_hdd | osd_op_num_shards_ssd parameters.
10.6. mClock profiles
An mClock profile is a configuration setting. When applied to a running Red Hat Ceph Storage cluster, it enables the throttling of the IOPS operations belonging to different client classes, such as background recovery, scrub, snap trim, client op, and pg deletion.
The mClock profile uses the capacity limits and the mClock profile type selected by the user to determine the low-level mClock resource control configuration parameters and applies them transparently. Other Red Hat Ceph Storage configuration parameters are also applied. The low-level mClock resource control parameters are the reservation, limit, and weight that provide control of the resource shares. The mClock profiles allocate these parameters differently for each client type.
10.6.1. mClock profile types
mClock profiles can be classified into built-in and custom profiles.
If any mClock profile is active, the following Red Hat Ceph Storage configuration sleep options get disabled, which means they are set to 0:
-
osd_recovery_sleep -
osd_recovery_sleep_hdd -
osd_recovery_sleep_ssd -
osd_recovery_sleep_hybrid -
osd_scrub_sleep -
osd_delete_sleep -
osd_delete_sleep_hdd -
osd_delete_sleep_ssd -
osd_delete_sleep_hybrid -
osd_snap_trim_sleep -
osd_snap_trim_sleep_hdd -
osd_snap_trim_sleep_ssd -
osd_snap_trim_sleep_hybrid
It is to ensure that mClock scheduler is able to determine when to pick the next operation from its operation queue and transfer it to the operation sequencer. This results in the desired QoS being provided across all its clients.
Custom profile
This profile gives users complete control over all the mClock configuration parameters. It should be used with caution and is meant for advanced users, who understand mClock and Red Hat Ceph Storage related configuration options.
Built-in profiles
When a built-in profile is enabled, the mClock scheduler calculates the low-level mClock parameters, that is, reservation, weight, and limit, based on the profile enabled for each client type.
The mClock parameters are calculated based on the maximum Ceph OSD capacity provided beforehand. Therefore, the following mClock configuration options cannot be modified when using any of the built-in profiles:
-
osd_mclock_scheduler_client_res -
osd_mclock_scheduler_client_wgt -
osd_mclock_scheduler_client_lim -
osd_mclock_scheduler_background_recovery_res -
osd_mclock_scheduler_background_recovery_wgt -
osd_mclock_scheduler_background_recovery_lim -
osd_mclock_scheduler_background_best_effort_res -
osd_mclock_scheduler_background_best_effort_wgt osd_mclock_scheduler_background_best_effort_limNoteThese defaults cannot be changed using any of the config subsystem commands like
config set,config daemonorconfig tellcommands. Although the above command(s) report success, the mclock QoS parameters are reverted to their respective built-in profile defaults.
The following recovery and backfill related Ceph options are overridden to mClock defaults:
Do not change these options as the built-in profiles are optimized based on them. Changing these defaults can result in unexpected performance outcomes.
-
osd_max_backfills -
osd_recovery_max_active -
osd_recovery_max_active_hdd -
osd_recovery_max_active_ssd
The following options show the mClock defaults which is same as the current defaults to maximize the performance of the foreground client operations:
osd_max_backfills- Original default
-
1 - mClock default
-
1
osd_recovery_max_active- Original default
-
0 - mClock default
-
0
osd_recovery_max_active_hdd- Original default
-
3 - mClock default
-
3
osd_recovery_max_active_sdd- Original default
-
10 - mClock default
-
10
The above mClock defaults can be modified, only if necessary, by enabling osd_mclock_override_recovery_settings that is by default set as false. See Modifying backfill and recovery options to modify these parameters.
Built-in profile types
Users can choose from the following built-in profile types:
-
balanced(default) -
high_client_ops -
high_recovery_ops
The values mentioned in the list below represent the proportion of the total IOPS capacity of the Ceph OSD allocated for the service type.
-
balanced:
The default mClock profile is set to balanced because it represents a compromise between prioritizing client IO or recovery IO. It allocates equal reservation or priority to client operations and background recovery operations. Background best-effort operations are given lower reservation and therefore take longer to complete when there are competing operations. This profile meets the normal or steady state requirements of the cluster which is the case when external client performance requirements is not critical and there are other background operations that still need attention within the OSD.
There might be instances that necessitate giving higher priority to either client operations or recovery operations. To meet such requirements you can choose either the high_client_ops profile to prioritize client IO or the high_recovery_ops profile to prioritize recovery IO. These profiles are discussed further below.
- Service type: client
- Reservation
- 50%
- Limit
- MAX
- Weight
-
1
- Service type: background recovery
- Reservation
- 50%
- Limit
- MAX
- Weight
-
1
- Service type: background best-effort
- Reservation
- MIN
- Limit
- 90%
- Weight
1-
high_client_ops
-
This profile optimizes client performance over background activities by allocating more reservation and limit to client operations as compared to background operations in the Ceph OSD. This profile, for example, can be enabled to provide the needed performance for I/O intensive applications for a sustained period of time at the cost of slower recoveries. The list below shows the resource control parameters set by the profile:
- Service type: client
- Reservation
- 60%
- Limit
- MAX
- Weight
-
2
- Service type: background recovery
- Reservation
- 40%
- Limit
- MAX
- Weight
-
1
- Service type: background best-effort
- Reservation
- MIN
- Limit
- 70%
- Weight
1-
high_recovery_ops
-
This profile optimizes background recovery performance as compared to external clients and other background operations within the Ceph OSD.
For example, it could be temporarily enabled by an administrator to accelerate background recoveries during non-peak hours. The list below shows the resource control parameters set by the profile:
- Service type: client
- Reservation
- 30%
- Limit
- MAX
- Weight
-
1
- Service type: background recovery
- Reservation
- 70%
- Limit
- MAX
- Weight
-
2
- Service type: background best-effort
- Reservation
- MIN
- Limit
- MAX
- Weight
-
1
Additional Resources
- See the The mClock configuration options for more information about mClock configuration options.
10.6.2. Changing an mClock profile
The default mClock profile is set to balanced. The other types of the built-in profile are high_client_ops and high_recovery_ops.
The custom profile is not recommended unless you are an advanced user.
Prerequisites
- A running Red Hat Ceph Storage cluster.
- Root-level access to the Ceph Monitor host.
Procedure
Log into the Cephadm shell:
Example
[root@host01 ~]# cephadm shell
Set the
osd_mclock_profileoption:Syntax
ceph config set osd.OSD_ID osd_mclock_profile VALUE
Example
[ceph: root@host01 /]# ceph config set osd.0 osd_mclock_profile high_recovery_ops
This example changes the profile to allow faster recoveries on
osd.0.NoteFor optimal performance the profile must be set on all Ceph OSDs by using the following command:
Syntax
ceph config set osd osd_mclock_profile VALUE
10.6.3. Switching between built-in and custom profiles
The following steps describe switching from built-in profile to custom profile and vice-versa.
You might want to switch to the custom profile if you want complete control over all the mClock configuration options. However, it is recommended not to use the custom profile unless you are an advanced user.
Prerequisites
- A running Red Hat Ceph Storage cluster.
- Root-level access to the Ceph Monitor host.
Switch from built-in profile to custom profile
Log into the Cephadm shell:
Example
[root@host01 ~]# cephadm shell
Switch to the custom profile:
Syntax
ceph config set osd.OSD_ID osd_mclock_profile customExample
[ceph: root@host01 /]# ceph config set osd.0 osd_mclock_profile custom
NoteFor optimal performance the profile must be set on all Ceph OSDs by using the following command:
Example
[ceph: root@host01 /]# ceph config set osd osd_mclock_profile custom
Optional: After switching to the custom profile, modify the desired mClock configuration options:
Syntax
ceph config set osd.OSD_ID MCLOCK_CONFIGURATION_OPTION VALUE
Example
[ceph: root@host01 /]# ceph config set osd.0 osd_mclock_scheduler_client_res 0.5
This example changes the client reservation IOPS ratio for a specific OSD
osd.0to 0.5 (50%)ImportantChange the reservations of other services, such as background recovery and background best-effort accordingly to ensure that the sum of the reservations does not exceed the maximum proportion (1.0) of the IOPS capacity of the OSD.
Switch from custom profile to built-in profile
Log into the cephadm shell:
Example
[root@host01 ~]# cephadm shell
Set the desired built-in profile:
Syntax
ceph config set osd osd_mclock_profile MCLOCK_PROFILEExample
[ceph: root@host01 /]# ceph config set osd osd_mclock_profile high_client_ops
This example sets the built-in profile to
high_client_opson all Ceph OSDs.Determine the existing custom mClock configuration settings in the database:
Example
[ceph: root@host01 /]# ceph config dump
Remove the custom mClock configuration settings determined earlier:
Syntax
ceph config rm osd MCLOCK_CONFIGURATION_OPTIONExample
[ceph: root@host01 /]# ceph config rm osd osd_mclock_scheduler_client_res
This example removes the configuration option
osd_mclock_scheduler_client_resthat was set on all Ceph OSDs.After all existing custom mClock configuration settings are removed from the central configuration database, the configuration settings related to
high_client_opsare applied.Verify the settings on Ceph OSDs:
Syntax
ceph config show osd.OSD_IDExample
[ceph: root@host01 /]# ceph config show osd.0
Additional Resources
- See mClock profile types for the list of the mClock configuration options that cannot be modified with built-in profiles.
10.6.4. Switching temporarily between mClock profiles
This section contains steps to temporarily switch between mClock profiles.
This section is for advanced users or for experimental testing. Do not use the below commands on a running storage cluster as it could have unexpected outcomes.
The configuration changes on a Ceph OSD using the below commands are temporary and are lost when the Ceph OSD is restarted.
The configuration options that are overridden using the commands described in this section cannot be modified further using the ceph config set osd.OSD_ID command. The changes do not take effect until a given Ceph OSD is restarted. This is intentional, as per the configuration subsystem design. However, any further modifications can still be made temporarily using these commands.
Prerequisites
- A running Red Hat Ceph Storage cluster.
- Root-level access to the Ceph Monitor host.
Procedure
Log into the Cephadm shell:
Example
[root@host01 ~]# cephadm shell
Run the following command to override the mClock settings:
Syntax
ceph tell osd.OSD_ID injectargs '--MCLOCK_CONFIGURATION_OPTION=VALUE'
Example
[ceph: root@host01 /]# ceph tell osd.0 injectargs '--osd_mclock_profile=high_recovery_ops'
This example overrides the
osd_mclock_profileoption onosd.0.Optional: You can use the alternative to the previous
ceph tell osd.OSD_ID injectargscommand:Syntax
ceph daemon osd.OSD_ID config set MCLOCK_CONFIGURATION_OPTION VALUE
Example
[ceph: root@host01 /]# ceph daemon osd.0 config set osd_mclock_profile high_recovery_ops
The individual QoS related configuration options for the custom profile can also be modified temporarily using the above commands.
10.6.5. Degraded and Misplaced Object Recovery Rate With mClock Profiles
Degraded object recovery is categorized into the background recovery bucket. Across all mClock profiles, degraded object recovery is given higher priority when compared to misplaced object recovery because degraded objects present a data safety issue not present with objects that are merely misplaced.
Backfill or the misplaced object recovery operation is categorized into the background best-effort bucket. According to the balanced and high_client_ops mClock profiles, background best-effort client is not constrained by reservation (set to zero) but is limited to use a fraction of the participating OSD’s capacity if there are no other competing services.
Therefore, with the balanced or high_client_ops profile and with other background competing services active, backfilling rates are expected to be slower when compared to the previous WeightedPriorityQueue (WPQ) scheduler.
If higher backfill rates are desired, please follow the steps mentioned in the section below.
Improving backfilling rates
For faster backfilling rate when using either balanced or high_client_ops profile, follow the below steps:
- Switch to the 'high_recovery_ops' mClock profile for the duration of the backfills. See Changing an mClock profile to achieve this. Once the backfilling phase is complete, switch the mClock profile to the previously active profile. In case there is no significant improvement in the backfilling rate with the 'high_recovery_ops' profile, continue to the next step.
- Switch the mClock profile back to the previously active profile.
-
Modify 'osd_max_backfills' to a higher value, for example,
3. See Modifying backfills and recovery options to achieve this. - Once the backfilling is complete, 'osd_max_backfills' can be reset to the default value of 1 by following the same procedure mentioned in step 3.
Please note that modifying osd_max_backfills may result in other operations, for example, client operations may experience higher latency during the backfilling phase. Therefore, users are recommended to increase osd_max_backfills in small increments to minimize performance impact to other operations in the cluster.
10.6.6. Modifying backfills and recovery options
Modify the backfills and recovery options with the ceph config set command.
The backfill or recovery options that can be modified are listed in mClock profile types.
This section is for advanced users or for experimental testing. Do not use the below commands on a running storage cluster as it could have unexpected outcomes.
Modify the values only for experimental testing, or if the cluster is unable to handle the values or it shows poor performance with the default settings.
The modification of the mClock default backfill or recovery options is restricted by the osd_mclock_override_recovery_settings option, which is set to false by default.
If you attempt to modify any default backfill or recovery options without setting osd_mclock_override_recovery_settings to true, it resets the options back to the mClock defaults along with a warning message logged in the cluster log.
Prerequisites
- A running Red Hat Ceph Storage cluster.
- Root-level access to the Ceph Monitor host.
Procedure
Log into the Cephadm shell:
Example
[root@host01 ~]# cephadm shell
Set the
osd_mclock_override_recovery_settingsconfiguration option totrueon all Ceph OSDs:Example
[ceph: root@host01 /]# ceph config set osd osd_mclock_override_recovery_settings true
Set the desired
backfillsorrecoveryoption:Syntax
ceph config set osd OPTION VALUE
Example
[ceph: root@host01 /]# ceph config set osd osd_max_backfills_ 5
Wait a few seconds and verify the configuration for the specific OSD:
Syntax
ceph config show osd.OSD_ID_ | grep OPTION
Example
[ceph: root@host01 /]# ceph config show osd.0 | grep osd_max_backfills
Reset the
osd_mclock_override_recovery_settingsconfiguration option tofalseon all OSDs:Example
[ceph: root@host01 /]# ceph config set osd osd_mclock_override_recovery_settings false
10.7. The Ceph OSD capacity determination
The Ceph OSD capacity in terms of total IOPS is determined automatically during the Ceph OSD initialization. This is achieved by running the Ceph OSD bench tool and overriding the default value of osd_mclock_max_capacity_iops_[hdd, ssd] option depending on the device type. No other action or input is expected from the user to set the Ceph OSD capacity.
Mitigation of unrealistic Ceph OSD capacity from the automated procedure
In certain conditions, the Ceph OSD bench tool might show unrealistic or inflated results depending on the drive configuration and other environment related conditions.
To mitigate the performance impact due to this unrealistic capacity, a couple of threshold configuration options depending on the OSD device type are defined and used:
-
osd_mclock_iops_capacity_threshold_hdd= 500 -
osd_mclock_iops_capacity_threshold_ssd= 80000
The following automated step is performed:
Fallback to using default OSD capacity
If the Ceph OSD bench tool reports a measurement that exceeds the above threshold values, the fallback mechanism reverts to the default value of osd_mclock_max_capacity_iops_hdd or osd_mclock_max_capacity_iops_ssd. The threshold configuration options can be reconfigured based on the type of drive used.
A cluster warning is logged in case the measurement exceeds the threshold:
Example
2022-10-27T15:30:23.270+0000 7f9b5dbe95c0  0 log_channel(cluster) log [WRN]
: OSD bench result of 39546.479392 IOPS exceeded the threshold limit of 25000.000000 IOPS for osd.1. IOPS capacity is unchanged at 21500.000000 IOPS. The recommendation is to establish the osd's IOPS capacity using other benchmark tools (e.g. Fio) and then override osd_mclock_max_capacity_iops_[hdd|ssd].
If the default capacity does not accurately represent the Ceph OSD capacity, it is highly recommended to run a custom benchmark using the preferred tool, for example Fio, on the drive and then override the osd_mclock_max_capacity_iops_[hdd, ssd] option as described in Specifying maximum OSD capacity.
Additional Resources
- See Manually benchmarking OSDs to manually benchmark Ceph OSDs or manually tune the BlueStore throttle parameters.
-
See The mClock configuration options for more information about the
osd_mclock_max_capacity_iops_[hdd, ssd]andosd_mclock_iops_capacity_threshold_[hdd, ssd]options.
10.7.1. Verifying the capacity of an OSD
You can verify the capacity of a Ceph OSD after setting up the storage cluster.
Prerequisites
- A running Red Hat Ceph Storage cluster.
- Root-level access to the Ceph Monitor host.
Procedure
Log into the Cephadm shell:
Example
[root@host01 ~]# cephadm shell
Verify the capacity of a Ceph OSD:
Syntax
ceph config show osd.OSD_ID osd_mclock_max_capacity_iops_[hdd, ssd]Example
[ceph: root@host01 /]# ceph config show osd.0 osd_mclock_max_capacity_iops_ssd

21500.000000
10.7.2. Manually benchmarking OSDs
To manually benchmark a Ceph OSD, any existing benchmarking tool, for example Fio, can be used. Regardless of the tool or command used, the steps below remain the same.
The number of shards and BlueStore throttle parameters have an impact on the mClock operation queues. Therefore, it is critical to set these values carefully in order to maximize the impact of the mclock scheduler. See Factors that impact mClock operation queues for more information about these values.
The steps in this section are only necessary if you want to override the Ceph OSD capacity determined automatically during the OSD initialization.
If you have already determined the benchmark data and wish to manually override the maximum OSD capacity for a Ceph OSD, skip to the Specifying maximum OSD capacity section.
Prerequisites
- A running Red Hat Ceph Storage cluster.
- Root-level access to the Ceph Monitor host.
Procedure
Log into the Cephadm shell:
Example
[root@host01 ~]# cephadm shell
Benchmark a Ceph OSD:
Syntax
ceph tell osd.OSD_ID bench [TOTAL_BYTES] [BYTES_PER_WRITE] [OBJ_SIZE] [NUM_OBJS]
where:
- TOTAL_BYTES: Total number of bytes to write.
- BYTES_PER_WRITE: Block size per write.
- OBJ_SIZE: Bytes per object.
- NUM_OBJS: Number of objects to write.
Example
[ceph: root@host01 /]# ceph tell osd.0 bench 12288000 4096 4194304 100
{
    "bytes_written": 12288000,
    "blocksize": 4096,
    "elapsed_sec": 1.3718913019999999,
    "bytes_per_sec": 8956977.8466311768,
    "iops": 2186.7621695876896
}
10.7.3. Determining the correct BlueStore throttle values
This optional section details the steps used to determine the correct BlueStore throttle values. The steps use the default shards.
Before running the test, clear the caches to get an accurate measurement. Clear the OSD caches between each benchmark run using the following command:
Syntax
ceph tell osd.OSD_ID cache drop
Example
[ceph: root@host01 /]# ceph tell osd.0 cache drop
Prerequisites
- A running Red Hat Ceph Storage cluster.
- Root-level access to the Ceph Monitor node hosting the OSDs that you wish to benchmark.
Procedure
Log into the Cephadm shell:
Example
[root@host01 ~]# cephadm shell
Run a simple 4KiB random write workload on an OSD:
Syntax
ceph tell osd.OSD_ID bench 12288000 4096 4194304 100Example
[ceph: root@host01 /]# ceph tell osd.0 bench 12288000 4096 4194304 100 { "bytes_written": 12288000, "blocksize": 4096, "elapsed_sec": 1.3718913019999999, "bytes_per_sec": 8956977.8466311768, "iops": 2186.7621695876896 1 }- 1
- The overall throughput obtained from the output of the
osd benchcommand. This value is the baseline throughput, when the default BlueStore throttle options are in effect.
- Note the overall throughput, that is IOPS, obtained from the output of the previous command.
If the intent is to determine the BlueStore throttle values for your environment, set
bluestore_throttle_bytesandbluestore_throttle_deferred_bytesoptions to 32 KiB, that is, 32768 Bytes:Syntax
ceph config set osd.OSD_ID bluestore_throttle_bytes 32768
ceph config set osd.OSD_ID bluestore_throttle_deferred_bytes 32768
Example
[ceph: root@host01 /]# ceph config set osd.0 bluestore_throttle_bytes 32768
[ceph: root@host01 /]# ceph config set osd.0 bluestore_throttle_deferred_bytes 32768
Otherwise, you can skip to the next section Specifying maximum OSD capacity.
Run the 4KiB random write test as before using an OSD bench command:
Example
[ceph: root@host01 /]# ceph tell osd.0 bench 12288000 4096 4194304 100
- Notice the overall throughput from the output and compare the value against the baseline throughput recorded earlier.
- If the throughput does not match with the baseline, increase the BlueStore throttle options by multiplying by 2.
- Repeat the steps by running the 4KiB random write test, comparing the value against the baseline throughput, and increasing the BlueStore throttle options by multiplying by 2, until the obtained throughput is very close to the baseline value.
For example, during benchmarking on a machine with NVMe SSDs, a value of 256 KiB for both BlueStore throttle and deferred bytes was determined to maximize the impact of mClock. For HDDs, the corresponding value was 40 MiB, where the overall throughput was roughly equal to the baseline throughput.
In general for HDDs, the BlueStore throttle values are expected to be higher when compared to SSDs.
10.7.4. Specifying maximum OSD capacity
You can override the maximum Ceph OSD capacity automatically set during OSD initialization.
These steps are optional. Perform the following steps if the default capacity does not accurately represent the Ceph OSD capacity.
Ensure that you determine the benchmark data first, as described in Manually benchmarking OSDs.
Prerequisites
- A running Red Hat Ceph Storage cluster.
- Root-level access to the Ceph Monitor host.
Procedure
Log into the Cephadm shell:
Example
[root@host01 ~]# cephadm shell
Set
osd_mclock_max_capacity_iops_[hdd, ssd]option for an OSD:Syntax
ceph config set osd.OSD_ID osd_mclock_max_capacity_iops_[hdd,ssd] VALUE
Example
[ceph: root@host01 /]# ceph config set osd.0 osd_mclock_max_capacity_iops_hdd 350
This example sets the maximum capacity for
osd.0, where an underlying device type is HDD, to 350 IOPS.
Chapter 11. BlueStore
BlueStore is the back-end object store for the OSD daemons and puts objects directly on the block device.
BlueStore provides a high-performance backend for OSD daemons in a production environment. By default, BlueStore is configured to be self-tuning. If you determine that your environment performs better with BlueStore tuned manually, please contact Red Hat support and share the details of your configuration to help us improve the auto-tuning capability. Red Hat looks forward to your feedback and appreciates your recommendations.
11.1. Ceph BlueStore
The following are some of the main features of using BlueStore:
- Direct management of storage devices
- BlueStore consumes raw block devices or partitions. This avoids any intervening layers of abstraction, such as local file systems like XFS, that might limit performance or add complexity.
- Metadata management with RocksDB
- BlueStore uses the RocksDB key-value database to manage internal metadata, such as the mapping from object names to block locations on a disk.
- Full data and metadata checksumming
- By default all data and metadata written to BlueStore is protected by one or more checksums. No data or metadata are read from disk or returned to the user without verification.
- Inline compression
- Data can be optionally compressed before being written to a disk.
- Efficient copy-on-write
- The Ceph Block Device and Ceph File System snapshots rely on a copy-on-write clone mechanism that is implemented efficiently in BlueStore. This results in efficient I/O both for regular snapshots and for erasure coded pools which rely on cloning to implement efficient two-phase commits.
- No large double-writes
- BlueStore first writes any new data to unallocated space on a block device, and then commits a RocksDB transaction that updates the object metadata to reference the new region of the disk. Only when the write operation is below a configurable size threshold, it falls back to a write-ahead journaling scheme.
- Multi-device support
- BlueStore can use multiple block devices for storing different data. For example: Hard Disk Drive (HDD) for the data, Solid-state Drive (SSD) for metadata, Non-volatile Memory (NVM) or Non-volatile random-access memory (NVRAM) or persistent memory for the RocksDB write-ahead log (WAL). See Ceph BlueStore devices for details.
- Efficient block device usage
- Because BlueStore does not use any file system, it minimizes the need to clear the storage device cache.
- Allocation metadata
-
Allocation metadata is no longer using the standalone objects in RocksDB as the allocation information can be deduced from the aggregate allocation state of all onodes in the system which are stored in the RocksDB already. BlueStore V3 code skips the RocksDB updates on allocation time and performs a full destage of the allocator object with all the OSD allocation state in a single step during
umount. This results in a 25% increase in IOPS and reduced latency in small random-write workloads; however, it prolongs the recovery time, usually by a few extra minutes, in failure cases where an umount is not called since you need to iterate over all onodes to recreate the allocation metadata. - Cache age binning
- Red Hat Ceph Storage associates items in the different caches with "age bins", which gives a view of the relative ages of all the cache items.
11.2. Ceph BlueStore devices
BlueStore manages either one, two, or three storage devices in the backend.
- Primary
- WAL
- DB
In the simplest case, BlueStore consumes a single primary storage device. The storage device is normally used as a whole, occupying the full device that is managed by BlueStore directly. The primary device is identified by a block symlink in the data directory.
The data directory is a tmpfs mount which gets populated with all the common OSD files that hold information about the OSD, like the identifier, which cluster it belongs to, and its private keyring.
The storage device is partitioned into two parts that contain:
- OSD metadata: A small partition formatted with XFS that contains basic metadata for the OSD. This data directory includes information about the OSD, such as its identifier, which cluster it belongs to, and its private keyring.
- Data: A large partition occupying the rest of the device that is managed directly by BlueStore and that contains all of the OSD data. This primary device is identified by a block symbolic link in the data directory.
You can also use two additional devices:
-
A WAL (write-ahead-log) device: A device that stores BlueStore internal journal or write-ahead log. It is identified by the
block.walsymbolic link in the data directory. Consider using a WAL device only if the device is faster than the primary device. For example, when the WAL device uses an SSD disk and the primary device uses an HDD disk. - A DB device: A device that stores BlueStore internal metadata. The embedded RocksDB database puts as much metadata as it can on the DB device instead of on the primary device to improve performance. If the DB device is full, it starts adding metadata to the primary device. Consider using a DB device only if the device is faster than the primary device.
If you have only less than a gigabyte storage available on fast devices, Red Hat recommends using it as a WAL device. If you have more fast devices available, consider using it as a DB device. The BlueStore journal is always placed on the fastest device, so using a DB device provides the same benefit that the WAL device while also allows for storing additional metadata.
11.3. Ceph BlueStore caching
The BlueStore cache is a collection of buffers that, depending on configuration, can be populated with data as the OSD daemon does reading from or writing to the disk. By default in Red Hat Ceph Storage, BlueStore will cache on reads, but not writes. This is because the bluestore_default_buffered_write option is set to false to avoid potential overhead associated with cache eviction.
If the bluestore_default_buffered_write option is set to true, data is written to the buffer first, and then committed to disk. Afterwards, a write acknowledgement is sent to the client, allowing subsequent reads faster access to the data already in cache, until that data is evicted.
Read-heavy workloads will not see an immediate benefit from BlueStore caching. As more reading is done, the cache will grow over time and subsequent reads will see an improvement in performance. How fast the cache populates depends on the BlueStore block and database disk type, and the client’s workload requirements.
Please contact Red Hat support before enabling the bluestore_default_buffered_write option.
Cache age binning
Red Hat Ceph Storage associates items in the different caches with "age bins", which gives a view of the relative ages of all the cache items. For example, when there are old onode entries sitting in the BlueStore onode cache, a hot read workload occurs against a single large object. The priority cache for that OSD sorts the older onode entries into a lower priority level than the buffer cache data for the hot object. Although Ceph might, in general, heavily favor onodes at a given priority level, in this hot workload scenario, older onodes might be assigned a lower priority level than the hot workload data, so that the buffer data memory request is fulfilled first.
11.4. Sizing considerations for Ceph BlueStore
When mixing traditional and solid state drives using BlueStore OSDs, it is important to size the RocksDB logical volume (block.db) appropriately. Red Hat recommends that the RocksDB logical volume be no less than 4% of the block size with object, file and mixed workloads. Red Hat supports 1% of the BlueStore block size with RocksDB and OpenStack block workloads. For example, if the block size is 1 TB for an object workload, then at a minimum, create a 40 GB RocksDB logical volume.
When not mixing drive types, there is no requirement to have a separate RocksDB logical volume. BlueStore will automatically manage the sizing of RocksDB.
BlueStore’s cache memory is used for the key-value pair metadata for RocksDB, BlueStore metadata, and object data.
The BlueStore cache memory values are in addition to the memory footprint already being consumed by the OSD.
11.5. Tuning Ceph BlueStore using bluestore_min_alloc_size parameter
This procedure is for new or freshly deployed OSDs.
In BlueStore, the raw partition is allocated and managed in chunks of bluestore_min_alloc_size. By default, bluestore_min_alloc_size is 4096, equivalent to 4 KiB for HDDs and SSDs. The unwritten area in each chunk is filled with zeroes when it is written to the raw partition. This can lead to wasted unused space when not properly sized for your workload, for example when writing small objects.
It is best practice to set bluestore_min_alloc_size to match the smallest write so this write amplification penalty can be avoided.
Changing the value of bluestore_min_alloc_size is not recommended. For any assistance, contact Red Hat support.
The settings bluestore_min_alloc_size_ssd and bluestore_min_alloc_size_hdd are specific to SSDs and HDDs, respectively, but setting them is not necessary because setting bluestore_min_alloc_size overrides them.
Prerequisites
- A running Red Hat Ceph Storage cluster.
- Ceph monitors and managers are deployed in the cluster.
- Servers or nodes that can be freshly provisioned as OSD nodes
- The admin keyring for the Ceph Monitor node, if you are redeploying an existing Ceph OSD node.
Procedure
On the bootstrapped node, change the value of
bluestore_min_alloc_sizeparameter:Syntax
ceph config set osd.OSD_ID bluestore_min_alloc_size_DEVICE_NAME_ VALUE
Example
[ceph: root@host01 /]# ceph config set osd.4 bluestore_min_alloc_size_hdd 8192
You can see
bluestore_min_alloc_sizeis set to 8192 bytes, which is equivalent to 8 KiB.NoteThe selected values should be power of 2 aligned.
Restart the OSD’s service.
Syntax
systemctl restart SERVICE_ID
Example
[ceph: root@host01 /]# systemctl restart ceph-499829b4-832f-11eb-8d6d-001a4a000635@osd.4.service
Verification
Verify the setting using the
ceph daemoncommand:Syntax
ceph daemon osd.OSD_ID config get bluestore_min_alloc_size__DEVICE_Example
[ceph: root@host01 /]# ceph daemon osd.4 config get bluestore_min_alloc_size_hdd

ceph daemon osd.4 config get bluestore_min_alloc_size
{
    "bluestore_min_alloc_size": "8192"
}
Additional Resources
-
For OSD removal and addition, see the Management of OSDs using the Ceph Orchestrator chapter in the Red Hat Ceph Storage Operations Guide and follow the links. For already deployed OSDs, you cannot modify the
bluestore_min_alloc_sizeparameter so you have to remove the OSDs and freshly deploy them again.
11.6. Resharding the RocksDB database using the BlueStore admin tool
You can reshard the database with the BlueStore admin tool. It transforms BlueStore’s RocksDB database from one shape to another into several column families without redeploying the OSDs. Column families have the same features as the whole database, but allows users to operate on smaller data sets and apply different options. It leverages the different expected lifetime of keys stored. The keys are moved during the transformation without creating new keys or deleting existing keys.
There are two ways to reshard the OSD:
-
Use the
rocksdb-resharding.ymlplaybook. - Manually reshard the OSDs.
Prerequisites
- A running Red Hat Ceph Storage cluster.
- The object store configured as BlueStore.
- OSD nodes deployed on the hosts.
- Root level access to the all the hosts.
-
The
ceph-commonandcephadmpackages installed on all the hosts.
11.6.1. Use the rocksdb-resharding.yml playbook
As a root user, on the administration node, navigate to the
cephadmfolder where the playbook is installed:Example
[root@host01 ~]# cd /usr/share/cephadm-ansible
Run the playbook:
Syntax
ansible-playbook -i hosts rocksdb-resharding.yml -e osd_id=OSD_ID -e admin_node=HOST_NAME
Example
[root@host01 ~]# ansible-playbook -i hosts rocksdb-resharding.yml -e osd_id=7 -e admin_node=host03

...............
TASK [stop the osd] ***********************************************************************************************************************************************************************************************
Wednesday 29 November 2023  11:25:18 +0000 (0:00:00.037)       0:00:03.864 ****
changed: [localhost -> host03]
TASK [set_fact ceph_cmd] ******************************************************************************************************************************************************************************************
Wednesday 29 November 2023  11:25:32 +0000 (0:00:14.128)       0:00:17.992 ****
ok: [localhost -> host03]

TASK [check fs consistency with fsck before resharding] ***********************************************************************************************************************************************************
Wednesday 29 November 2023  11:25:32 +0000 (0:00:00.041)       0:00:18.034 ****
ok: [localhost -> host03]

TASK [show current sharding] **************************************************************************************************************************************************************************************
Wednesday 29 November 2023  11:25:43 +0000 (0:00:11.053)       0:00:29.088 ****
ok: [localhost -> host03]

TASK [reshard] ****************************************************************************************************************************************************************************************************
Wednesday 29 November 2023  11:25:45 +0000 (0:00:01.446)       0:00:30.534 ****
ok: [localhost -> host03]

TASK [check fs consistency with fsck after resharding] ************************************************************************************************************************************************************
Wednesday 29 November 2023  11:25:46 +0000 (0:00:01.479)       0:00:32.014 ****
ok: [localhost -> host03]

TASK [restart the osd] ********************************************************************************************************************************************************************************************
Wednesday 29 November 2023  11:25:57 +0000 (0:00:10.699)       0:00:42.714 ****
changed: [localhost -> host03]
Verify that the resharding is complete.
Stop the OSD that is resharded:
Example
[ceph: root@host01 /]# ceph orch daemon stop osd.7
Enter the OSD container:
Example
[root@host03 ~]# cephadm shell --name osd.7
Check for resharding:
Example
[ceph: root@host03 /]# ceph-bluestore-tool --path /var/lib/ceph/osd/ceph-7/ show-sharding
    m(3) p(3,0-12) O(3,0-13) L P
Start the OSD:
Example
[ceph: root@host01 /]# ceph orch daemon start osd.7
11.6.2. Manually resharding the OSDs
Log into the
cephadmshell:Example
[root@host01 ~]# cephadm shell
Fetch the OSD_ID and the host details from the administration node:
Example
[ceph: root@host01 /]# ceph orch ps
Log into the respective host as a
rootuser and stop the OSD:Syntax
cephadm unit --name OSD_ID stopExample
[root@host02 ~]# cephadm unit --name osd.0 stop
Enter into the stopped OSD daemon container:
Syntax
cephadm shell --name OSD_IDExample
[root@host02 ~]# cephadm shell --name osd.0
Log into the
cephadm shelland check the file system consistency:Syntax
ceph-bluestore-tool --path/var/lib/ceph/osd/ceph-OSD_ID/ fsckExample
[ceph: root@host02 /]# ceph-bluestore-tool --path /var/lib/ceph/osd/ceph-0/ fsck

fsck success
Check the sharding status of the OSD node:
Syntax
ceph-bluestore-tool --path /var/lib/ceph/osd/ceph-OSD_ID/ show-shardingExample
[ceph: root@host02 /]# ceph-bluestore-tool --path /var/lib/ceph/osd/ceph-6/ show-sharding

m(3) p(3,0-12) O(3,0-13) L P
Run the
ceph-bluestore-toolcommand to reshard. Red Hat recommends to use the parameters as given in the command:Syntax
ceph-bluestore-tool --log-level 10 -l log.txt --path /var/lib/ceph/osd/ceph-OSD_ID/ --sharding="m(3) p(3,0-12) O(3,0-13)=block_cache={type=binned_lru} L P" reshardExample
[ceph: root@host02 /]# ceph-bluestore-tool --path /var/lib/ceph/osd/ceph-6/ --sharding="m(3) p(3,0-12) O(3,0-13)=block_cache={type=binned_lru} L P" reshard

reshard success
To check the sharding status of the OSD node, run the
show-shardingcommand:Syntax
ceph-bluestore-tool --path /var/lib/ceph/osd/ceph-OSD_ID/ show-shardingExample
[ceph: root@host02 /]# ceph-bluestore-tool --path /var/lib/ceph/osd/ceph-6/ show-sharding

m(3) p(3,0-12) O(3,0-13)=block_cache={type=binned_lru} L P
Exit from the
cephadmshell:[ceph: root@host02 /]# exit
Log into the respective host as a
rootuser and start the OSD:Syntax
cephadm unit --name OSD_ID startExample
[root@host02 ~]# cephadm unit --name osd.0 start
Additional Resources
- See the Red Hat Ceph Storage Installation Guide for more information.
11.7. The BlueStore fragmentation tool
As a storage administrator, you will want to periodically check the fragmentation level of your BlueStore OSDs. You can check fragmentation levels with one simple command for offline or online OSDs.
11.7.1. What is the BlueStore fragmentation tool?
For BlueStore OSDs, the free space gets fragmented over time on the underlying storage device. Some fragmentation is normal, but when there is excessive fragmentation this causes poor performance.
The BlueStore fragmentation tool generates a score on the fragmentation level of the BlueStore OSD. This fragmentation score is given as a range, 0 through 1. A score of 0 means no fragmentation, and a score of 1 means severe fragmentation.
Table 11.1. Fragmentation scores' meaning
| Score | Fragmentation Amount |
|---|---|
| 0.0 - 0.4 | None to tiny fragmentation. |
| 0.4 - 0.7 | Small and acceptable fragmentation. |
| 0.7 - 0.9 | Considerable, but safe fragmentation. |
| 0.9 - 1.0 | Severe fragmentation and that causes performance issues. |
If you have severe fragmentation, and need some help in resolving the issue, contact Red Hat Support.
11.7.2. Checking for fragmentation
Checking the fragmentation level of BlueStore OSDs can be done either online or offline.
Prerequisites
- A running Red Hat Ceph Storage cluster.
- BlueStore OSDs.
Online BlueStore fragmentation score
Inspect a running BlueStore OSD process:
Simple report:
Syntax
ceph daemon OSD_ID bluestore allocator score blockExample
[ceph: root@host01 /]# ceph daemon osd.123 bluestore allocator score block
A more detailed report:
Syntax
ceph daemon OSD_ID bluestore allocator dump blockExample
[ceph: root@host01 /]# ceph daemon osd.123 bluestore allocator dump block
Offline BlueStore fragmentation score
Follow the steps for resharding for checking the offline fragmentation score.
Example
[root@host01 ~]# podman exec -it 7fbd6c6293c0 /bin/bash
Inspect a non-running BlueStore OSD process:
Simple report:
Syntax
ceph-bluestore-tool --path PATH_TO_OSD_DATA_DIRECTORY --allocator block free-scoreExample
[root@7fbd6c6293c0 /]# ceph-bluestore-tool --path /var/lib/ceph/osd/ceph-123 --allocator block free-score
A more detailed report:
Syntax
ceph-bluestore-tool --path PATH_TO_OSD_DATA_DIRECTORY --allocator block free-dump
block:
{
    "fragmentation_rating": 0.018290238194701977
}
Example
[root@7fbd6c6293c0 /]# ceph-bluestore-tool --path /var/lib/ceph/osd/ceph-123 --allocator block free-dump
block:
{
    "capacity": 21470642176,
    "alloc_unit": 4096,
    "alloc_type": "hybrid",
    "alloc_name": "block",
    "extents": [
        {
            "offset": "0x370000",
            "length": "0x20000"
        },
        {
            "offset": "0x3a0000",
            "length": "0x10000"
        },
        {
            "offset": "0x3f0000",
            "length": "0x20000"
        },
        {
            "offset": "0x460000",
            "length": "0x10000"
        },
Additional Resources
- See the BlueStore Fragmentation Tool for details on the fragmentation score.
- See the Resharding the RocskDB database using the BlueStore admin tool for details on resharding.
11.8. Ceph BlueStore BlueFS
BlueStore block database stores metadata as key-value pairs in a RocksDB database. The block database resides on a small BlueFS partition on the storage device. BlueFS is a minimal file system that is designed to hold the RocksDB files.
BlueFS files
Following are the three types of files that RocksDB produces:
-
Control files, for example
CURRENT,IDENTITY, andMANIFEST-000011. -
DB table files, for example
004112.sst. -
Write ahead logs, for example
000038.log.
Additionally, there is an internal, hidden file that serves as BlueFS replay log, ino 1, that works as directory structure, file mapping, and operations log.
Fallback hierarchy
With BlueFS it is possible to put any file on any device. Parts of file can even reside on different devices, that is WAL, DB, and SLOW. There is an order to where BlueFS puts files. File is put to secondary storage only when primary storage is exhausted, and tertiary only when secondary is exhausted.
The order for the specific files is:
- Write ahead logs: WAL, DB, SLOW
-
Replay log
ino 1: DB, SLOW Control and DB files: DB, SLOW
Control and DB file order when running out of space: SLOW
ImportantThere is an exception to control and DB file order. When RocksDB detects that you are running out of space on DB file, it directly notifies you to put file to SLOW device.
11.8.1. Viewing the bluefs_buffered_io setting
As a storage administrator, you can view the current setting for the bluefs_buffered_io parameter.
The option bluefs_buffered_io is set to True by default for Red Hat Ceph Storage. This option enable BlueFS to perform buffered reads in some cases, and enables the kernel page cache to act as a secondary cache for reads like RocksDB block reads.
Changing the value of bluefs_buffered_io is not recommended. Before changing the bluefs_buffered_io parameter, contact your Red Hat Support account team.
Prerequisites
- A running Red Hat Ceph Storage cluster.
- Root-level access to the Ceph Monitor node.
Procedure
Log into the Cephadm shell:
Example
[root@host01 ~]# cephadm shell
-
You can view the current value of the
bluefs_buffered_ioparameter in three different ways:
Method 1
View the value stored in the configuration database:
Example
[ceph: root@host01 /]# ceph config get osd bluefs_buffered_io
Method 2
View the value stored in the configuration database for a specific OSD:
Syntax
ceph config get OSD_ID bluefs_buffered_ioExample
[ceph: root@host01 /]# ceph config get osd.2 bluefs_buffered_io
Method 3
View the running value for an OSD where the running value is different from the value stored in the configuration database:
Syntax
ceph config show OSD_ID bluefs_buffered_ioExample
[ceph: root@host01 /]# ceph config show osd.3 bluefs_buffered_io
11.8.2. Viewing Ceph BlueFS statistics for Ceph OSDs
View the BluesFS related information about collocated and non-collocated Ceph OSDs with the bluefs stats command.
Prerequisites
- A running Red Hat Ceph Storage cluster.
- The object store configured as BlueStore.
- Root-level access to the OSD node.
Procedure
Log into the Cephadm shell:
Example
[root@host01 ~]# cephadm shell
View the BlueStore OSD statistics:
Syntax
ceph daemon osd.OSD_ID bluefs statsExample for collocated OSDs
[ceph: root@host01 /]# ceph daemon osd.1 bluefs stats

1 : device size 0x3bfc00000 : using 0x1a428000(420 MiB)
wal_total:0, db_total:15296836403, slow_total:0
Example for non-collocated OSDs
[ceph: root@host01 /]# ceph daemon osd.1 bluefs stats

0 :
1 : device size 0x1dfbfe000 : using 0x1100000(17 MiB)
2 : device size 0x27fc00000 : using 0x248000(2.3 MiB)
RocksDBBlueFSVolumeSelector: wal_total:0, db_total:7646425907, slow_total:10196562739, db_avail:935539507
Usage matrix:
DEV/LEV     WAL         DB          SLOW        *           *           REAL        FILES
LOG         0 B         4 MiB       0 B         0 B         0 B         756 KiB     1
WAL         0 B         4 MiB       0 B         0 B         0 B         3.3 MiB     1
DB          0 B         9 MiB       0 B         0 B         0 B         76 KiB      10
SLOW        0 B         0 B         0 B         0 B         0 B         0 B         0
TOTALS      0 B         17 MiB      0 B         0 B         0 B         0 B         12
MAXIMUMS:
LOG         0 B         4 MiB       0 B         0 B         0 B         756 KiB
WAL         0 B         4 MiB       0 B         0 B         0 B         3.3 MiB
DB          0 B         11 MiB      0 B         0 B         0 B         112 KiB
SLOW        0 B         0 B         0 B         0 B         0 B         0 B
TOTALS      0 B         17 MiB      0 B         0 B         0 B         0 B
where:
0: This refers to dedicated WAL device, that isblock.wal.1: This refers to dedicated DB device, that isblock.db.2: This refers to main block device, that isblockorslow.device size: It represents an actual size of the device.using: It represents total usage. It is not restricted to BlueFS.NoteDB and WAL devices are used only by BlueFS. For main device, usage from stored BlueStore data is also included. In the above example,
2.3 MiBis the data from BlueStore.wal_total,db_total,slow_total: These values reiterate the device values above.db_avail: This value represents how many bytes can be taken from SLOW device if necessary.Usage matrix-
The rows
WAL,DB,SLOW: Describe where specific file was intended to be put. -
The row
LOG: Describes the BlueFS replay logino 1. -
The columns
WAL,DB,SLOW: Describe where data is actually put. The values are in allocation units. WAL and DB have bigger allocation units for performance reasons. -
The columns
* / *: Relate to virtual devicesnew-dbandnew-walthat are used forceph-bluestore-tool. It should always show0 B. -
The column
REAL: Shows actual usage in bytes. -
The column
FILES: Shows count of files.
-
The rows
MAXIMUMS: this table captures the maximum value of each entry from the usage matrix.
Additional Resources
- See Ceph BlueStore BlueFS for more information about BlueFS files.
- See Ceph BlueStore devices for more information about BlueStore devices.
Chapter 12. Cephadm troubleshooting
As a storage administrator, you can troubleshoot the Red Hat Ceph Storage cluster. Sometimes there is a need to investigate why a Cephadm command failed or why a specific service does not run properly.
12.1. Pause or disable cephadm
If Cephadm does not behave as expected, you can pause most of the background activity with the following command:
Example
[ceph: root@host01 /]# ceph orch pause
This stops any changes, but Cephadm periodically checks hosts to refresh it’s inventory of daemons and devices.
If you want to disable Cephadm completely, run the following commands:
Example
[ceph: root@host01 /]# ceph orch set backend ''
[ceph: root@host01 /]# ceph mgr module disable cephadm
Note that previously deployed daemon containers continue to exist and start as they did before.
To re-enable Cephadm in the cluster, run the following commands:
Example
[ceph: root@host01 /]# ceph mgr module enable cephadm
[ceph: root@host01 /]# ceph orch set backend cephadm
12.2. Per service and per daemon event
Cephadm stores events per service and per daemon in order to aid in debugging failed daemon deployments. These events often contain relevant information:
Per service
Syntax
ceph orch ls --service_name SERVICE_NAME --format yaml
Example
[ceph: root@host01 /]# ceph orch ls --service_name alertmanager --format yaml
service_type: alertmanager
service_name: alertmanager
placement:
  hosts:
  - unknown_host
status:
  ...
  running: 1
  size: 1
events:
- 2021-02-01T08:58:02.741162 service:alertmanager [INFO] "service was created"
- '2021-02-01T12:09:25.264584 service:alertmanager [ERROR] "Failed to apply: Cannot
  place <AlertManagerSpec for service_name=alertmanager> on unknown_host: Unknown hosts"'
Per daemon
Syntax
ceph orch ps --service-name SERVICE_NAME --daemon-id DAEMON_ID --format yaml
Example
[ceph: root@host01 /]# ceph orch ps --service-name mds --daemon-id cephfs.hostname.ppdhsz --format yaml
daemon_type: mds
daemon_id: cephfs.hostname.ppdhsz
hostname: hostname
status_desc: running
...
events:
- 2021-02-01T08:59:43.845866 daemon:mds.cephfs.hostname.ppdhsz [INFO] "Reconfigured
  mds.cephfs.hostname.ppdhsz on host 'hostname'"
12.3. Check cephadm logs
You can monitor the Cephadm log in real time with the following command:
Example
[ceph: root@host01 /]# ceph -W cephadm
You can see the last few messages with the following command:
Example
[ceph: root@host01 /]# ceph log last cephadm
If you have enabled logging to files, you can see a Cephadm log file called ceph.cephadm.log on the monitor hosts.
12.4. Gather log files
You can use the journalctl command, to gather the log files for all the daemons.
You have to run all these commands outside the cephadm shell.
By default, Cephadm stores logs in journald which means that daemon logs are no longer available in /var/log/ceph.
To read the log file of a specific daemon, run the following command:
Syntax
cephadm logs --name DAEMON_NAMEExample
[root@host01 ~]# cephadm logs --name cephfs.hostname.ppdhsz
This command works when run on the same hosts where the daemon is running.
To read the log file of a specific daemon running on a different host, run the following command:
Syntax
cephadm logs --fsid FSID --name DAEMON_NAME
Example
[root@host01 ~]# cephadm logs --fsid 2d2fd136-6df1-11ea-ae74-002590e526e8 --name cephfs.hostname.ppdhsz
where
fsidis the cluster ID provided by theceph statuscommand.To fetch all log files of all the daemons on a given host, run the following command:
Syntax
for name in $(cephadm ls | python3 -c "import sys, json; [print(i['name']) for i in json.load(sys.stdin)]") ; do cephadm logs --fsid FSID_OF_CLUSTER --name "$name" > $name; doneExample
[root@host01 ~]# for name in $(cephadm ls | python3 -c "import sys, json; [print(i['name']) for i in json.load(sys.stdin)]") ; do cephadm logs --fsid 57bddb48-ee04-11eb-9962-001a4a000672 --name "$name" > $name; done
12.5. Collect systemd status
To print the state of a systemd unit, run the following command:
Example
[root@host01 ~]$ systemctl status ceph-a538d494-fb2a-48e4-82c8-b91c37bb0684@mon.host01.service
12.6. List all downloaded container images
To list all the container images that are downloaded on a host, run the following command:
Example
[ceph: root@host01 /]# podman ps -a --format json | jq '.[].Image'
"docker.io/library/rhel9"
"registry.redhat.io/rhceph-alpha/rhceph-6-rhel9@sha256:9aaea414e2c263216f3cdcb7a096f57c3adf6125ec9f4b0f5f65fa8c43987155"
12.7. Manually run containers
Cephadm writes small wrappers that runs a container. Refer to /var/lib/ceph/CLUSTER_FSID/SERVICE_NAME/unit to run the container execution command.
Analysing SSH errors
If you get the following error:
Example
execnet.gateway_bootstrap.HostNotFound: -F /tmp/cephadm-conf-73z09u6g -i /tmp/cephadm-identity-ky7ahp_5 root@10.10.1.2
...
raise OrchestratorError(msg) from e
orchestrator._interface.OrchestratorError: Failed to connect to 10.10.1.2 (10.10.1.2).
Please make sure that the host is reachable and accepts connections using the cephadm SSH key
Try the following options to troubleshoot the issue:
To ensure Cephadm has a SSH identity key, run the following command:
Example
[ceph: root@host01 /]# ceph config-key get mgr/cephadm/ssh_identity_key > ~/cephadm_private_key
INFO:cephadm:Inferring fsid f8edc08a-7f17-11ea-8707-000c2915dd98
INFO:cephadm:Using recent ceph image docker.io/ceph/ceph:v15 obtained 'mgr/cephadm/ssh_identity_key'
[root@mon1 ~] # chmod 0600 ~/cephadm_private_key
If the above command fails, Cephadm does not have a key. To generate a SSH key, run the following command:
Example
[ceph: root@host01 /]# chmod 0600 ~/cephadm_private_key
Or
Example
[ceph: root@host01 /]# cat ~/cephadm_private_key | ceph cephadm set-ssk-key -i-
To ensure that the SSH configuration is correct, run the following command:
Example
[ceph: root@host01 /]# ceph cephadm get-ssh-config
To verify the connection to the host, run the following command:
Example
[ceph: root@host01 /]# ssh -F config -i ~/cephadm_private_key root@host01
Verify public key is in authorized_keys.
To verify that the public key is in the authorized_keys file, run the following commands:
Example
[ceph: root@host01 /]# ceph cephadm get-pub-key
[ceph: root@host01 /]# grep "`cat ~/ceph.pub`" /root/.ssh/authorized_keys
12.8. CIDR network error
Classless inter domain routing (CIDR) also known as supernetting, is a method of assigning Internet Protocol (IP) addresses,FThe Cephadm log entries shows the current state that improves the efficiency of address distribution and replaces the previous system based on Class A, Class B and Class C networks. If you see one of the following errors:
ERROR: Failed to infer CIDR network for mon ip *; pass --skip-mon-network to configure it later
Or
Must set public_network config option or specify a CIDR network, ceph addrvec, or plain IP
You need to run the following command:
Example
[ceph: root@host01 /]# ceph config set host public_network hostnetwork
12.9. Access the admin socket
Each Ceph daemon provides an admin socket that bypasses the MONs.
To access the admin socket, enter the daemon container on the host:
Example
[ceph: root@host01 /]# cephadm enter --name cephfs.hostname.ppdhsz
[ceph: root@mon1 /]# ceph --admin-daemon /var/run/ceph/ceph-cephfs.hostname.ppdhsz.asok config show
12.10. Manually deploying a mgr daemon
Cephadm requires a mgr daemon in order to manage the Red Hat Ceph Storage cluster. In case the last mgr daemon of a Red Hat Ceph Storage cluster was removed, you can manually deploy a mgr daemon, on a random host of the Red Hat Ceph Storage cluster.
Prerequisites
- A running Red Hat Ceph Storage cluster.
- Root-level access to all the nodes.
- Hosts are added to the cluster.
Procedure
Log into the Cephadm shell:
Example
[root@host01 ~]# cephadm shell
Disable the Cephadm scheduler to prevent Cephadm from removing the new MGR daemon, with the following command:
Example
[ceph: root@host01 /]# ceph config-key set mgr/cephadm/pause true
Get or create the
authentry for the new MGR daemon:Example
[ceph: root@host01 /]# ceph auth get-or-create mgr.host01.smfvfd1 mon "profile mgr" osd "allow *" mds "allow *"
[mgr.host01.smfvfd1]
key = AQDhcORgW8toCRAAlMzlqWXnh3cGRjqYEa9ikw==
Open
ceph.conffile:Example
[ceph: root@host01 /]# ceph config generate-minimal-conf
# minimal ceph.conf for 8c9b0072-67ca-11eb-af06-001a4a0002a0
[global]
fsid = 8c9b0072-67ca-11eb-af06-001a4a0002a0
mon_host = [v2:10.10.200.10:3300/0,v1:10.10.200.10:6789/0] [v2:10.10.10.100:3300/0,v1:10.10.200.100:6789/0]
Get the container image:
Example
[ceph: root@host01 /]# ceph config get "mgr.host01.smfvfd1" container_image
Create a
config-json.jsonfile and add the following:NoteUse the values from the output of the
ceph config generate-minimal-confcommand.Example
{
  {
  "config": "# minimal ceph.conf for 8c9b0072-67ca-11eb-af06-001a4a0002a0\n[global]\n\tfsid = 8c9b0072-67ca-11eb-af06-001a4a0002a0\n\tmon_host =  [v2:10.10.200.10:3300/0,v1:10.10.200.10:6789/0] [v2:10.10.10.100:3300/0,v1:10.10.200.100:6789/0]\n",
  "keyring": "[mgr.Ceph5-2.smfvfd1]\n\tkey = AQDhcORgW8toCRAAlMzlqWXnh3cGRjqYEa9ikw==\n"
}
}
Exit from the Cephadm shell:
Example
[ceph: root@host01 /]# exit
Deploy the MGR daemon:
Example
[root@host01 ~]# cephadm --image registry.redhat.io/rhceph-alpha/rhceph-6-rhel9:latest deploy --fsid 8c9b0072-67ca-11eb-af06-001a4a0002a0 --name mgr.host01.smfvfd1 --config-json config-json.json
Verification
In the Cephadm shell, run the following command:
Example
[ceph: root@host01 /]# ceph -s
You can see a new mgr daemon has been added.
Chapter 13. Cephadm operations
As a storage administrator, you can carry out Cephadm operations in the Red Hat Ceph Storage cluster.
13.1. Monitor cephadm log messages
Cephadm logs to the cephadm cluster log channel so you can monitor progress in real time.
To monitor progress in realtime, run the following command:
Example
[ceph: root@host01 /]# ceph -W cephadm
Example
2022-06-10T17:51:36.335728+0000 mgr.Ceph5-1.nqikfh [INF] refreshing Ceph5-adm facts
2022-06-10T17:51:37.170982+0000 mgr.Ceph5-1.nqikfh [INF] deploying 1 monitor(s) instead of 2 so monitors may achieve consensus
2022-06-10T17:51:37.173487+0000 mgr.Ceph5-1.nqikfh [ERR] It is NOT safe to stop ['mon.Ceph5-adm']: not enough monitors would be available (Ceph5-2) after stopping mons [Ceph5-adm]
2022-06-10T17:51:37.174415+0000 mgr.Ceph5-1.nqikfh [INF] Checking pool "nfs-ganesha" exists for service nfs.foo
2022-06-10T17:51:37.176389+0000 mgr.Ceph5-1.nqikfh [ERR] Failed to apply nfs.foo spec NFSServiceSpec({'placement': PlacementSpec(count=1), 'service_type': 'nfs', 'service_id': 'foo', 'unmanaged': False, 'preview_only': False, 'pool': 'nfs-ganesha', 'namespace': 'nfs-ns'}): Cannot find pool "nfs-ganesha" for service nfs.foo
Traceback (most recent call last):
  File "/usr/share/ceph/mgr/cephadm/serve.py", line 408, in _apply_all_services
    if self._apply_service(spec):
  File "/usr/share/ceph/mgr/cephadm/serve.py", line 509, in _apply_service
    config_func(spec)
  File "/usr/share/ceph/mgr/cephadm/services/nfs.py", line 23, in config
    self.mgr._check_pool_exists(spec.pool, spec.service_name())
  File "/usr/share/ceph/mgr/cephadm/module.py", line 1840, in _check_pool_exists
    raise OrchestratorError(f'Cannot find pool "{pool}" for '
orchestrator._interface.OrchestratorError: Cannot find pool "nfs-ganesha" for service nfs.foo
2022-06-10T17:51:37.179658+0000 mgr.Ceph5-1.nqikfh [INF] Found osd claims -> {}
2022-06-10T17:51:37.180116+0000 mgr.Ceph5-1.nqikfh [INF] Found osd claims for drivegroup all-available-devices -> {}
2022-06-10T17:51:37.182138+0000 mgr.Ceph5-1.nqikfh [INF] Applying all-available-devices on host Ceph5-adm...
2022-06-10T17:51:37.182987+0000 mgr.Ceph5-1.nqikfh [INF] Applying all-available-devices on host Ceph5-1...
2022-06-10T17:51:37.183395+0000 mgr.Ceph5-1.nqikfh [INF] Applying all-available-devices on host Ceph5-2...
2022-06-10T17:51:43.373570+0000 mgr.Ceph5-1.nqikfh [INF] Reconfiguring node-exporter.Ceph5-1 (unknown last config time)...
2022-06-10T17:51:43.373840+0000 mgr.Ceph5-1.nqikfh [INF] Reconfiguring daemon node-exporter.Ceph5-1 on Ceph5-1
By default, the log displays info-level events and above. To see the debug-level messages, run the following commands:
Example
[ceph: root@host01 /]# ceph config set mgr mgr/cephadm/log_to_cluster_level debug
[ceph: root@host01 /]# ceph -W cephadm --watch-debug
[ceph: root@host01 /]# ceph -W cephadm --verbose
Return debugging level to default
info:Example
[ceph: root@host01 /]# ceph config set mgr mgr/cephadm/log_to_cluster_level info
To see the recent events, run the following command:
Example
[ceph: root@host01 /]# ceph log last cephadm
Theses events are also logged to ceph.cephadm.log file on the monitor hosts and to the monitor daemon’s stderr
13.2. Ceph daemon logs
You can view the Ceph daemon logs through stderr or files.
Logging to stdout
Traditionally, Ceph daemons have logged to /var/log/ceph. By default, Cephadm daemons log to stderr and the logs are captured by the container runtime environment. For most systems, by default, these logs are sent to journald and accessible through the journalctl command.
For example, to view the logs for the daemon on host01 for a storage cluster with ID 5c5a50ae-272a-455d-99e9-32c6a013e694:
Example
[ceph: root@host01 /]# journalctl -u ceph-5c5a50ae-272a-455d-99e9-32c6a013e694@host01
This works well for normal Cephadm operations when logging levels are low.
To disable logging to
stderr, set the following values:Example
[ceph: root@host01 /]# ceph config set global log_to_stderr false
[ceph: root@host01 /]# ceph config set global mon_cluster_log_to_stderr false
Logging to files
You can also configure Ceph daemons to log to files instead of stderr. When logging to files, Ceph logs are located in /var/log/ceph/CLUSTER_FSID.
To enable logging to files, set the follwing values:
Example
[ceph: root@host01 /]# ceph config set global log_to_file true
[ceph: root@host01 /]# ceph config set global mon_cluster_log_to_file true
Red Hat recommends disabling logging to stderr to avoid double logs.
Currently log rotation to a non-default path is not supported.
By default, Cephadm sets up log rotation on each host to rotate these files. You can configure the logging retention schedule by modifying /etc/logrotate.d/ceph.CLUSTER_FSID.
13.3. Data location
Cephadm daemon data and logs are located in slightly different locations than the older versions of Ceph:
-
/var/log/ceph/CLUSTER_FSIDcontains all the storage cluster logs. Note that by default Cephadm logs throughstderrand the container runtime, so these logs are usually not present. -
/var/lib/ceph/CLUSTER_FSIDcontains all the cluster daemon data, besides logs. -
var/lib/ceph/CLUSTER_FSID/DAEMON_NAMEcontains all the data for an specific daemon. -
/var/lib/ceph/CLUSTER_FSID/crashcontains the crash reports for the storage cluster. -
/var/lib/ceph/CLUSTER_FSID/removedcontains old daemon data directories for the stateful daemons, for example monitor or Prometheus, that have been removed by Cephadm.
Disk usage
A few Ceph daemons may store a significant amount of data in /var/lib/ceph, notably the monitors and Prometheus daemon, hence Red Hat recommends moving this directory to its own disk, partition, or logical volume so that the root file system is not filled up.
13.4. Cephadm custom config files
Cephadm supports specifying miscellaneous configuration files for daemons. You must provide both the content of the configuration file and the location within the daemon’s container where it should be mounted.
A YAML spec is applied with custom config files specified. Cephadm redeploys the daemons for which the config files are specified. Then these files are mounted within the daemon’s container at the specified location.
You can apply a YAML spec with custom config files:
Example
service_type: grafana
service_name: grafana
custom_configs:
  - mount_path: /etc/example.conf
    content: |
      setting1 = value1
      setting2 = value2
  - mount_path: /usr/share/grafana/example.cert
    content: |
-----BEGIN PRIVATE KEY-----
V2VyIGRhcyBsaWVzdCBpc3QgZG9vZi4gTG9yZW0gaXBzdW0gZG9sb3Igc2l0IGFtZXQsIGNvbnNldGV0dXIgc2FkaXBzY2luZyBlbGl0ciwgc2VkIGRpYW0gbm9udW15IGVpcm1vZCB0ZW1wb3IgaW52aWR1bnQgdXQgbGFib3JlIGV0IGRvbG9yZSBtYWduYSBhbGlxdXlhbSBlcmF0LCBzZWQgZGlhbSB2b2x1cHR1YS4gQXQgdmVybyBlb3MgZXQgYWNjdXNhbSBldCBqdXN0byBkdW8=
-----END PRIVATE KEY-----
-----BEGIN CERTIFICATE-----
V2VyIGRhcyBsaWVzdCBpc3QgZG9vZi4gTG9yZW0gaXBzdW0gZG9sb3Igc2l0IGFtZXQsIGNvbnNldGV0dXIgc2FkaXBzY2luZyBlbGl0ciwgc2VkIGRpYW0gbm9udW15IGVpcm1vZCB0ZW1wb3IgaW52aWR1bnQgdXQgbGFib3JlIGV0IGRvbG9yZSBtYWduYSBhbGlxdXlhbSBlcmF0LCBzZWQgZGlhbSB2b2x1cHR1YS4gQXQgdmVybyBlb3MgZXQgYWNjdXNhbSBldCBqdXN0byBkdW8=
-----END CERTIFICATE-----
You can mount the new config files within the containers for the daemons:
Syntax
ceph orch redeploy SERVICE_NAMEExample
[ceph: root@host01 /]# ceph orch redeploy grafana
Chapter 14. Cephadm health checks
As a storage administrator, you can monitor the Red Hat Ceph Storage cluster with the additional health checks provided by the Cephadm module. This is supplementary to the default healthchecks provided by the storage cluster.
14.1. Cephadm operations health checks
Healthchecks are executed when the Cephadm module is active. You can get the following health warnings:
CEPHADM_PAUSED
Cephadm background work is paused with the ceph orch pause command. Cephadm continues to perform passive monitoring activities such as checking the host and daemon status, but it does not make any changes like deploying or removing daemons. You can resume Cephadm work with the ceph orch resume command.
CEPHADM_STRAY_HOST
One or more hosts have running Ceph daemons but are not registered as hosts managed by the Cephadm module. This means that those services are not currently managed by Cephadm, for example, a restart and upgrade that is included in the ceph orch ps command. You can manage the host(s) with the ceph orch host add HOST_NAME command but ensure that SSH access to the remote hosts is configured. Alternatively, you can manually connect to the host and ensure that services on that host are removed or migrated to a host that is managed by Cephadm. You can also disable this warning with the setting ceph config set mgr mgr/cephadm/warn_on_stray_hosts false
CEPHADM_STRAY_DAEMON
One or more Ceph daemons are running but are not managed by the Cephadm module. This might be because they were deployed using a different tool, or because they were started manually. Those services are not currently managed by Cephadm, for example, a restart and upgrade that is included in the ceph orch ps command.
If the daemon is a stateful one that is a monitor or OSD daemon, these daemons should be adopted by Cephadm. For stateless daemons, you can provision a new daemon with the ceph orch apply command and then stop the unmanaged daemon.
You can disable this health warning with the setting ceph config set mgr mgr/cephadm/warn_on_stray_daemons false.
CEPHADM_HOST_CHECK_FAILED
One or more hosts have failed the basic Cephadm host check, which verifies that:name: value
- The host is reachable and you can execute Cephadm.
- The host meets the basic prerequisites, like a working container runtime that is Podman , and working time synchronization. If this test fails, Cephadm wont be able to manage the services on that host.
You can manually run this check with the ceph cephadm check-host HOST_NAME command. You can remove a broken host from management with the ceph orch host rm HOST_NAME command. You can disable this health warning with the setting ceph config set mgr mgr/cephadm/warn_on_failed_host_check false.
14.2. Cephadm configuration health checks
Cephadm periodically scans each of the hosts in the storage cluster, to understand the state of the OS, disks, and NICs . These facts are analyzed for consistency across the hosts in the storage cluster to identify any configuration anomalies. The configuration checks are an optional feature.
You can enable this feature with the following command:
Example
[ceph: root@host01 /]# ceph config set mgr mgr/cephadm/config_checks_enabled true
The configuration checks are triggered after each host scan, which is for a duration of one minute.
The
ceph -W cephadmcommand shows log entries of the current state and outcome of the configuration checks as follows:Disabled state
Example
ALL cephadm checks are disabled, use 'ceph config set mgr mgr/cephadm/config_checks_enabled true' to enable
Enabled state
Example
CEPHADM 8/8 checks enabled and executed (0 bypassed, 0 disabled). No issues detected
The configuration checks themselves are managed through several
cephadmsubcommands.To determine whether the configuration checks are enabled, run the following command:
Example
[ceph: root@host01 /]# ceph cephadm config-check status
This command returns the status of the configuration checker as either Enabled or Disabled.
To list all the configuration checks and their current state, run the following command:
Example
[ceph: root@host01 /]# ceph cephadm config-check ls
NAME             HEALTHCHECK                      STATUS   DESCRIPTION
kernel_security  CEPHADM_CHECK_KERNEL_LSM         enabled  checks SELINUX/Apparmor profiles are consistent across cluster hosts
os_subscription  CEPHADM_CHECK_SUBSCRIPTION       enabled  checks subscription states are consistent for all cluster hosts
public_network   CEPHADM_CHECK_PUBLIC_MEMBERSHIP  enabled  check that all hosts have a NIC on the Ceph public_netork
osd_mtu_size     CEPHADM_CHECK_MTU                enabled  check that OSD hosts share a common MTU setting
osd_linkspeed    CEPHADM_CHECK_LINKSPEED          enabled  check that OSD hosts share a common linkspeed
network_missing  CEPHADM_CHECK_NETWORK_MISSING    enabled  checks that the cluster/public networks defined exist on the Ceph hosts
ceph_release     CEPHADM_CHECK_CEPH_RELEASE       enabled  check for Ceph version consistency - ceph daemons should be on the same release (unless upgrade is active)
kernel_version   CEPHADM_CHECK_KERNEL_VERSION     enabled  checks that the MAJ.MIN of the kernel on Ceph hosts is consistent
Each configuration check is described as follows:
CEPHADM_CHECK_KERNEL_LSM
Each host within the storage cluster is expected to operate within the same Linux Security Module (LSM) state. For example, if the majority of the hosts are running with SELINUX in enforcing mode, any host not running in this mode would be flagged as an anomaly and a healthcheck with a warning state is raised.
CEPHADM_CHECK_SUBSCRIPTION
This check relates to the status of the vendor subscription. This check is only performed for hosts using Red Hat Enterprise Linux, but helps to confirm that all the hosts are covered by an active subscription so that patches and updates are available.
CEPHADM_CHECK_PUBLIC_MEMBERSHIP
All members of the cluster should have NICs configured on at least one of the public network subnets. Hosts that are not on the public network will rely on routing which may affect performance.
CEPHADM_CHECK_MTU
The maximum transmission unit (MTU) of the NICs on OSDs can be a key factor in consistent performance. This check examines hosts that are running OSD services to ensure that the MTU is configured consistently within the cluster. This is determined by establishing the MTU setting that the majority of hosts are using, with any anomalies resulting in a Ceph healthcheck.
CEPHADM_CHECK_LINKSPEED
Similar to the MTU check, linkspeed consistency is also a factor in consistent cluster performance. This check determines the linkspeed shared by the majority of the OSD hosts, resulting in a healthcheck for any hosts that are set at a lower linkspeed rate.
CEPHADM_CHECK_NETWORK_MISSING
The public_network and cluster_network settings support subnet definitions for IPv4 and IPv6. If these settings are not found on any host in the storage cluster a healthcheck is raised.
CEPHADM_CHECK_CEPH_RELEASE
Under normal operations, the Ceph cluster should be running daemons under the same Ceph release, for example all Red Hat Ceph Storage cluster 5 releases. This check looks at the active release for each daemon, and reports any anomalies as a healthcheck. This check is bypassed if an upgrade process is active within the cluster.
CEPHADM_CHECK_KERNEL_VERSION
The OS kernel version is checked for consistency across the hosts. Once again, the majority of the hosts is used as the basis of identifying anomalies.
Chapter 15. Managing a Red Hat Ceph Storage cluster using cephadm-ansible modules
As a storage administrator, you can use cephadm-ansible modules in Ansible playbooks to administer your Red Hat Ceph Storage cluster. The cephadm-ansible package provides several modules that wrap cephadm calls to let you write your own unique Ansible playbooks to administer your cluster.
At this time, cephadm-ansible modules only support the most important tasks. Any operation not covered by cephadm-ansible modules must be completed using either the command or shell Ansible modules in your playbooks.
15.1. The cephadm-ansible modules
The cephadm-ansible modules are a collection of modules that simplify writing Ansible playbooks by providing a wrapper around cephadm and ceph orch commands. You can use the modules to write your own unique Ansible playbooks to administer your cluster using one or more of the modules.
The cephadm-ansible package includes the following modules:
-
cephadm_bootstrap -
ceph_orch_host -
ceph_config -
ceph_orch_apply -
ceph_orch_daemon -
cephadm_registry_login
15.2. The cephadm-ansible modules options
The following tables list the available options for the cephadm-ansible modules. Options listed as required need to be set when using the modules in your Ansible playbooks. Options listed with a default value of true indicate that the option is automatically set when using the modules and you do not need to specify it in your playbook. For example, for the cephadm_bootstrap module, the Ceph Dashboard is installed unless you set dashboard: false.
Table 15.1. Available options for the cephadm_bootstrap module.
cephadm_bootstrap | Description | Required | Default |
|---|---|---|---|
|
| Ceph Monitor IP address. | true | |
|
| Ceph container image. | false | |
|
|
Use | false | |
|
| Define the Ceph FSID. | false | |
|
| Pull the Ceph container image. | false | true |
|
| Deploy the Ceph Dashboard. | false | true |
|
| Specify a specific Ceph Dashboard user. | false | |
|
| Ceph Dashboard password. | false | |
|
| Deploy the monitoring stack. | false | true |
|
| Manage firewall rules with firewalld. | false | true |
|
| Allow overwrite of existing --output-config, --output-keyring, or --output-pub-ssh-key files. | false | false |
|
| URL for custom registry. | false | |
|
| Username for custom registry. | false | |
|
| Password for custom registry. | false | |
|
| JSON file with custom registry login information. | false | |
|
|
SSH user to use for | false | |
|
|
SSH config file path for | false | |
|
| Allow hostname that is a fully-qualified domain name (FQDN). | false | false |
|
| Subnet to use for cluster replication, recovery and heartbeats. | false |
Table 15.2. Available options for the ceph_orch_host module.
ceph_orch_host | Description | Required | Default |
|---|---|---|---|
|
| The FSID of the Ceph cluster to interact with. | false | |
|
| The Ceph container image to use. | false | |
|
| Name of the host to add, remove, or update. | true | |
|
| IP address of the host. |
true when | |
|
|
Set the | false | false |
|
| The list of labels to apply to the host. | false | [] |
|
|
If set to | false | present |
Table 15.3. Available options for the ceph_config module
ceph_config | Description | Required | Default |
|---|---|---|---|
|
| The FSID of the Ceph cluster to interact with. | false | |
|
| The Ceph container image to use. | false | |
|
|
Whether to | false | set |
|
| Which daemon to set the configuration to. | true | |
|
|
Name of the parameter to | true | |
|
| Value of the parameter to set. |
true if action is |
Table 15.4. Available options for the ceph_orch_apply module.
ceph_orch_apply | Description | Required |
|---|---|---|
|
| The FSID of the Ceph cluster to interact with. | false |
|
| The Ceph container image to use. | false |
|
| The service specification to apply. | true |
Table 15.5. Available options for the ceph_orch_daemon module.
ceph_orch_daemon | Description | Required |
|---|---|---|
|
| The FSID of the Ceph cluster to interact with. | false |
|
| The Ceph container image to use. | false |
|
|
The desired state of the service specified in | true
If
If
If |
|
| The ID of the service. | true |
|
| The type of service. | true |
Table 15.6. Available options for the cephadm_registry_login module
cephadm_registry_login | Description | Required | Default |
|---|---|---|---|
|
| Login or logout of a registry. | false | login |
|
|
Use | false | |
|
| The URL for custom registry. | false | |
|
| Username for custom registry. |
| |
|
| Password for custom registry. |
| |
|
| The path to a JSON file. This file must be present on remote hosts prior to running this task. This option is currently not supported. |
15.3. Bootstrapping a storage cluster using the cephadm_bootstrap and cephadm_registry_login modules
As a storage administrator, you can bootstrap a storage cluster using Ansible by using the cephadm_bootstrap and cephadm_registry_login modules in your Ansible playbook.
Prerequisites
- An IP address for the first Ceph Monitor container, which is also the IP address for the first node in the storage cluster.
-
Login access to
registry.redhat.io. -
A minimum of 10 GB of free space for
/var/lib/containers/. -
Red Hat Enterprise Linux 9.0 or later with
ansible-corebundled into AppStream. -
Installation of the
cephadm-ansiblepackage on the Ansible administration node. - Passwordless SSH is set up on all hosts in the storage cluster.
- Hosts are registered with CDN.
Procedure
- Log in to the Ansible administration node.
Navigate to the
/usr/share/cephadm-ansibledirectory on the Ansible administration node:Example
[ceph-admin@admin ~]$ cd /usr/share/cephadm-ansible
Create the
hostsfile and add hosts, labels, and monitor IP address of the first host in the storage cluster:Syntax
sudo vi INVENTORY_FILE

HOST1 labels="['LABEL1', 'LABEL2']"
HOST2 labels="['LABEL1', 'LABEL2']"
HOST3 labels="['LABEL1']"

[admin]
ADMIN_HOST monitor_address=MONITOR_IP_ADDRESS labels="['ADMIN_LABEL', 'LABEL1', 'LABEL2']"
Example
[ceph-admin@admin cephadm-ansible]$ sudo vi hosts

host02 labels="['mon', 'mgr']"
host03 labels="['mon', 'mgr']"
host04 labels="['osd']"
host05 labels="['osd']"
host06 labels="['osd']"

[admin]
host01 monitor_address=10.10.128.68 labels="['_admin', 'mon', 'mgr']"
Run the preflight playbook:
Syntax
ansible-playbook -i INVENTORY_FILE cephadm-preflight.yml --extra-vars "ceph_origin=rhcs"Example
[ceph-admin@admin cephadm-ansible]$ ansible-playbook -i hosts cephadm-preflight.yml --extra-vars "ceph_origin=rhcs"
Create a playbook to bootstrap your cluster:
Syntax
sudo vi PLAYBOOK_FILENAME.yml

---
- name: NAME_OF_PLAY
  hosts: BOOTSTRAP_HOST
  become: USE_ELEVATED_PRIVILEGES
  gather_facts: GATHER_FACTS_ABOUT_REMOTE_HOSTS
  tasks:
    -name: NAME_OF_TASK
     cephadm_registry_login:
       state: STATE
       registry_url: REGISTRY_URL
       registry_username: REGISTRY_USER_NAME
       registry_password: REGISTRY_PASSWORD

    - name: NAME_OF_TASK
      cephadm_bootstrap:
        mon_ip: "{{ monitor_address }}"
        dashboard_user: DASHBOARD_USER
        dashboard_password: DASHBOARD_PASSWORD
        allow_fqdn_hostname: ALLOW_FQDN_HOSTNAME
        cluster_network: NETWORK_CIDR
Example
[ceph-admin@admin cephadm-ansible]$ sudo vi bootstrap.yml

---
- name: bootstrap the cluster
  hosts: host01
  become: true
  gather_facts: false
  tasks:
    - name: login to registry
      cephadm_registry_login:
        state: login
        registry_url: registry.redhat.io
        registry_username: user1
        registry_password: mypassword1

    - name: bootstrap initial cluster
      cephadm_bootstrap:
        mon_ip: "{{ monitor_address }}"
        dashboard_user: mydashboarduser
        dashboard_password: mydashboardpassword
        allow_fqdn_hostname: true
        cluster_network: 10.10.128.0/28
Run the playbook:
Syntax
ansible-playbook -i INVENTORY_FILE PLAYBOOK_FILENAME.yml -vvv
Example
[ceph-admin@admin cephadm-ansible]$ ansible-playbook -i hosts bootstrap.yml -vvv
Verification
- Review the Ansible output after running the playbook.
15.4. Adding or removing hosts using the ceph_orch_host module
As a storage administrator, you can add and remove hosts in your storage cluster by using the ceph_orch_host module in your Ansible playbook.
Prerequisites
- A running Red Hat Ceph Storage cluster.
- Register the nodes to the CDN and attach subscriptions.
- Ansible user with sudo and passwordless SSH access to all nodes in the storage cluster.
-
Installation of the
cephadm-ansiblepackage on the Ansible administration node. - New hosts have the storage cluster’s public SSH key. For more information about copying the storage cluster’s public SSH keys to new hosts, see Adding hosts in the Red Hat Ceph Storage Installation Guide.
Procedure
Use the following procedure to add new hosts to the cluster:
- Log in to the Ansible administration node.
Navigate to the
/usr/share/cephadm-ansibledirectory on the Ansible administration node:Example
[ceph-admin@admin ~]$ cd /usr/share/cephadm-ansible
Add the new hosts and labels to the Ansible inventory file.
Syntax
sudo vi INVENTORY_FILE

NEW_HOST1 labels="['LABEL1', 'LABEL2']"
NEW_HOST2 labels="['LABEL1', 'LABEL2']"
NEW_HOST3 labels="['LABEL1']"

[admin]
ADMIN_HOST monitor_address=MONITOR_IP_ADDRESS labels="['ADMIN_LABEL', 'LABEL1', 'LABEL2']"
Example
[ceph-admin@admin cephadm-ansible]$ sudo vi hosts

host02 labels="['mon', 'mgr']"
host03 labels="['mon', 'mgr']"
host04 labels="['osd']"
host05 labels="['osd']"
host06 labels="['osd']"

[admin]
host01 monitor_address= 10.10.128.68 labels="['_admin', 'mon', 'mgr']"
NoteIf you have previously added the new hosts to the Ansible inventory file and ran the preflight playbook on the hosts, skip to step 3.
Run the preflight playbook with the
--limitoption:Syntax
ansible-playbook -i INVENTORY_FILE cephadm-preflight.yml --extra-vars "ceph_origin=rhcs" --limit NEWHOST
Example
[ceph-admin@admin cephadm-ansible]$ ansible-playbook -i hosts cephadm-preflight.yml --extra-vars "ceph_origin=rhcs" --limit host02
The preflight playbook installs
podman,lvm2,chronyd, andcephadmon the new host. After installation is complete,cephadmresides in the/usr/sbin/directory.Create a playbook to add the new hosts to the cluster:
Syntax
sudo vi PLAYBOOK_FILENAME.yml

---
- name: PLAY_NAME
  hosts: HOSTS_OR_HOST_GROUPS
  become: USE_ELEVATED_PRIVILEGES
  gather_facts: GATHER_FACTS_ABOUT_REMOTE_HOSTS
  tasks:
    - name: NAME_OF_TASK
      ceph_orch_host:
        name: "{{ ansible_facts['hostname'] }}"
        address: "{{ ansible_facts['default_ipv4']['address'] }}"
        labels: "{{ labels }}"
      delegate_to: HOST_TO_DELEGATE_TASK_TO

    - name: NAME_OF_TASK
      when: inventory_hostname in groups['admin']
      ansible.builtin.shell:
        cmd: CEPH_COMMAND_TO_RUN
      register: REGISTER_NAME

    - name: NAME_OF_TASK
      when: inventory_hostname in groups['admin']
      debug:
        msg: "{{ REGISTER_NAME.stdout }}"
NoteBy default, Ansible executes all tasks on the host that matches the
hostsline of your playbook. Theceph orchcommands must run on the host that contains the admin keyring and the Ceph configuration file. Use thedelegate_tokeyword to specify the admin host in your cluster.Example
[ceph-admin@admin cephadm-ansible]$ sudo vi add-hosts.yml

---
- name: add additional hosts to the cluster
  hosts: all
  become: true
  gather_facts: true
  tasks:
    - name: add hosts to the cluster
      ceph_orch_host:
        name: "{{ ansible_facts['hostname'] }}"
        address: "{{ ansible_facts['default_ipv4']['address'] }}"
        labels: "{{ labels }}"
      delegate_to: host01

    - name: list hosts in the cluster
      when: inventory_hostname in groups['admin']
      ansible.builtin.shell:
        cmd: ceph orch host ls
      register: host_list

    - name: print current list of hosts
      when: inventory_hostname in groups['admin']
      debug:
        msg: "{{ host_list.stdout }}"
In this example, the playbook adds the new hosts to the cluster and displays a current list of hosts.
Run the playbook to add additional hosts to the cluster:
Syntax
ansible-playbook -i INVENTORY_FILE PLAYBOOK_FILENAME.yml
Example
[ceph-admin@admin cephadm-ansible]$ ansible-playbook -i hosts add-hosts.yml
Use the following procedure to remove hosts from the cluster:
- Log in to the Ansible administration node.
Navigate to the
/usr/share/cephadm-ansibledirectory on the Ansible administration node:Example
[ceph-admin@admin ~]$ cd /usr/share/cephadm-ansible
Create a playbook to remove a host or hosts from the cluster:
Syntax
sudo vi PLAYBOOK_FILENAME.yml

---
- name: NAME_OF_PLAY
  hosts: ADMIN_HOST
  become: USE_ELEVATED_PRIVILEGES
  gather_facts: GATHER_FACTS_ABOUT_REMOTE_HOSTS
  tasks:
    - name: NAME_OF_TASK
      ceph_orch_host:
        name: HOST_TO_REMOVE
        state: STATE

    - name: NAME_OF_TASK
      ceph_orch_host:
        name: HOST_TO_REMOVE
        state: STATE
      retries: NUMBER_OF_RETRIES
      delay: DELAY
      until: CONTINUE_UNTIL
      register: REGISTER_NAME

    - name: NAME_OF_TASK
      ansible.builtin.shell:
        cmd: ceph orch host ls
      register: REGISTER_NAME

    - name: NAME_OF_TASK
        debug:
          msg: "{{ REGISTER_NAME.stdout }}"
Example
[ceph-admin@admin cephadm-ansible]$ sudo vi remove-hosts.yml

---
- name: remove host
  hosts: host01
  become: true
  gather_facts: true
  tasks:
    - name: drain host07
      ceph_orch_host:
        name: host07
        state: drain

    - name: remove host from the cluster
      ceph_orch_host:
        name: host07
        state: absent
      retries: 20
      delay: 1
      until: result is succeeded
      register: result

     - name: list hosts in the cluster
       ansible.builtin.shell:
         cmd: ceph orch host ls
       register: host_list

     - name: print current list of hosts
       debug:
         msg: "{{ host_list.stdout }}"
In this example, the playbook tasks drain all daemons on
host07, removes the host from the cluster, and displays a current list of hosts.Run the playbook to remove host from the cluster:
Syntax
ansible-playbook -i INVENTORY_FILE PLAYBOOK_FILENAME.yml
Example
[ceph-admin@admin cephadm-ansible]$ ansible-playbook -i hosts remove-hosts.yml
Verification
Review the Ansible task output displaying the current list of hosts in the cluster:
Example
TASK [print current hosts] ******************************************************************************************************
Friday 24 June 2022  14:52:40 -0400 (0:00:03.365)       0:02:31.702 ***********
ok: [host01] =>
  msg: |-
    HOST    ADDR           LABELS          STATUS
    host01  10.10.128.68   _admin mon mgr
    host02  10.10.128.69   mon mgr
    host03  10.10.128.70   mon mgr
    host04  10.10.128.71   osd
    host05  10.10.128.72   osd
    host06  10.10.128.73   osd
15.5. Setting configuration options using the ceph_config module
As a storage administrator, you can set or get Red Hat Ceph Storage configuration options using the ceph_config module.
Prerequisites
- A running Red Hat Ceph Storage cluster.
- Ansible user with sudo and passwordless SSH access to all nodes in the storage cluster.
-
Installation of the
cephadm-ansiblepackage on the Ansible administration node. - The Ansible inventory file contains the cluster and admin hosts.
Procedure
- Log in to the Ansible administration node.
Navigate to the
/usr/share/cephadm-ansibledirectory on the Ansible administration node:Example
[ceph-admin@admin ~]$ cd /usr/share/cephadm-ansible
Create a playbook with configuration changes:
Syntax
sudo vi PLAYBOOK_FILENAME.yml

---
- name: PLAY_NAME
  hosts: ADMIN_HOST
  become: USE_ELEVATED_PRIVILEGES
  gather_facts: GATHER_FACTS_ABOUT_REMOTE_HOSTS
  tasks:
    - name: NAME_OF_TASK
      ceph_config:
        action: GET_OR_SET
        who: DAEMON_TO_SET_CONFIGURATION_TO
        option: CEPH_CONFIGURATION_OPTION
        value: VALUE_OF_PARAMETER_TO_SET

    - name: NAME_OF_TASK
      ceph_config:
        action: GET_OR_SET
        who: DAEMON_TO_SET_CONFIGURATION_TO
        option: CEPH_CONFIGURATION_OPTION
      register: REGISTER_NAME

    - name: NAME_OF_TASK
      debug:
        msg: "MESSAGE_TO_DISPLAY {{ REGISTER_NAME.stdout }}"
Example
[ceph-admin@admin cephadm-ansible]$ sudo vi change_configuration.yml

---
- name: set pool delete
  hosts: host01
  become: true
  gather_facts: false
  tasks:
    - name: set the allow pool delete option
      ceph_config:
        action: set
        who: mon
        option: mon_allow_pool_delete
        value: true

    - name: get the allow pool delete setting
      ceph_config:
        action: get
        who: mon
        option: mon_allow_pool_delete
      register: verify_mon_allow_pool_delete

    - name: print current mon_allow_pool_delete setting
      debug:
        msg: "the value of 'mon_allow_pool_delete' is {{ verify_mon_allow_pool_delete.stdout }}"
In this example, the playbook first sets the
mon_allow_pool_deleteoption tofalse. The playbook then gets the currentmon_allow_pool_deletesetting and displays the value in the Ansible output.Run the playbook:
Syntax
ansible-playbook -i INVENTORY_FILE _PLAYBOOK_FILENAME.ymlExample
[ceph-admin@admin cephadm-ansible]$ ansible-playbook -i hosts change_configuration.yml
Verification
Review the output from the playbook tasks.
Example
TASK [print current mon_allow_pool_delete setting] *************************************************************
Wednesday 29 June 2022  13:51:41 -0400 (0:00:05.523)       0:00:17.953 ********
ok: [host01] =>
  msg: the value of 'mon_allow_pool_delete' is true
Additional Resources
- See the Red Hat Ceph Storage Configuration Guide for more details on configuration options.
15.6. Applying a service specification using the ceph_orch_apply module
As a storage administrator, you can apply service specifications to your storage cluster using the ceph_orch_apply module in your Ansible playbooks. A service specification is a data structure to specify the service attributes and configuration settings that is used to deploy the Ceph service. You can use a service specification to deploy Ceph service types like mon, crash, mds, mgr, osd, rdb, or rbd-mirror.
Prerequisites
- A running Red Hat Ceph Storage cluster.
- Ansible user with sudo and passwordless SSH access to all nodes in the storage cluster.
-
Installation of the
cephadm-ansiblepackage on the Ansible administration node. - The Ansible inventory file contains the cluster and admin hosts.
Procedure
- Log in to the Ansible administration node.
Navigate to the
/usr/share/cephadm-ansibledirectory on the Ansible administration node:Example
[ceph-admin@admin ~]$ cd /usr/share/cephadm-ansible
Create a playbook with the service specifications:
Syntax
sudo vi PLAYBOOK_FILENAME.yml

---
- name: PLAY_NAME
  hosts: HOSTS_OR_HOST_GROUPS
  become: USE_ELEVATED_PRIVILEGES
  gather_facts: GATHER_FACTS_ABOUT_REMOTE_HOSTS
  tasks:
    - name: NAME_OF_TASK
      ceph_orch_apply:
        spec: |
          service_type: SERVICE_TYPE
          service_id: UNIQUE_NAME_OF_SERVICE
          placement:
            host_pattern: 'HOST_PATTERN_TO_SELECT_HOSTS'
            label: LABEL
          spec:
            SPECIFICATION_OPTIONS:
Example
[ceph-admin@admin cephadm-ansible]$ sudo vi deploy_osd_service.yml

---
- name: deploy osd service
  hosts: host01
  become: true
  gather_facts: true
  tasks:
    - name: apply osd spec
      ceph_orch_apply:
        spec: |
          service_type: osd
          service_id: osd
          placement:
            host_pattern: '*'
            label: osd
          spec:
            data_devices:
              all: true
In this example, the playbook deploys the Ceph OSD service on all hosts with the label
osd.Run the playbook:
Syntax
ansible-playbook -i INVENTORY_FILE _PLAYBOOK_FILENAME.ymlExample
[ceph-admin@admin cephadm-ansible]$ ansible-playbook -i hosts deploy_osd_service.yml
Verification
- Review the output from the playbook tasks.
Additional Resources
- See the Red Hat Ceph Storage Operations Guide for more details on service specification options.
15.7. Managing Ceph daemon states using the ceph_orch_daemon module
As a storage administrator, you can start, stop, and restart Ceph daemons on hosts using the ceph_orch_daemon module in your Ansible playbooks.
Prerequisites
- A running Red Hat Ceph Storage cluster.
- Ansible user with sudo and passwordless SSH access to all nodes in the storage cluster.
-
Installation of the
cephadm-ansiblepackage on the Ansible administration node. - The Ansible inventory file contains the cluster and admin hosts.
Procedure
- Log in to the Ansible administration node.
Navigate to the
/usr/share/cephadm-ansibledirectory on the Ansible administration node:Example
[ceph-admin@admin ~]$ cd /usr/share/cephadm-ansible
Create a playbook with daemon state changes:
Syntax
sudo vi PLAYBOOK_FILENAME.yml

---
- name: PLAY_NAME
  hosts: ADMIN_HOST
  become: USE_ELEVATED_PRIVILEGES
  gather_facts: GATHER_FACTS_ABOUT_REMOTE_HOSTS
  tasks:
    - name: NAME_OF_TASK
      ceph_orch_daemon:
        state: STATE_OF_SERVICE
        daemon_id: DAEMON_ID
        daemon_type: TYPE_OF_SERVICE
Example
[ceph-admin@admin cephadm-ansible]$ sudo vi restart_services.yml

---
- name: start and stop services
  hosts: host01
  become: true
  gather_facts: false
  tasks:
    - name: start osd.0
      ceph_orch_daemon:
        state: started
        daemon_id: 0
        daemon_type: osd

    - name: stop mon.host02
      ceph_orch_daemon:
        state: stopped
        daemon_id: host02
        daemon_type: mon
In this example, the playbook starts the OSD with an ID of
0and stops a Ceph Monitor with an id ofhost02.Run the playbook:
Syntax
ansible-playbook -i INVENTORY_FILE _PLAYBOOK_FILENAME.ymlExample
[ceph-admin@admin cephadm-ansible]$ ansible-playbook -i hosts restart_services.yml
Verification
- Review the output from the playbook tasks.
Appendix A. The mClock configuration options
This section contains the list of mClock configuration options:
osd_mclock_profile- Description
It sets the type of mClock profile to use for providing the quality of service (QoS) based on operations belonging to different classes, such as background recovery,
backfill,pg scrub,snap trim,client op, andpg deletion.Once a built-in profile is enabled, the lower-level mClock resource control parameters, that is reservation, weight, and limit, and some Ceph configuration parameters are set transparently. This does not apply for the custom profile.
- Type
- String
- Default
-
balanced - Valid choices
-
balanced,high_recovery_ops,high_client_ops,custom
osd_mclock_max_capacity_iops_hdd- Description
-
It sets a maximum random write IOPS capacity, at 4 KiB block size, to consider per OSD for rotational media. Contributes in QoS calculations when enabling a dmclock profile. It is only considered for
osd_op_queue = mclock_scheduler - Type
- Float
- Default
-
315.0
osd_mclock_max_capacity_iops_ssd- Description
- It sets a maximum random write IOPS capacity, at 4 KiB block size, to consider per OSD for solid state media.
- Type
- Float
- Default
-
21500.0
osd_mclock_cost_per_byte_usec_ssd- Description
-
Indicates cost per byte in microseconds to consider per OSD for SDDs.Contributes in QoS calculations when enabling a dmclock profile. It is only considered for
osd_op_queue = mclock_scheduler - Type
- Float
- Default
-
0.011
osd_mclock_max_sequential_bandwidth_hdd- Description
-
Indicates the maximum sequential bandwidth in bytes to consider for an OSD whose underlying device type is rotational media. This is considered by the mclock scheduler to derive the cost factor to be used in QoS calculations. Only considered for
osd_op_queue = mclock_scheduler - Type
- Size
- Default
-
150_M
osd_mclock_max_sequential_bandwidth_ssd- Description
-
Indicates the maximum sequential bandwidth in bytes to consider for an OSD whose underlying device type is solid state media. This is considered by the mclock scheduler to derive the cost factor to be used in QoS calculations. Only considered for
osd_op_queue = mclock_scheduler - Type
- Size
- Default
-
1200_M
osd_mclock_force_run_benchmark_on_init- Description
- This force-runs the OSD benchmark on OSD initialization or boot-up.
- Type
- Boolean
- Default
- False
- See also
-
osd_mclock_max_capacity_iops_hdd,osd_mclock_max_capacity_iops_ssd
osd_mclock_skip_benchmark- Description
- Setting this option skips the OSD benchmark on OSD initialization or boot-up.
- Type
- Boolean
- Default
- False
- See also
-
osd_mclock_max_capacity_iops_hdd,osd_mclock_max_capacity_iops_ssd
osd_mclock_override_recovery_settings- Description
-
Setting this option enables the override of the recovery or backfill limits for the mClock scheduler as defined by the
osd_recovery_max_active_hdd,osd_recovery_max_active_ssd, andosd_max_backfillsoptions. - Type
- Boolean
- Default
- False
- See also
-
osd_recovery_max_active_hdd,osd_recovery_max_active_ssd,osd_max_backfills
osd_mclock_iops_capacity_threshold_hdd- Description
- It indicates the threshold IOPS capacity, at 4KiB block size, beyond which to ignore the Ceph OSD bench results for an OSD for HDDs.
- Type
- Float
- Default
-
500.0
osd_mclock_iops_capacity_threshold_ssd- Description
- It indicates the threshold IOPS capacity, at 4KiB block size, beyond which to ignore the Ceph OSD bench results for an OSD for SSDs.
- Type
- Float
- Default
-
80000.0
osd_mclock_scheduler_client_res- Description
-
It is the default I/O proportion reserved for each client. The default value of
0specifies the lowest possible reservation. Any value greater than 0 and up to 1.0 specifies the minimum IO proportion to reserve for each client in terms of a fraction of the OSD’s maximum IOPS capacity. - Type
- float
- Default
-
0 - min
- 0
- max
- 1.0
osd_mclock_scheduler_client_wgt- Description
- It is the default I/O share for each client over reservation.
- Type
- Unsigned integer
- Default
-
1
osd_mclock_scheduler_client_lim- Description
-
It is the default I/O limit for each client over reservation. The default value of
0specifies no limit enforcement, which means each client can use the maximum possible IOPS capacity of the OSD. Any value greater than 0 and up to 1.0 specifies the upper IO limit over reservation that each client receives in terms of a fraction of the OSD’s maximum IOPS capacity. - Type
- float
- Default
-
0 - min
- 0
- max
- 1.0
osd_mclock_scheduler_background_recovery_res- Description
- It is the default I/O proportion reserved for background recovery. The default value of 0 specifies the lowest possible reservation. Any value greater than 0 and up to 1.0 specifies the minimum IO proportion to reserve for background recovery operations in terms of a fraction of the OSD’s maximum IOPS capacity.
- Type
- float
- Default
-
0 - min
- 0
- max
- 1.0
osd_mclock_scheduler_background_recovery_wgt- Description
- It indicates the I/O share for each background recovery over reservation.
- Type
- Unsigned integer
- Default
-
1
osd_mclock_scheduler_background_recovery_lim- Description
- It indicates the I/O limit for background recovery over reservation. The default value of 0 specifies no limit enforcement, which means background recovery operation can use the maximum possible IOPS capacity of the OSD. Any value greater than 0 and up to 1.0 specifies the upper IO limit over reservation that background recovery operation receives in terms of a fraction of the OSD’s maximum IOPS capacity.
- Type
- float
- Default
-
0 - min
- 0
- max
- 1.0
osd_mclock_scheduler_background_best_effort_res- Description
-
It indicates the default I/O proportion reserved for background
best_effort. The default value of 0 specifies the lowest possible reservation. Any value greater than 0 and up to 1.0 specifies the minimum IO proportion to reserve for background best_effort operations in terms of a fraction of the OSD’s maximum IOPS capacity. - Type
- float
- Default
-
0 - min
- 0
- max
- 1.0
osd_mclock_scheduler_background_best_effort_wgt- Description
-
It indicates the I/O share for each background
best_effortover reservation. - Type
- Unsigned integer
- Default
-
1
osd_mclock_scheduler_background_best_effort_lim- Description
-
It indicates the I/O limit for background
best_effortover reservation. The default value of 0 specifies no limit enforcement, which means background best_effort operation can use the maximum possible IOPS capacity of the OSD. Any value greater than 0 and up to 1.0 specifies the upper IO limit over reservation that background best_effort operation receives in terms of a fraction of the OSD’s maximum IOPS capacity. - Type
- float
- Default
-
0 - min
- 0
- max
- 1.0
Additional Resources
See Object Storage Daemon (OSD) configuration options for more details about osd_op_queue option.