
Monitoring Ceph with Datadog Guide
Guide on Monitoring Ceph with Datadog
Abstract
Chapter 1. Monitoring Datadog and Ceph
The Datadog integration with Ceph enables Datadog to execute and process the output from:
-
ceph status -
ceph health detail -
ceph df detail -
ceph osd perf; and, -
ceph osd pool stats.
The integration enables Datadog to:
- Monitor the status and health of the Red Hat Ceph Storage cluster.
- Monitor I/O and performance metrics.
- Track disk usage across storage pools.
Using Datadog
Using Datadog to monitor Ceph requires installing a Datadog agent on at least one Ceph monitor node. When monitoring Ceph, the Datadog agent will execute Ceph command line arguments. Consequently, each Ceph node must have an appropriate Ceph key providing access to the cluster, usually in /etc/ceph. Once the agent executes the Ceph command, it sends Red Hat Ceph Storage cluster status and statistics back to Datadog. Then, Datadog will present the status and statistics in the Datadog user interface.
Since Datadog uses an agent, the Red Hat Ceph Storage cluster must be able to reach the internet. However, the Red Hat Ceph Storage cluster does not have to be reachable from the internet.
Datadog supports retrieving ceph status with Red Hat Ceph Storage version 2 or higher. Datadog will provide an update to support ceph status for Red Hat Ceph Storage cluster 3 in a subsequent release of its dd-agent.
Red Hat works with our technology partners to provide this documentation as a service to our customers. However, Red Hat does not provide support for this product. If you need technical assistance for this product, then contact Datadog for support.
Chapter 2. Installing Datadog for Ceph integration
After installing the Datadog agent, configure the Datadog agent to report Ceph metrics to Datadog.
Prerequisites
- Root-level access to the Ceph monitor node.
- Appropriate Ceph key providing access to the Red Hat Ceph Storage cluster.
- Internet access.
Procedure
Install the Ceph integration.
- Log in to the Datadog App. The user interface will present navigation on the left side of the screen.
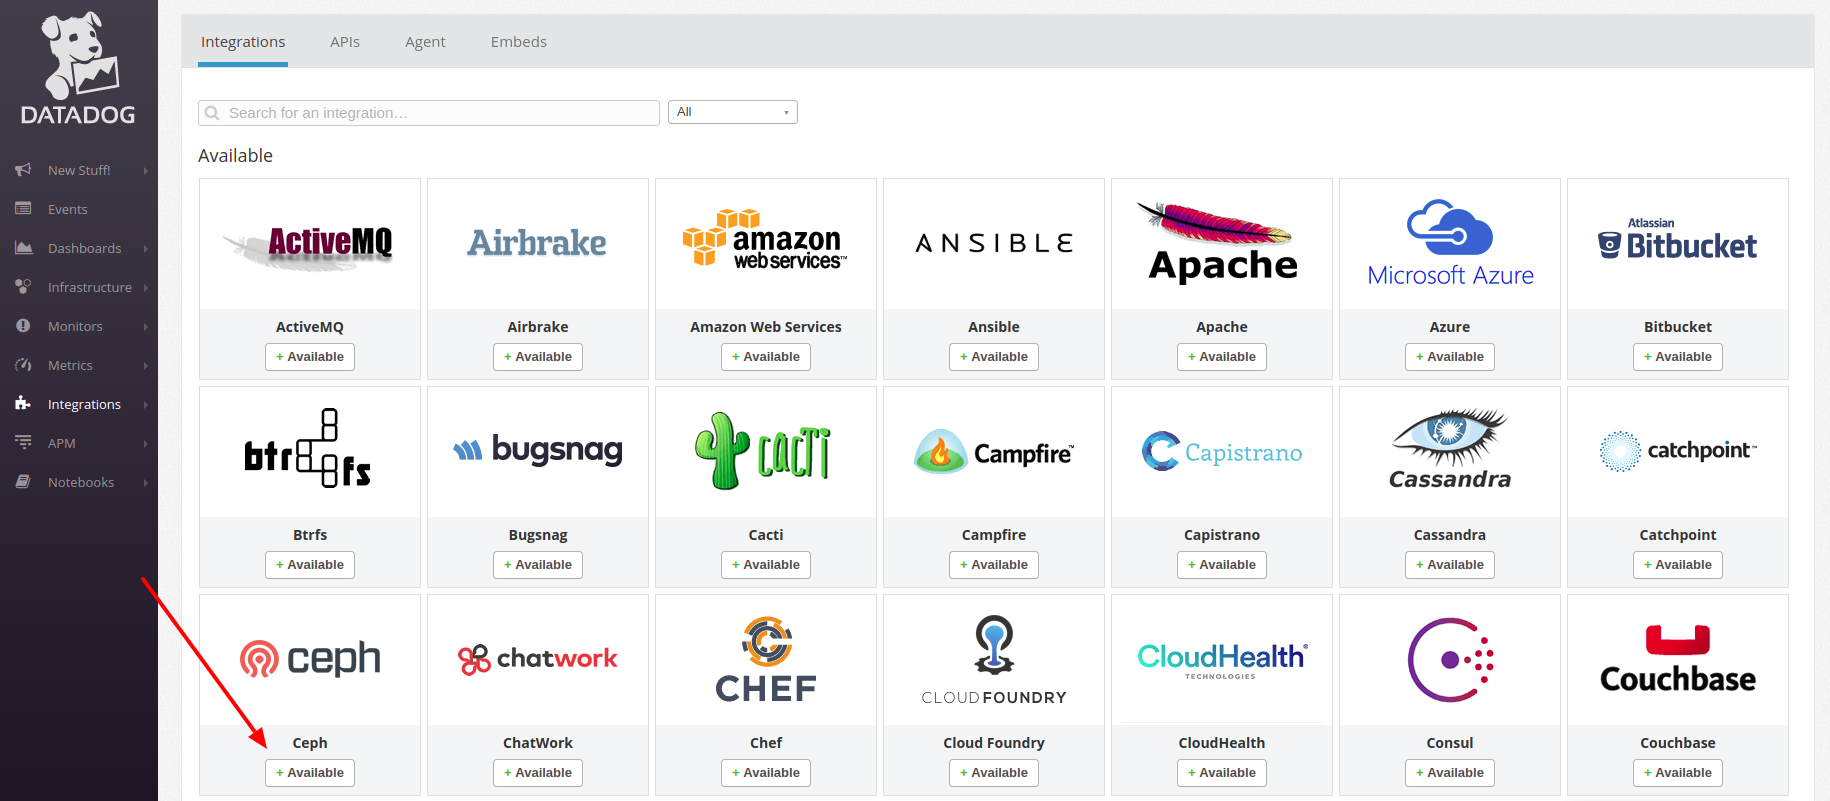
- Click Integrations.
- Either enter ceph into the search field or scroll to find the Ceph integration. The user interface will present whether the Ceph integration is available or already installed.
If it is available, click the button to install it.
Configuring the Datadog agent for Ceph
Navigate to the Datadog Agent configuration directory:
[root@mon ~]# cd /etc/dd-agent/conf.d
Create a
ceph.yamlfile from theceph.yml.samplefile:[root@mon ~]# cp ceph.yaml.example ceph.yaml
Modify the
ceph.yamlfile:[root@mon ~]# vim ceph.yaml
Example
The following is a sample of what the modified
ceph.yamlfile looks like.init_config: instances: # - tags: # - name:mars_cluster # # ceph_cmd: /usr/bin/ceph # ceph_cluster: ceph # # If your environment requires sudo, please add a line like: # dd-agent ALL=(ALL) NOPASSWD:/usr/bin/ceph # to your sudoers file, and uncomment the below option. # # use_sudo: True
Uncomment the
-tags,-name,ceph_command,ceph_cluster, anduse_sudo: Truelines. The default values forceph_commandandceph_clusterare/usr/bin/cephandcephrespectively.When complete, it will look like this:
init_config:

instances:
  - tags:
    - name:ceph-RHEL
#
    ceph_cmd: /usr/bin/ceph
    ceph_cluster: ceph
#
# If your environment requires sudo, please add a line like:
#          dd-agent ALL=(ALL) NOPASSWD:/usr/bin/ceph
# to your sudoers file, and uncomment the below option.
#
    use_sudo: True
Modify the sudoers file:
[root@mon ~]# visudo
Add the following line:
dd-agent ALL=(ALL) NOPASSWD:/usr/bin/ceph
Enable the Datadog agent so that it will restart if the Ceph host reboots:
[root@mon ~]# systemctl enable datadog-agent
Restart the Datadog agent:
[root@mon ~]# systemctl status datadog-agent
Chapter 3. Installing and configuring the Datadog agent for Ceph
Install the Datadog agent for Ceph and configure it to report back the Ceph data to the Datadog App.
Prerequisites
- Root-level access to the Ceph monitor node.
- Appropriate Ceph key providing access to the Red Hat Ceph Storage cluster.
- Internet access.
Procedure
- Log in to the Datadog App. The user interface will present navigation on the left side of the screen.
Click Integrations. To install the agent from the command line, click on the Agent tab at the top of the screen.
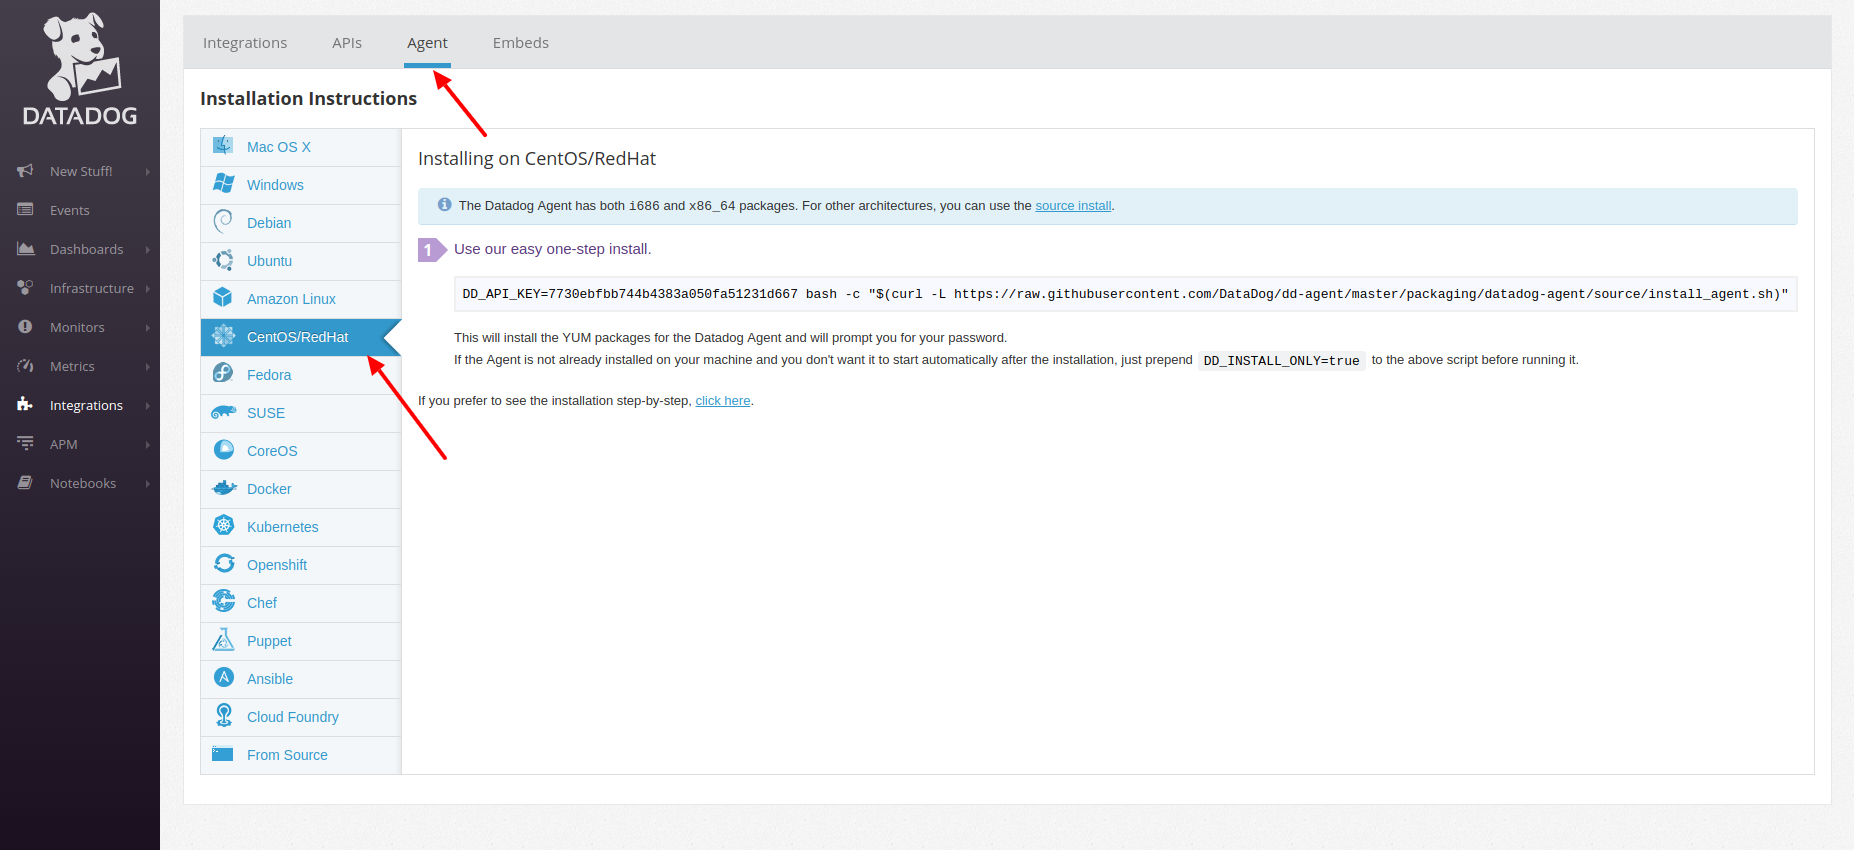
Open a command line and enter the one-step command line agent installation.
Example
[root@mon ~]# DD_API_KEY=KEY-STRING bash -c "$(curl -L https://raw.githubusercontent.com/DataDog/dd-agent/master/packaging/datadog-agent/source/install_agent.sh)"
Copy the example from the Datadog user interface, as the key differs from the example above and with each user account.
Chapter 4. Viewing the Ceph overview with Datadog
After installing and configuring the Datadog integration with Ceph, return to the Datadog App . The user interface will present navigation on the left side of the screen.
Prerequisites
- Internet access.
Procedure
Hover over Dashboards to expose the submenu and then click Ceph Overview.

Datadog presents an overview of the Ceph Storage Cluster.
- Click Dashboards→New Dashboard to create a custom Ceph dashboard.
Chapter 5. Ceph metrics for Datadog
The Datadog agent collects the following metrics from Ceph. These metrics may be included in custom dashboards and in alerts.
| Metric Name | Description |
|---|---|
|
| The time taken to commit an operation to the journal. |
|
| Time taken to flush an update to disks. |
|
| The number of I/O operations per second for given pool. |
|
| The bytes per second being read. |
|
| The bytes per second being written. |
|
| The number of known storage daemons. |
|
| The number of participating storage daemons. |
|
| The number of online storage daemons. |
|
| The number of placement groups available. |
|
| The number of monitor daemons. |
|
| The overall capacity usage metric. |
|
| The object count from the underlying object store. |
|
| The object count for a given pool. |
|
| The per-pool read bytes. |
|
| The per-pool write bytes. |
|
| The number of pools. |
|
|
The number of |
|
| The per-pool read operations per second. |
|
| The per-pool write operations per second. |
|
| The number of nearly full OSDs. |
|
| The number of full OSDs. |
|
| The percentage used of full or near-full OSDs. |
Chapter 6. Creating alerts in Datadog
Administrators can create monitors that track the metrics of the Red Hat Ceph Storage cluster and generate alerts. For example, if an OSD is down, Datadog can alert an administrator that one or more OSDs are down.
Prerequisites
- Root-level access to the Ceph Monitor node.
- Appropriate Ceph key providing access to the Red Hat Ceph Storage cluster.
- Internet access.
Procedure
Click Monitors to see an overview of the Datadog monitors.
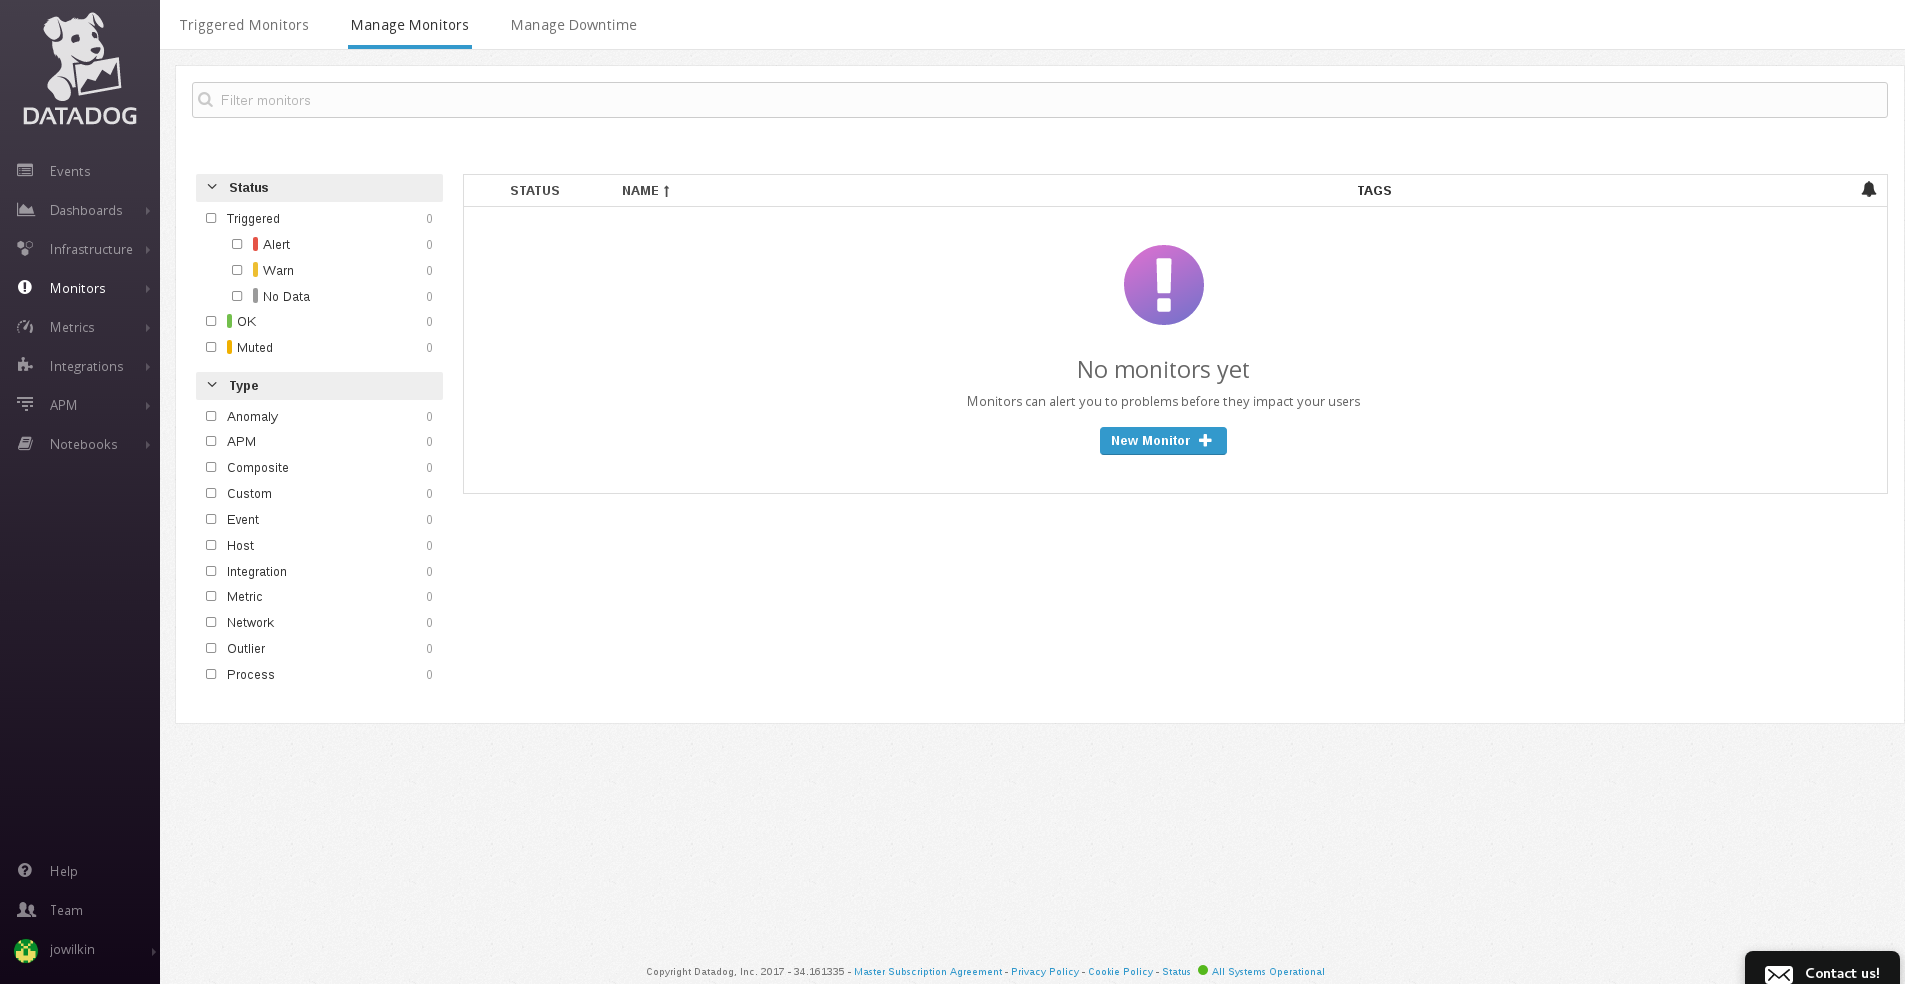
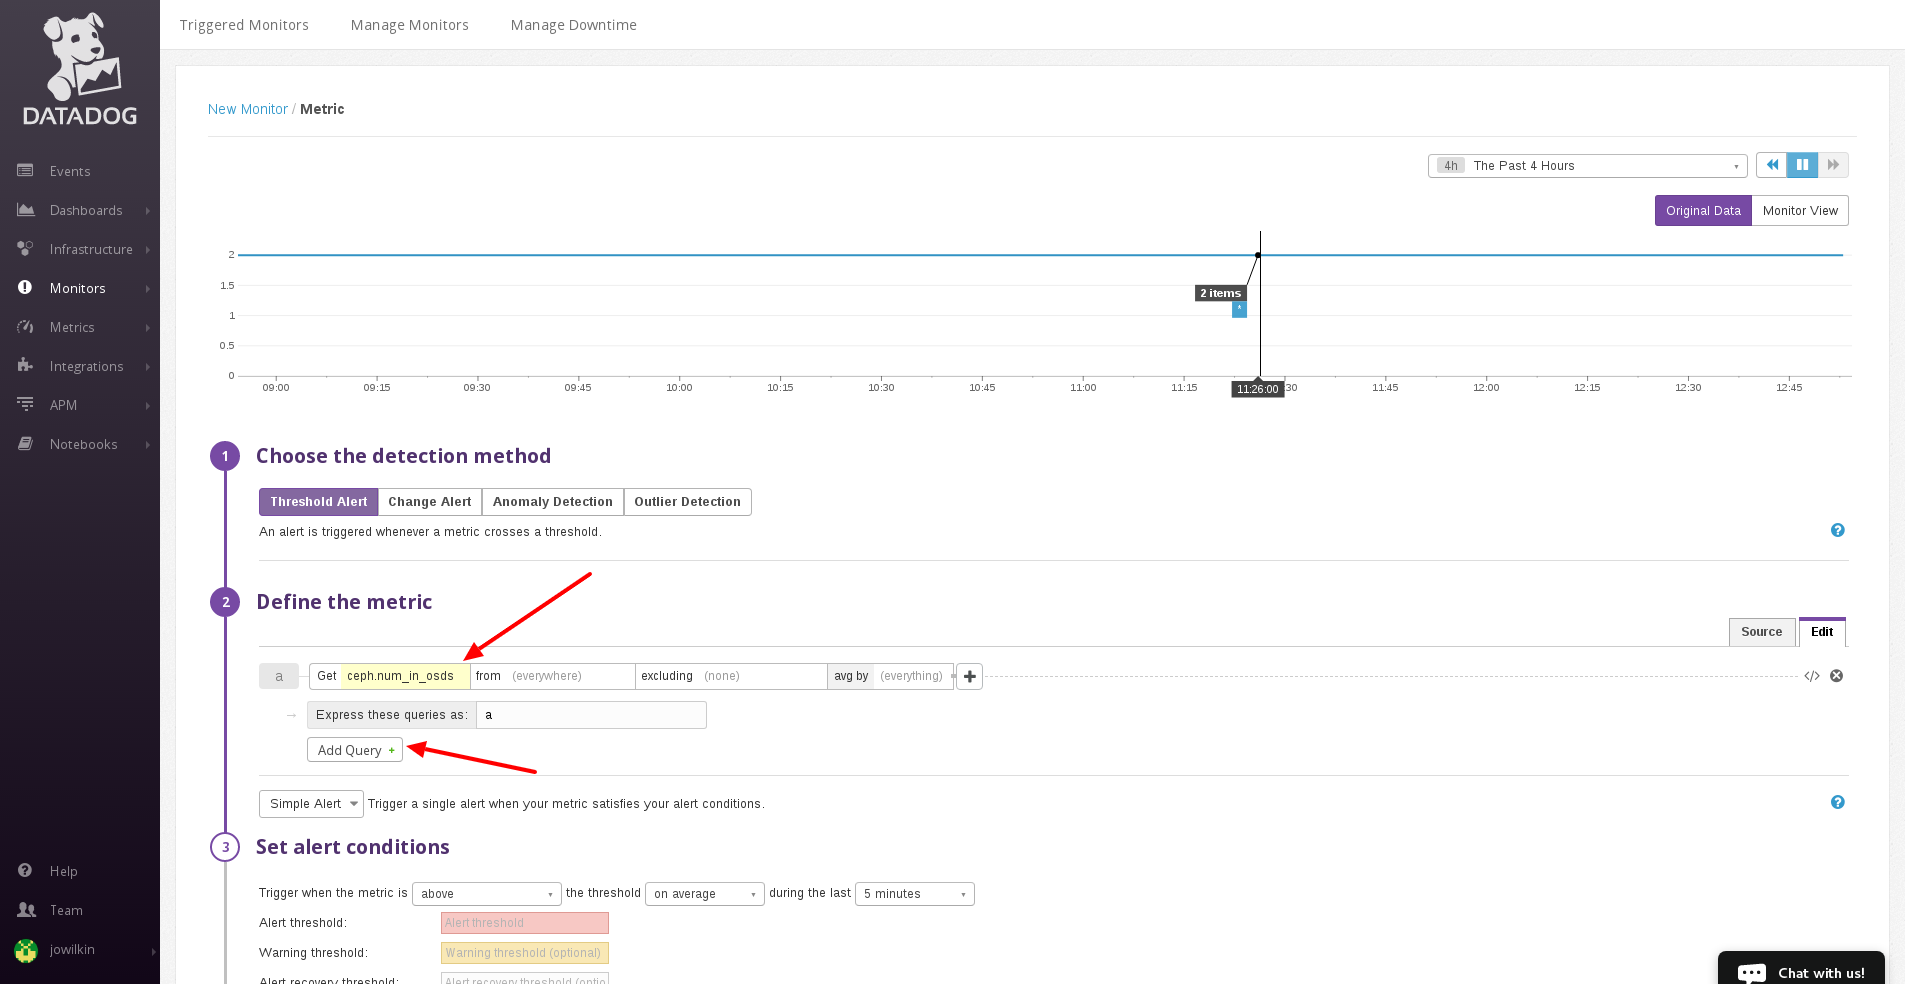
- To create a monitor, select Monitors→New Monitor.
Select the detection method. For example, "Threshold Alert."
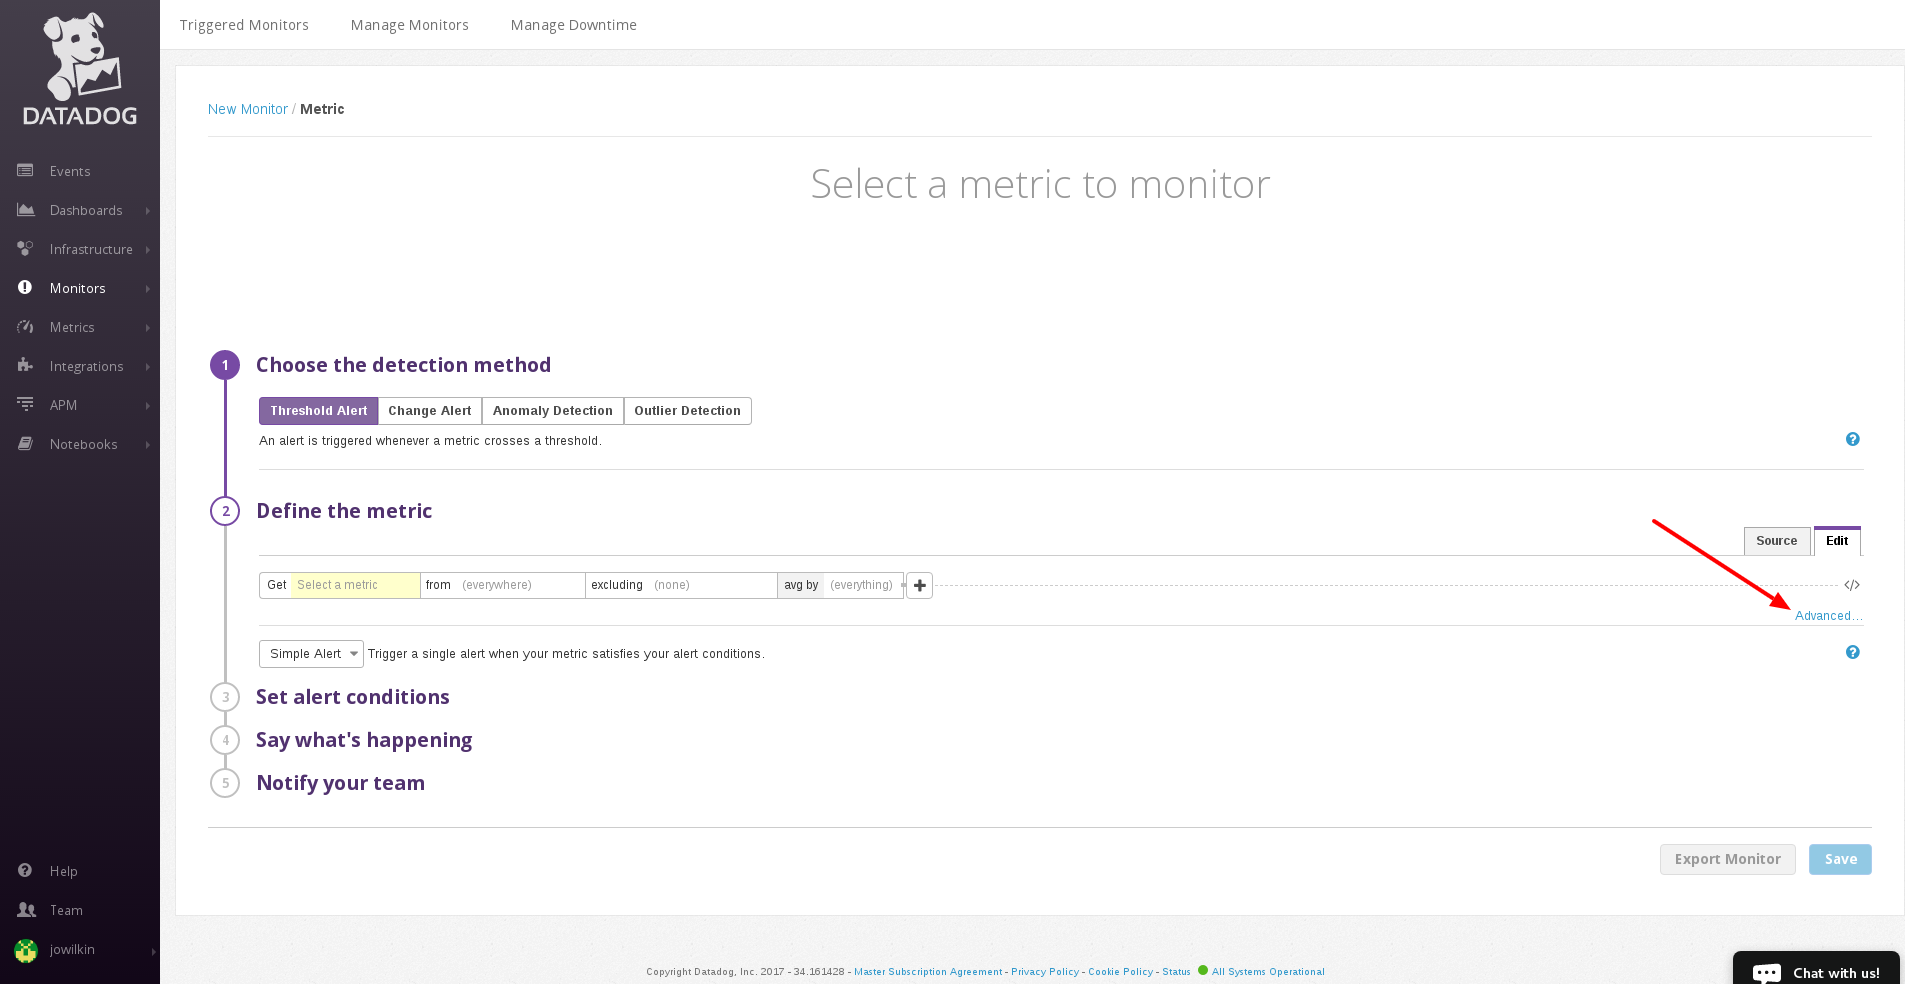
-
Define the metric. To create an advanced alert, click on the Advanced… link. Then, select a metric from the combo box. For example, select the
ceph.num_in_osdsCeph metric. Click Add Query+ to add another query.
Select another metric from the combo box. For example, select the
ceph.num_up_osdsCeph metric.
-
In the Express these queries as: field, enter
a-b, whereais the value ofceph.num_in_osdsandbis the value ofceph.num_up_osds. When the difference is1or greater, there is at least one OSD down. - Set the alert conditions. For example, set the trigger to be above or equal to, the threshold to in total and the time elapsed to 1 minute.
-
Set the Alert threshold field to
1. When at least one OSD is in the cluster and it is not up and running, the monitor will alert the user. - Give the monitor a title in the input field below Preview and Edit. This is required to save the monitor.
Enter a description of the alert in the text field.
 Note
NoteThe text field supports metric variables and Markdown syntax.
- Add the recipients of the alert. This will add an email address to the text field. When the alert gets triggered, the recipients will receive the alert.