
Chapter 9. Using Prometheus and Grafana to monitor the router network
Prometheus is container-native software built for storing historical data and for monitoring large, scalable systems such as AMQ Interconnect. It gathers data over an extended time, rather than just for the currently running session.
You use Prometheus and Alertmanager to monitor and store AMQ Interconnect data so that you can use a graphical tool, such as Grafana, to visualize and run queries on the data.
9.1. Setting up Prometheus and Grafana
Before you can view AMQ Interconnect dashboards, you must deploy and configure Prometheus, Alertmanager, and Grafana in the OpenShift project in which AMQ Interconnect is deployed. All of the required configuration files are provided in a GitHub repository.
Procedure
Clone the
qdr-monitoringGitHub repository.This repository contains example configuration files needed to set up Prometheus and Grafana to monitor AMQ Interconnect.
$ git clone https://github.com/interconnectedcloud/qdr-monitoring
Set the
NAMESPACEenvironment variable to the name of the project where you deployed AMQ Interconnect.For example, if you deployed AMQ Interconnect in the
exampleproject, set theNAMESPACEenvironment variable as follows:$ export NAMESPACE=example
Run the
deploy-monitoring.shscript.This script creates and configures the OpenShift resources needed to deploy Prometheus, Alertmanager, and Grafana in your OpenShift project. It also configures two dashboards that provide metrics for the router network.
$ ./deploy-monitoring.sh
An alternative method of running this script is to to specify the target project as a parameter. For example:
$ ./deploy-monitoring.sh example
Additional resources
- For more information about Prometheus, see the Prometheus documentation.
- For more information about Grafana, see the Grafana documentation.
9.2. Viewing AMQ Interconnect dashboards in Grafana
After setting up Prometheus and Grafana, you can visualize the AMQ Interconnect data on the following Grafana dashboards:
- Qpid Dispatch Router
- Shows metrics for:
- Qpid Dispatch Router
Shows metrics for:
-
Deliveries ingress -
Deliveries egress -
Deliveries ingress route container -
Deliveries egress route container -
Deliveries redirected to fallback destination -
Dropped presettled deliveries -
Presettled deliveries -
Auto links -
Link routes -
Address count -
Connection count -
Link count
-
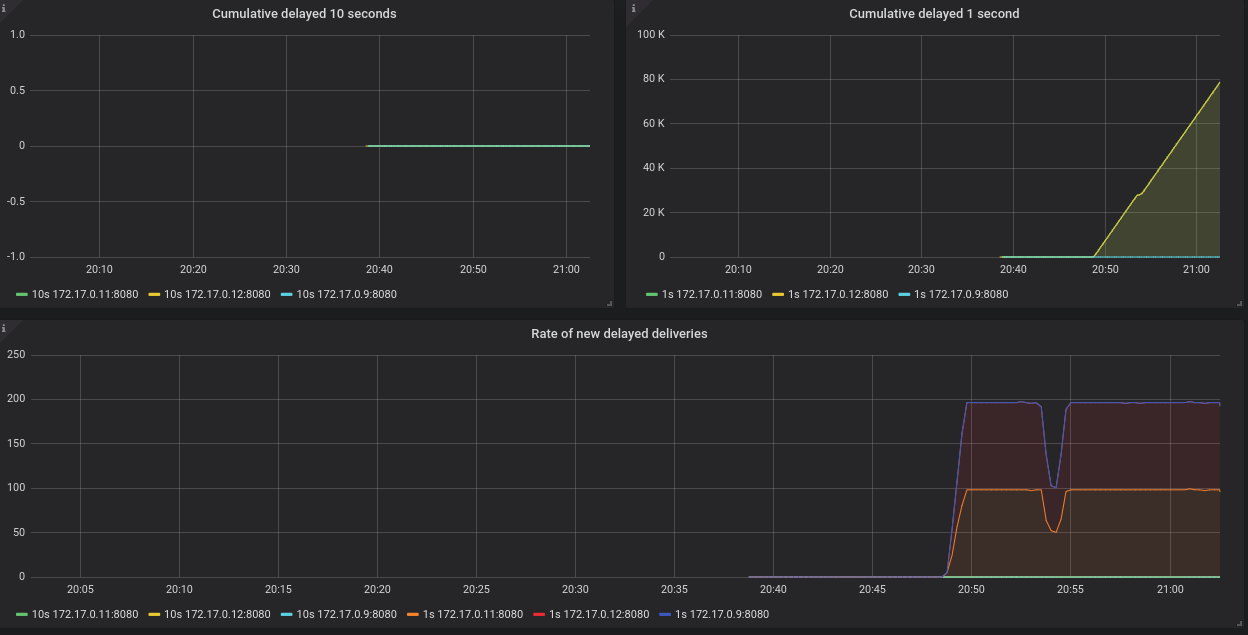
- Qpid Dispatch Router - Delayed Deliveries
Shows metrics for:
-
Cumulative delayed 10 seconds -
Cumulative delayed 1 second -
Rate of new delayed deliveries
-
For more information about these metrics, see Section 9.3, “Router metrics”.
Procedure
In the OpenShift web console, switch to → , and click the URL for the
grafanaRoute.The Grafana Log In page appears.
Enter your user name and password, and then click .
The default Grafana user name and password are both
admin. After logging in for the first time, you can change the password.On the top header, click the dashboard drop-down menu, and then select the
Qpid Dispatch RouterorQpid Dispatch Router - Delayed Deliveriesdashboard.Figure 9.1. Delayed Deliveries dashboard
9.3. Router metrics
The following metrics are available in Prometheus:
qdr_connections_total- The total number of network connections to the router. This includes connections from and to any AMQP route container.
qdr_links_total- The total number of incoming and outgoing links attached to the router.
qdr_addresses_total- The total number of addresses known to the router.
qdr_routers_total- The total number of routers known to the router.
qdr_link_routes_total- The total number of active and inactive link routes configured for the router. See Understanding link routing for more details.
qdr_auto_links_total- The total number of incoming and outgoing auto links configured for the router. See Configuring brokered messaging for more details about autolinks.
qdr_presettled_deliveries_total- The total number of presettled deliveries arriving at the router. The router settles the incoming deliveries and propagates the settlement to the message destination, also known as fire and forget.
qdr_dropped_presettled_deliveries_total- The total number of presettled deliveries that the router dropped due to congestion. The router settles the incoming deliveries and propagates the settlement to the message destination, also known as fire and forget.
qdr_accepted_deliveries_total- The total number of deliveries accepted at the router. See Understanding message routing for more information on accepted deliveries.
qdr_released_deliveries_total- The total number of deliveries released at the router. See Understanding message routing for more information on released deliveries.
qdr_rejected_deliveries_total- The total number of deliveries rejected at the router. See Understanding message routing for more information on rejected deliveries.
qdr_modified_deliveries_total- The total number of deliveries modified at the router. See Understanding message routing for more information on modified deliveries.
qdr_deliveries_ingress_total- The total number of messages delivered to the router from clients. This includes management messages, but not route control messages.
qdr_deliveries_egress_total- The total number of messages sent from the router to clients. This includes management messages, but not route control messages.
qdr_deliveries_transit_total,qdr_deliveries_ingress_route_container_total- The total number of messages passing through the router for delivery to a different router.
qdr_deliveries_egress_route_container_total- The total number of deliveries sent to AMQP route containers from the router This includes messages to an AMQ Broker instance and management messages, but not route control messages.
qdr_deliveries_delayed_1sec_total- The total number of deliveries forwarded by the router that were unsettled for more than one second.
qdr_deliveries_delayed_10sec_total- The total number of deliveries forwarded by the router that were unsettled for more than ten seconds.
qdr_deliveries_stuck_total- The total number of deliveries that cannot be delivered. Typically, deliveries cannot be delivered due to lack of credit as described in Message routing flow control
qdr_links_blocked_total- The total number of links that are blocked.
qdr_deliveries_redirected_to_fallback_total- The total number of deliveries that were forwarded to a fallback destination. See Handling undeliverable messages for more information.
Additional information
See Section 9.2, “Viewing AMQ Interconnect dashboards in Grafana”.