
Chapter 35. Response code tracking
This tutorial shows how to set up and use the response codes log in the 3scale system.
Tracking response codes from your API is a great way to see how your clients are using it and to see in real time whether everything is fine with your servers.
To enable response code tracking feature, set the APICAST_RESPONSE_CODES environment variable to 1 or true when starting APIcast gateway using Docker or OpenShift deployment.
When enabled, APIcast gateway captures the HTTP status code of API responses returned by the upstream service for authorized calls, and sends them to the Service Management API (in authrep call). Example:
https://su1.3scale.net/transactions/authrep.xml?service_token={SERVICE_TOKEN}&service_id={SERVICE_ID}&user_key={USER_KEY}&usage%5Bhits%5D=1&log%5Bcode%5D=200"
In this example,log[code]=200 is sent, which means that the API responded with a 200 status code.
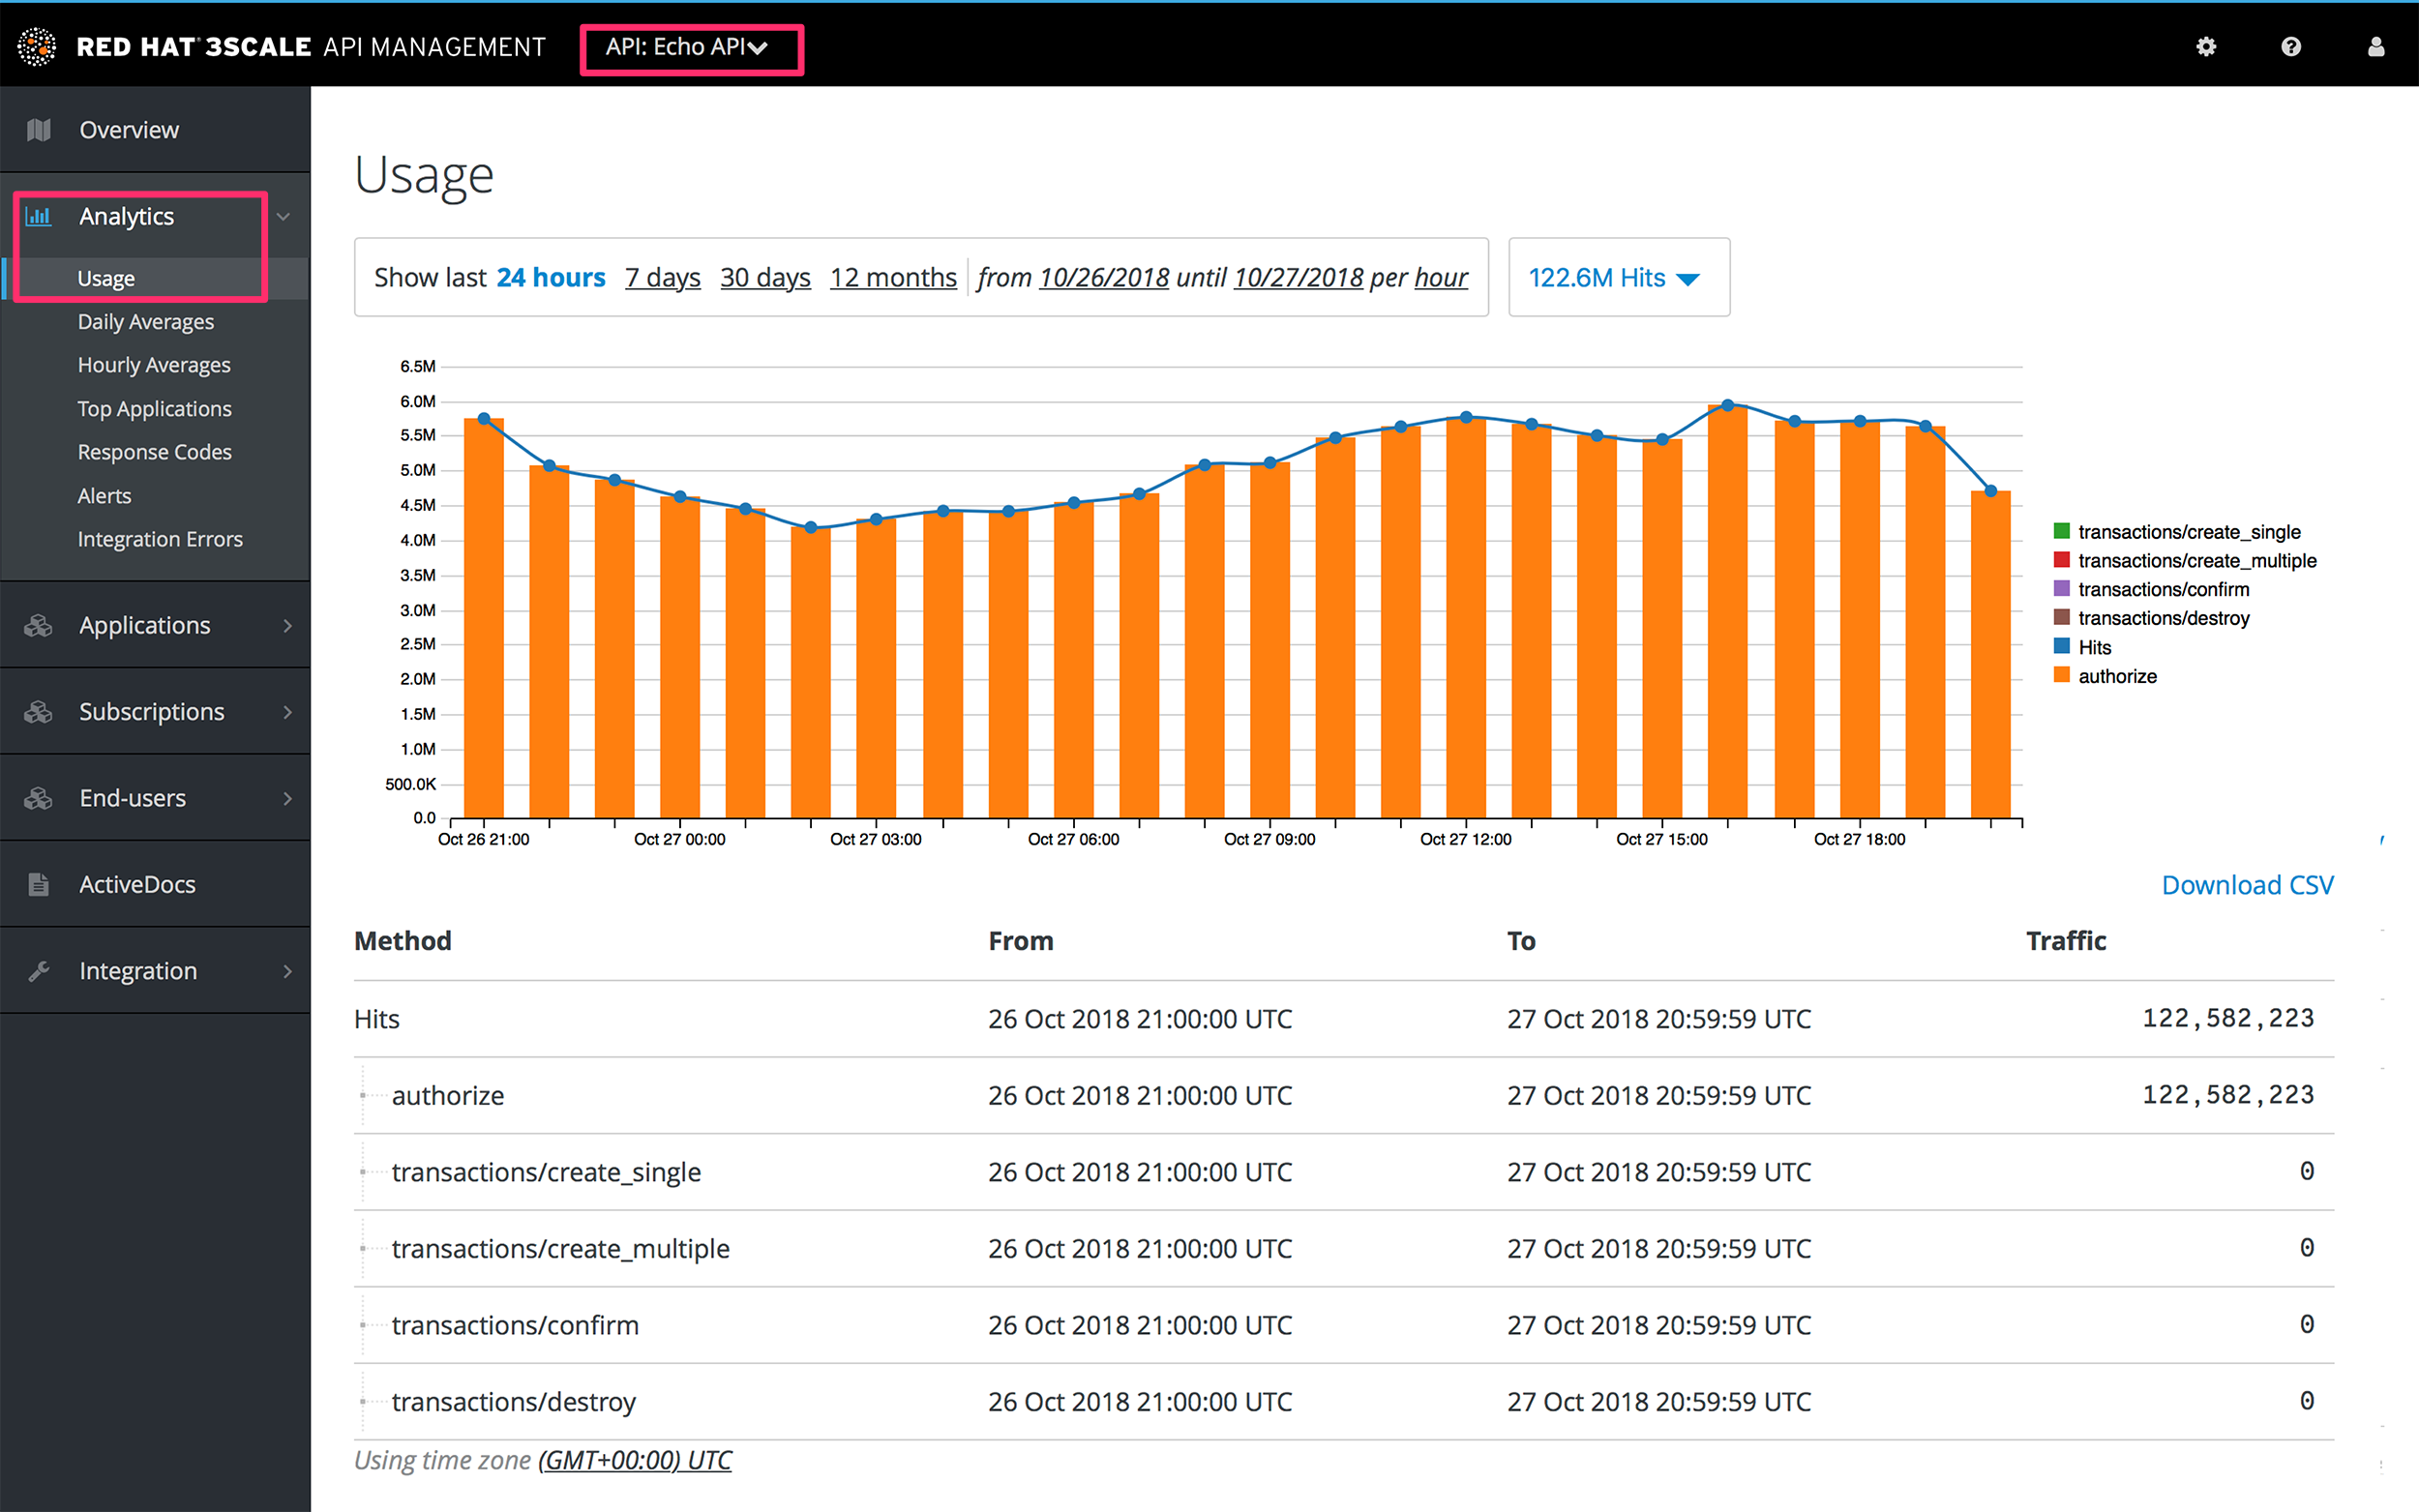
To verify the integration, you must call your API with valid 3scale credentials, and then verify that the call was correctly reported on the Analytics > Usage page.
- Response Code Tracking is not intended to be an accurate count of all responses.
- The value of this view is to provide a visual representation of the trend over a period of time.
-
Response Code Tracking and 3scale Auth Caching mode:
Noneis not a supported combination.
If everything is going well so far, go to the Analytics >Response codes page. You should be able to see a graph with your latest traffic divided by colors, depending if the response was 2xx, 4xx, or 5xx.
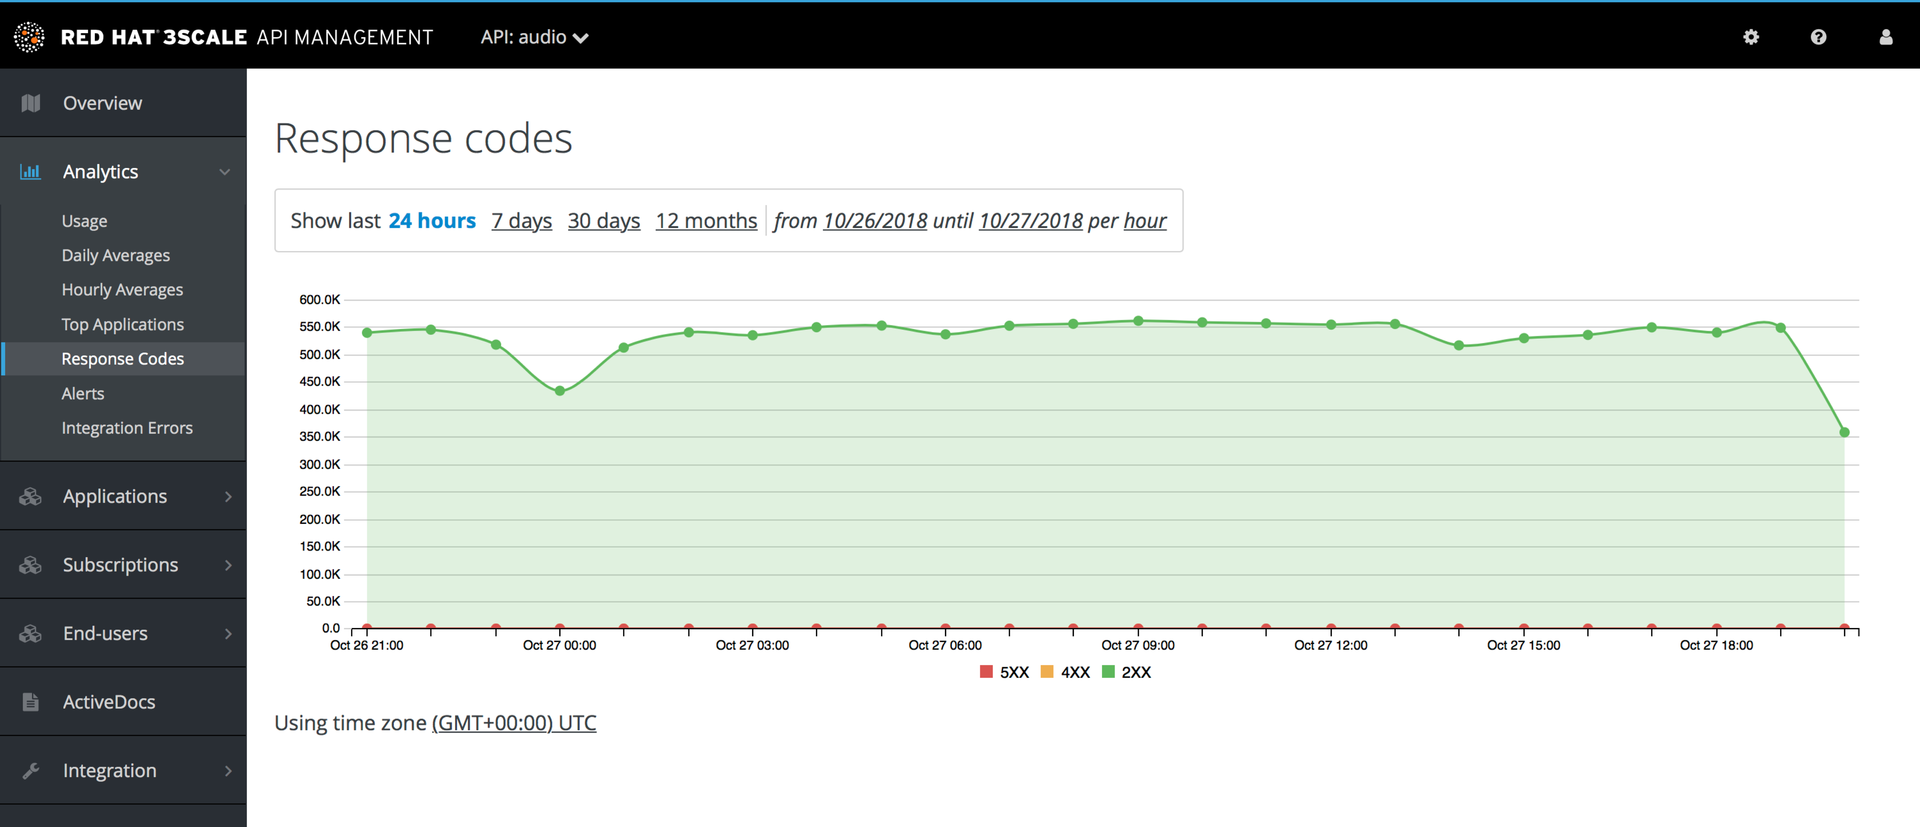
The graph tool gives you the ability to view the history of response codes. You can also check the response code statistics for different periods of time and different levels of granularity. Simply click on the time selection bar and define the time period and granularity that will fit your needs.