
Chapter 34. Out-of-the-box analytics
By the end of this tutorial, you will be able to find visual information on an application’s traffic.
Each application using an API has a traffic trace in the 3scale system, which can be viewed from the Admin Portal as well as recovered by an API.
34.1. Find the application
You can find the application from Audience > Accounts > Listing or Audience > Applications > Listing, or by searching as described in the finding applications tutorial.
34.2. Understand the application display
Once you’ve located the application, you’ll see an overview screen with information about the application as shown in the following image.
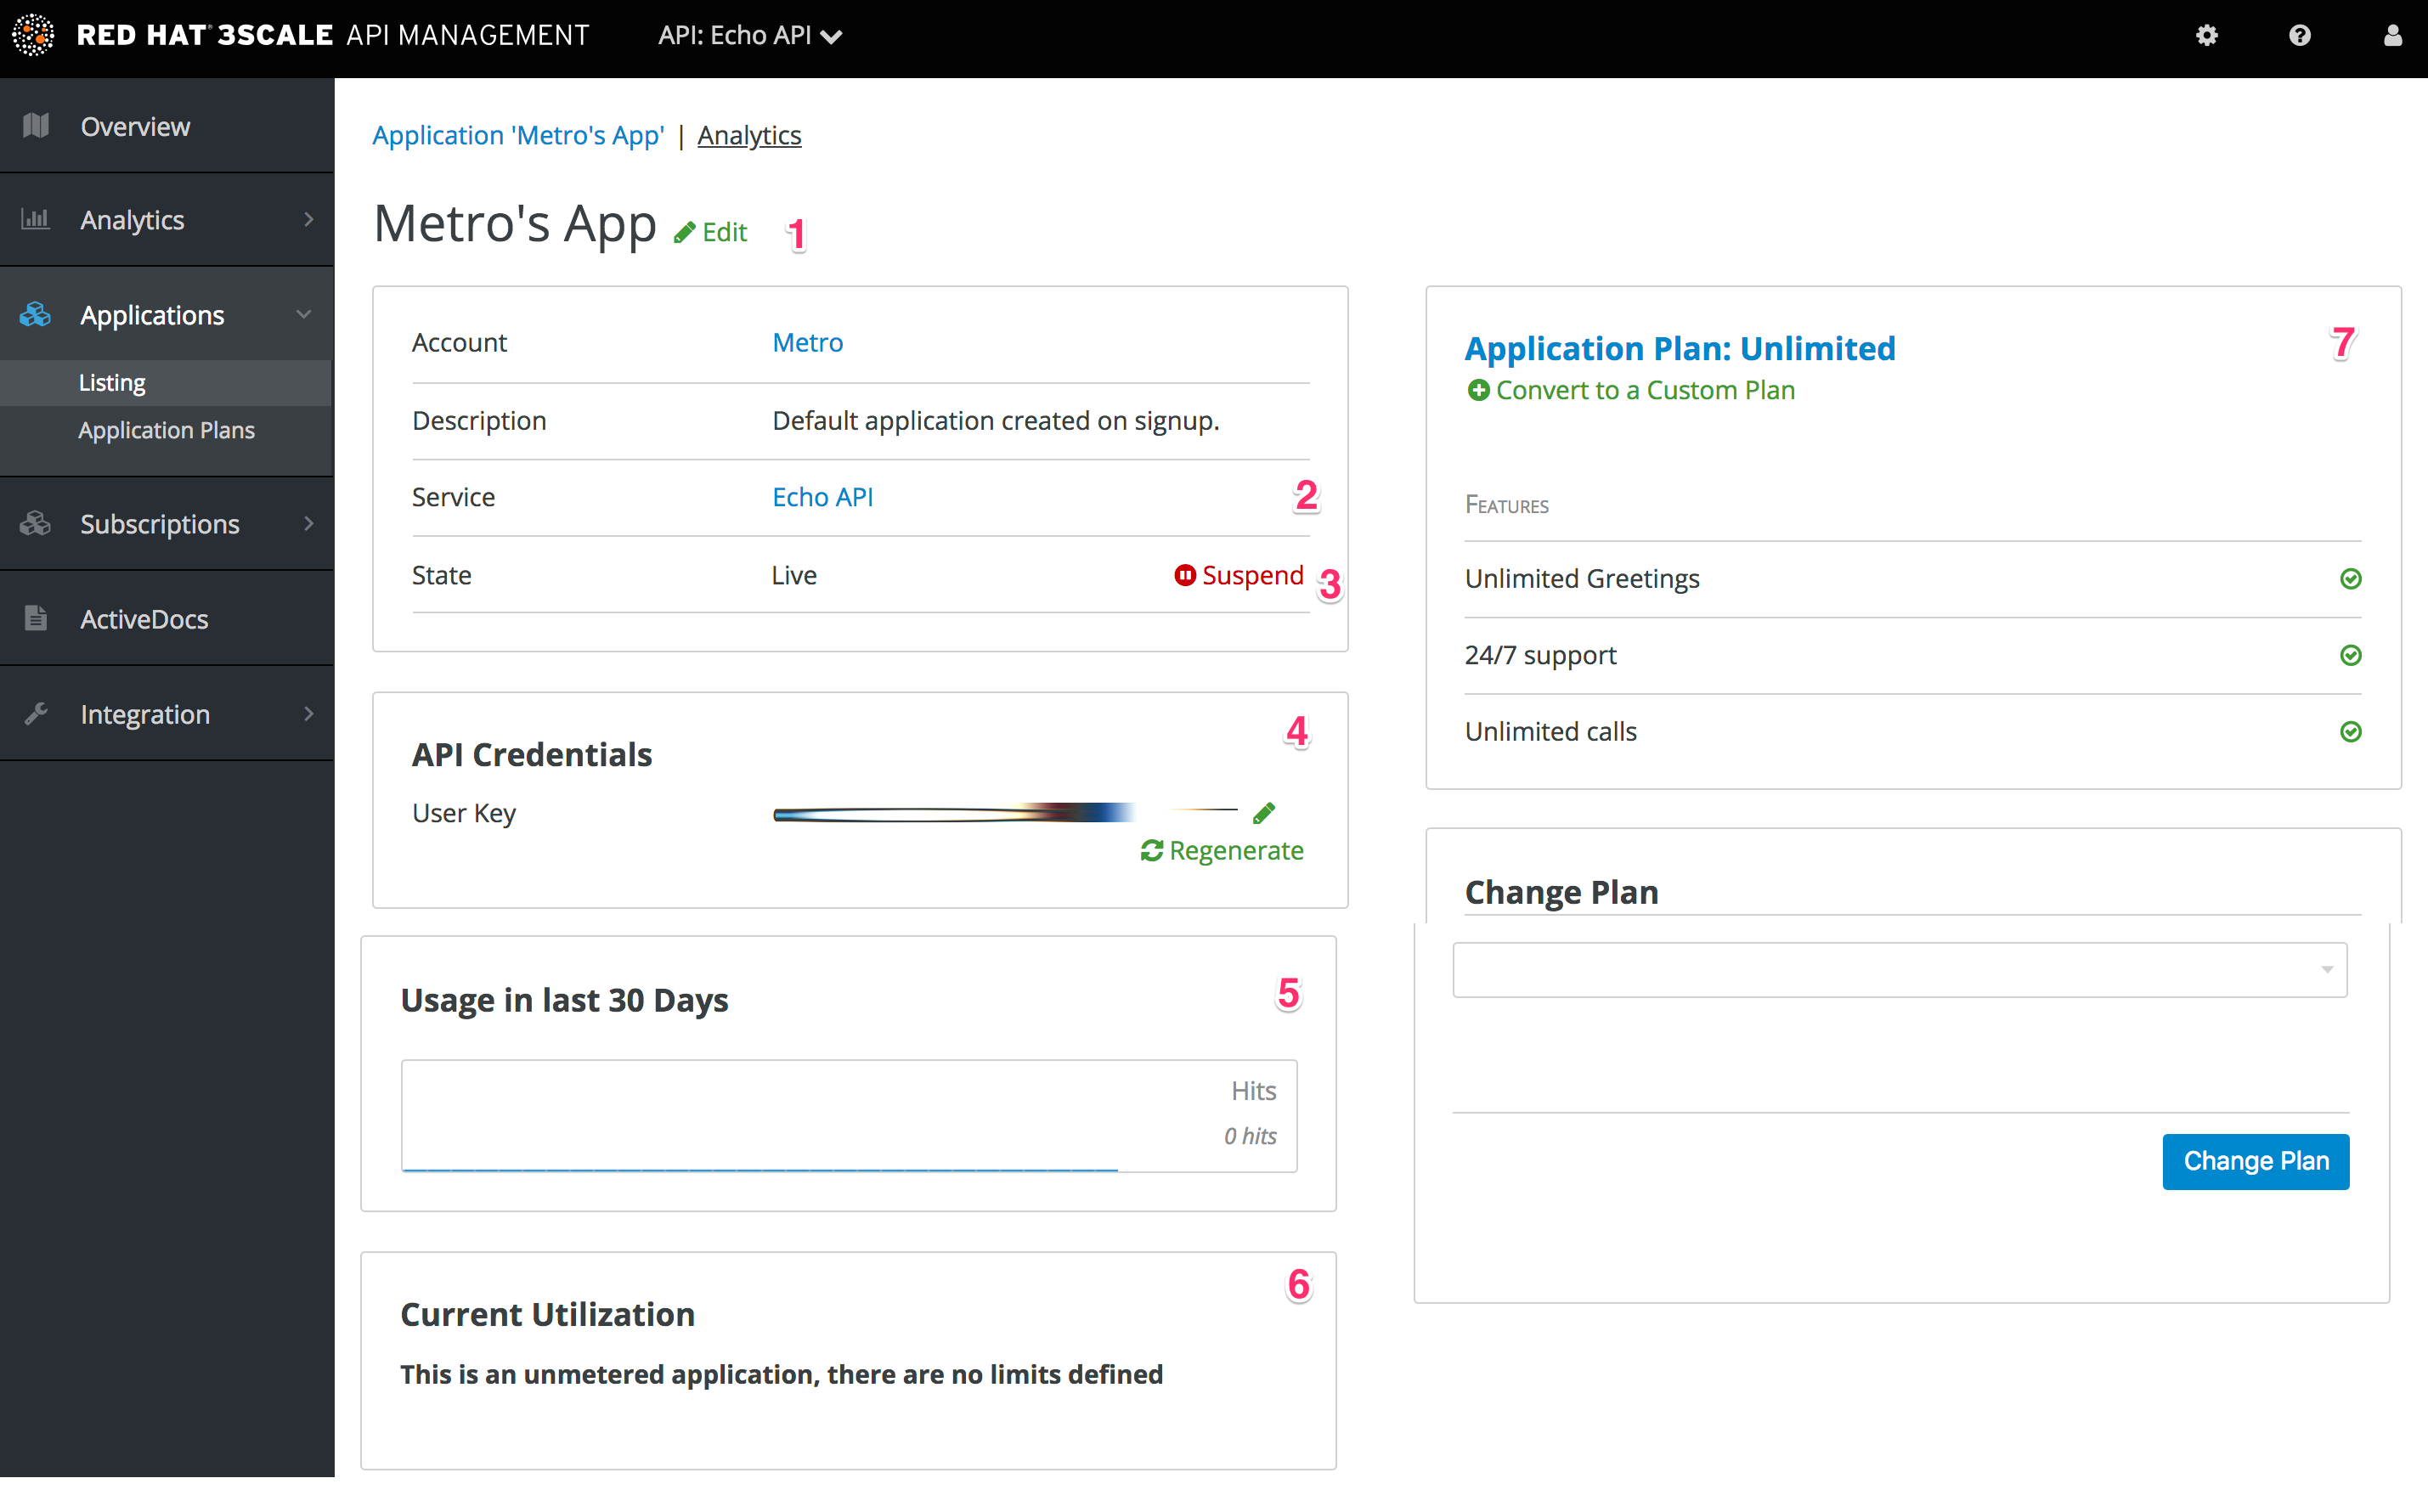
The items labeled in the diagram correspond to the following information:
- The name of the application given by the developer.
- Meta data captured for the application (learn how to set which data to capture in the advanced section).
- The status of the application – is it live or suspended?
- The current API identifiers, keys, and certificates that the application has. (This view varies depending on what authentication method was used to integrate the API into 3scale).
- A summary of traffic statistics for the application.
- Information on which application plan the application is on and which rate limits apply.
34.3. Use the menu to access the full screen statistics view
To get to the Analytics page of an application, go to the application and click on Analytics in the links located above the application’s name. This will take you to the usage charts view for the application as shown in the image below.
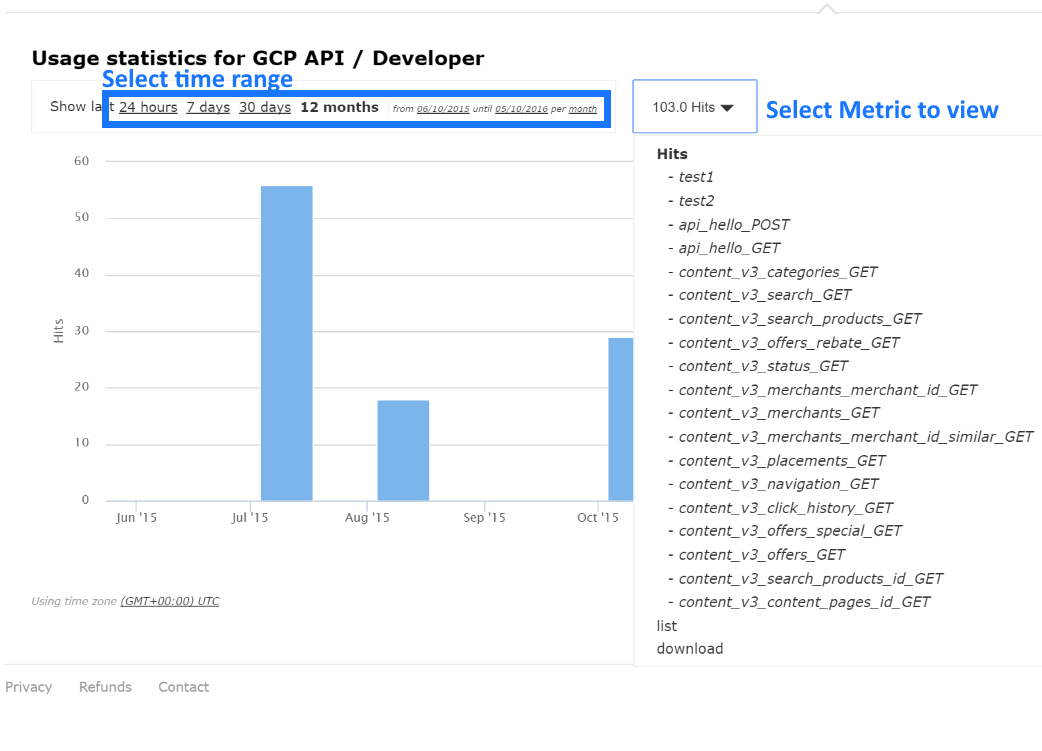
Controlling the metrics, methods, and time range allows you to check different types of data about the application.