
Chapter 11. Troubleshooting the API infrastructure
This guide aims to help you identify and fix the cause of issues with your API infrastructure.
API Infrastructure is a lengthy and complex topic. However, at a minimum, you will have three moving parts in your Infrastructure:
- The API gateway
- 3scale
- The API
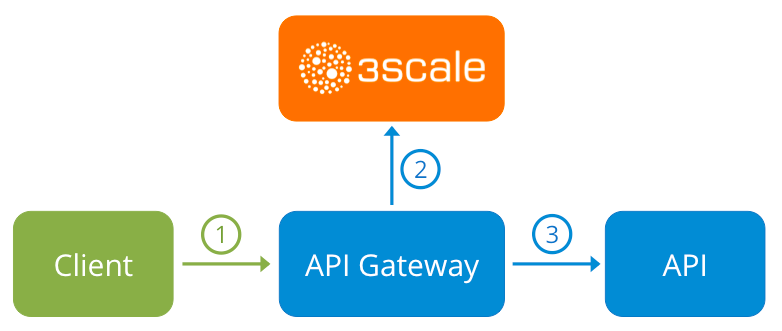
Errors in any of these three elements result in API consumers being unable to access your API. However, it is difficult to find the component that caused the failure. This guide gives you some tips to troubleshoot your infrastructure to identify the problem.
Use the following sections to identify and fix common issues that may occur:
11.1. Common integration issues
There are some evidences that can point to some very common issues with your integration with 3scale. These will vary depending on whether you are at the beginning of your API project, setting up your infrastructure, or are already live in production.
11.1.1. Integration issues
The following sections attempt to outline some common issues you may see in the APIcast error log during the initial phases of your integration with 3scale: at the beginning using APIcast Hosted and prior to go-live, running the self-managed APIcast.
11.1.1.1. APIcast Hosted
When you are first integrating your API with APIcast Hosted on the Service Integration screen, you might get some of the following errors shown on the page or returned by the test call you make to check for a successful integration.
Test request failed: execution expiredCheck that your API is reachable from the public internet. APIcast Hosted cannot be used with private APIs. If you do not want to make your API publicly available to integrate with APIcast Hosted, you can set up a private secret between APIcast Hosted and your API to reject any calls not coming from the API gateway.
The accepted format is
protocol://address(:port)Remove any paths at the end of your APIs private base URL. You can add these in the "mapping rules" pattern or at the beginning of the API test GET request.
Test request failed with HTTP code XXX-
405: Check that the endpoint accepts GET requests. APIcast only supports GET requests to test the integration. -
403: Authentication parameters missing: If your API already has some authentication in place, APIcast will be unable to make a test request. -
403: Authentication failed: If this is not the first service you have created with 3scale, check that you have created an application under the service with credentials to make the test request. If it is the first service you are integrating, ensure that you have not deleted the test account or application that you created on signup.
-
11.1.1.2. APIcast self-managed
After you have successfully tested the integration with APIcast self-managed, you might want to host the API gateway yourself. Following are some errors you may encounter when you first install your self-managed gateway and call your API through it.
upstream timed out (110: Connection timed out) while connecting to upstreamCheck that there are no firewalls or proxies between the API Gateway and the public Internet that would prevent your self-managed gateway from reaching 3scale.
failed to get list of services: invalid status: 403 (Forbidden)2018/06/04 08:04:49 [emerg] 14#14: [lua] configuration_loader.lua:134: init(): failed to load configuration, exiting (code 1) 2018/06/04 08:04:49 [warn] 22#22: *2 [lua] remote_v2.lua:163: call(): failed to get list of services: invalid status: 403 (Forbidden) url: https://example-admin.3scale.net/admin/api/services.json , context: ngx.timer ERROR: /opt/app-root/src/src/apicast/configuration_loader.lua:57: missing configuration
Check that the Access Token that you used in the
THREESCALE_PORTAL_ENDOINTvalue is correct and that it has the Account Management API scope. Verify it with acurlcommand:curl -v "https://example-admin.3scale.net/admin/api/services.json?access_token=<YOUR_ACCESS_TOKEN>"It should return a 200 response with a JSON body. If it returns an error status code, check the response body for details.
service not found for host apicast.example.com2018/06/04 11:06:15 [warn] 23#23: *495 [lua] find_service.lua:24: find_service(): service not found for host apicast.example.com, client: 172.17.0.1, server: _, request: "GET / HTTP/1.1", host: "apicast.example.com"
This error indicates that the Public Base URL has not been configured properly. You should ensure that the configured Public Base URL is the same that you use for the request to self-managed APIcast. After configuring the correct Public Base URL:
-
Ensure that APIcast is configured for "production" (default configuration for standalone APIcast if not overriden with
THREESCALE_DEPLOYMENT_ENVvariable). Ensure that you promote the configuration to production. -
Restart APIcast, if you have not configured auto-reloading of configuration using
APICAST_CONFIGURATION_CACHEandAPICAST_CONFIGURATION_LOADERenvironment variables.
-
Ensure that APIcast is configured for "production" (default configuration for standalone APIcast if not overriden with
Following are some other symptoms that may point to an incorrect APIcast self-managed integration:
- Mapping rules not matched / Double counting of API calls: Depending on the way you have defined the mapping between methods and actual URL endpoints on your API, you might find that sometimes methods either don’t get matched or get incremented more than once per request. To troubleshoot this, make a test call to your API with the 3scale debug header. This will return a list of all the methods that have been matched by the API call.
- Authentication parameters not found: Ensure your are sending the parameters to the correct location as specified in the Service Integration screen. If you do not send credentials as headers, the credentials must be sent as query parameters for GET requests and body parameters for all other HTTP methods. Use the 3scale debug header to double-check the credentials that are being read from the request by the API gateway.
11.1.2. Production issues
It is rare to run into issues with your API gateway after you have fully tested your setup and have been live with your API for a while. However, here are some of the issues you might encounter in a live production environment.
11.1.2.1. Availability issues
Availability issues are normally characterised by upstream timed out errors in your nginx error.log; example:
upstream timed out (110: Connection timed out) while connecting to upstream, client: X.X.X.X, server: api.example.com, request: "GET /RESOURCE?CREDENTIALS HTTP/1.1", upstream: "http://Y.Y.Y.Y:80/RESOURCE?CREDENTIALS", host: "api.example.com"
If you are experiencing intermittent 3scale availability issues, following may be the reasons for this:
You are resolving to an old 3scale IP that is no longer in use.
The latest version of the API gateway configuration files defines 3scale as a variable to force IP resolution each time. For a quick fix, reload your NGINX instance. For a long-term fix, ensure that instead of defining the 3scale backend in an upstream block, you define it as a variable within each server block; example:
server {
  # Enabling the Lua code cache is strongly encouraged for production use. Here it is enabled
  .
  .
  .
  set $threescale_backend "https://su1.3scale.net:443";
When you refer to it:
location = /threescale_authrep {
  internal;
  set $provider_key "YOUR_PROVIDER_KEY";

  proxy_pass $threescale_backend/transactions/authrep.xml?provider_key=$provider_key&service_id=$service_id&$usage&$credentials&log%5Bcode%5D=$arg_code&log%5Brequest%5D=$arg_req&log%5Bresponse%5D=$arg_resp;
}
You are missing some 3scale IPs from your whitelist. Following is the current list of IPs that 3scale resolves to:
- 75.101.142.93
- 174.129.235.69
- 184.73.197.122
- 50.16.225.117
- 54.83.62.94
- 54.83.62.186
- 54.83.63.187
54.235.143.255
The above issues refer to problems with perceived 3scale availability. However, you might encounter similar issues with your API availability from the API gateway if your API is behind an AWS ELB. This is because NGINX, by default, does DNS resolution at start-up time and then caches the IP addresses. However, ELBs do not ensure static IP addresses and these might change frequently. Whenever the ELB changes to a different IP, NGINX is unable to reach it.
The solution for this is similar to the above fix for forcing runtime DNS resolution.
-
Set a specific DNS resolver such as Google DNS, by adding this line at the top of the
httpsection:resolver 8.8.8.8 8.8.4.4;. -
Set your API base URL as a variable anywhere near the top of the
serversection.set $api_base "http://api.example.com:80"; -
Inside the
location /section, find theproxy_passline and replace it withproxy_pass $api_base;.
-
Set a specific DNS resolver such as Google DNS, by adding this line at the top of the
11.1.3. Post-deploy issues
If you make changes to your API such as adding a new endpoint, you must ensure that you add a new method and URL mapping before downloading a new set of configuration files for your API gateway.
The most common problem when you have modified the configuration downloaded from 3scale will be code errors in the Lua, which will result in a 500 - Internal server error such as:
curl -v -X GET "http://localhost/"
* About to connect() to localhost port 80 (#0)
*   Trying 127.0.0.1... connected
> GET / HTTP/1.1
> User-Agent: curl/7.22.0 (x86_64-pc-linux-gnu) libcurl/7.22.0 OpenSSL/1.0.1 zlib/1.2.3.4 libidn/1.23 librtmp/2.3
> Host: localhost
> Accept: */*
>
< HTTP/1.1 500 Internal Server Error
< Server: openresty/1.5.12.1
< Date: Thu, 04 Feb 2016 10:22:25 GMT
< Content-Type: text/html
< Content-Length: 199
< Connection: close
<

<head><title>500 Internal Server Error</title></head>

<center><h1>500 Internal Server Error</h1></center>
<hr><center>openresty/1.5.12.1</center>


* Closing connection #0
You can see the nginx error.log to know the cause, such as:
2016/02/04 11:22:25 [error] 8980#0: *1 lua entry thread aborted: runtime error: /home/pili/NGINX/troubleshooting/nginx.lua:66: bad argument #3 to '_newindex' (number expected, got nil)
stack traceback:
coroutine 0:
  [C]: in function '_newindex'
  /home/pili/NGINX/troubleshooting/nginx.lua:66: in function 'error_authorization_failed'
  /home/pili/NGINX/troubleshooting/nginx.lua:330: in function 'authrep'
  /home/pili/NGINX/troubleshooting/nginx.lua:283: in function 'authorize'
  /home/pili/NGINX/troubleshooting/nginx.lua:392: in function  while sending to client, client: 127.0.0.1, server: api-2445581381726.staging.apicast.io, request: "GET / HTTP/1.1", host: "localhost"
In the access.log this will look like the following:
127.0.0.1 - - [04/Feb/2016:11:22:25 +0100] "GET / HTTP/1.1" 500 199 "-" "curl/7.22.0 (x86_64-pc-linux-gnu) libcurl/7.22.0 OpenSSL/1.0.1 zlib/1.2.3.4 libidn/1.23 librtmp/2.3"
The above section gives you a an overview of the most common, well-known issues that you might encounter at any stage of your 3scale journey.
If all of these have been checked and you are still unable to find the cause and solution for your issue, you should proceed to the more detailed section on Identifying API request issues. Start at your API and work your way back to the client in order to try to identify the point of failure.
11.2. Handling API infrastructure issues
If you are experiencing failures when connecting to a server, whether that is the API gateway, 3scale, or your API, the following troubleshooting steps should be your first port of call:
11.2.1. Can we connect?
Use telnet to check the basic TCP/IP connectivity telnet api.example.com 443
- Success
telnet echo-api.3scale.net 80
Trying 52.21.167.109...
Connected to tf-lb-i2t5pgt2cfdnbdfh2c6qqoartm-829217110.us-east-1.elb.amazonaws.com.
Escape character is '^]'.
Connection closed by foreign host.
- Failure
telnet su1.3scale.net 443
Trying 174.129.235.69...
telnet: Unable to connect to remote host: Connection timed out
11.2.2. Server connection issues
Try to connect to the same server from different network locations, devices, and directions. For example, if your client is unable to reach your API, try to connect to your API from a machine that should have access such as the API gateway.
If any of the attempted connections succeed, you can rule out any problems with the actual server and concentrate your troubleshooting on the network between them, as this is where the problem will most likely be.
11.2.3. Is it a DNS issue?
Try to connect to the server by using its IP address instead of its hostname e.g. telnet 94.125.104.17 80 instead of telnet apis.io 80
This will rule out any problems with the DNS.
You can get the IP address for a server using dig for example for 3scale dig su1.3scale.net or dig any su1.3scale.net if you suspect there may be multiple IPs that a host may resolve to.
NB: Some hosts block `dig any`
11.2.4. Is it an SSL issue?
You can use OpenSSL to test:
Secure connections to a host or IP, such as from the shell prompt
openssl s_client -connect su1.3scale.net:443Output:
CONNECTED(00000003)
depth=1 C = US, O = GeoTrust Inc., CN = GeoTrust SSL CA - G3
verify error:num=20:unable to get local issuer certificate
---
Certificate chain
 0 s:/C=ES/ST=Barcelona/L=Barcelona/O=3scale Networks, S.L./OU=IT/CN=*.3scale.net
   i:/C=US/O=GeoTrust Inc./CN=GeoTrust SSL CA - G3
 1 s:/C=US/O=GeoTrust Inc./CN=GeoTrust SSL CA - G3
   i:/C=US/O=GeoTrust Inc./CN=GeoTrust Global CA
---
Server certificate
-----BEGIN CERTIFICATE-----
MIIE8zCCA9ugAwIBAgIQcz2Y9JNxH7f2zpOT0DajUjANBgkqhkiG9w0BAQsFADBE
...
TRUNCATED
...
3FZigX+OpWLVRjYsr0kZzX+HCerYMwc=
-----END CERTIFICATE-----
subject=/C=ES/ST=Barcelona/L=Barcelona/O=3scale Networks, S.L./OU=IT/CN=*.3scale.net
issuer=/C=US/O=GeoTrust Inc./CN=GeoTrust SSL CA - G3
---
Acceptable client certificate CA names
/C=ES/ST=Barcelona/L=Barcelona/O=3scale Networks, S.L./OU=IT/CN=*.3scale.net
/C=US/O=GeoTrust Inc./CN=GeoTrust SSL CA - G3
Client Certificate Types: RSA sign, DSA sign, ECDSA sign
Requested Signature Algorithms: RSA+SHA512:DSA+SHA512:ECDSA+SHA512:RSA+SHA384:DSA+SHA384:ECDSA+SHA384:RSA+SHA256:DSA+SHA256:ECDSA+SHA256:RSA+SHA224:DSA+SHA224:ECDSA+SHA224:RSA+SHA1:DSA+SHA1:ECDSA+SHA1:RSA+MD5
Shared Requested Signature Algorithms: RSA+SHA512:DSA+SHA512:ECDSA+SHA512:RSA+SHA384:DSA+SHA384:ECDSA+SHA384:RSA+SHA256:DSA+SHA256:ECDSA+SHA256:RSA+SHA224:DSA+SHA224:ECDSA+SHA224:RSA+SHA1:DSA+SHA1:ECDSA+SHA1
Peer signing digest: SHA512
Server Temp Key: ECDH, P-256, 256 bits
---
SSL handshake has read 3281 bytes and written 499 bytes
---
New, TLSv1/SSLv3, Cipher is ECDHE-RSA-AES256-GCM-SHA384
Server public key is 2048 bit
Secure Renegotiation IS supported
Compression: NONE
Expansion: NONE
No ALPN negotiated
SSL-Session:
    Protocol  : TLSv1.2
    Cipher    : ECDHE-RSA-AES256-GCM-SHA384
    Session-ID: A85EFD61D3BFD6C27A979E95E66DA3EC8F2E7B3007C0166A9BCBDA5DCA5477B8
    Session-ID-ctx:
    Master-Key: F7E898F1D996B91D13090AE9D5624FF19DFE645D5DEEE2D595D1B6F79B1875CF935B3A4F6ECCA7A6D5EF852AE3D4108B
    Key-Arg   : None
    PSK identity: None
    PSK identity hint: None
    SRP username: None
    TLS session ticket lifetime hint: 300 (seconds)
    TLS session ticket:
    0000 - a8 8b 6c ac 9c 3c 60 78-2c 5c 8a de 22 88 06 15   ..l..<`x,\.."...
    0010 - eb be 26 6c e6 7b 43 cc-ae 9b c0 27 6c b7 d9 13   ..&l.{C....'l...
    0020 - 84 e4 0d d5 f1 ff 4c 08-7a 09 10 17 f3 00 45 2c   ......L.z.....E,
    0030 - 1b e7 47 0c de dc 32 eb-ca d7 e9 26 33 26 8b 8e   ..G...2....&3&..
    0040 - 0a 86 ee f0 a9 f7 ad 8a-f7 b8 7b bc 8c c2 77 7b   ..........{...w{
    0050 - ae b7 57 a8 40 1b 75 c8-25 4f eb df b0 2b f6 b7   ..W.@.u.%O...+..
    0060 - 8b 8e fc 93 e4 be d6 60-0f 0f 20 f1 0a f2 cf 46   .......`.. ....F
    0070 - b0 e6 a1 e5 31 73 c2 f5-d4 2f 57 d1 b0 8e 51 cc   ....1s.../W...Q.
    0080 - ff dd 6e 4f 35 e4 2c 12-6c a2 34 26 84 b3 0c 19   ..nO5.,.l.4&....
    0090 - 8a eb 80 e0 4d 45 f8 4a-75 8e a2 06 70 84 de 10   ....ME.Ju...p...

    Start Time: 1454932598
    Timeout   : 300 (sec)
    Verify return code: 20 (unable to get local issuer certificate)
---
SSLv3 support (NOT supported by 3scale)
openssl s_client -ssl3 -connect su.3scale.net:443Output
CONNECTED(00000003)
140735196860496:error:14094410:SSL routines:ssl3_read_bytes:sslv3 alert handshake failure:s3_pkt.c:1456:SSL alert number 40
140735196860496:error:1409E0E5:SSL routines:ssl3_write_bytes:ssl handshake failure:s3_pkt.c:644:
---
no peer certificate available
---
No client certificate CA names sent
---
SSL handshake has read 7 bytes and written 0 bytes
---
New, (NONE), Cipher is (NONE)
Secure Renegotiation IS NOT supported
Compression: NONE
Expansion: NONE
No ALPN negotiated
SSL-Session:
    Protocol  : SSLv3
    Cipher    : 0000
    Session-ID:
    Session-ID-ctx:
    Master-Key:
    Key-Arg   : None
    PSK identity: None
    PSK identity hint: None
    SRP username: None
    Start Time: 1454932872
    Timeout   : 7200 (sec)
    Verify return code: 0 (ok)
---
For more details, see the OpenSSL man pages.
11.3. Identifying API request issues
To identify where an issue with requests to your API might lie, go through the following checks.
11.3.1. API
To confirm that the API is up and responding to requests, make the same request directly to your API (not going through the API gateway). You should ensure that you are sending the same parameters and headers as the request that goes through the API gateway. If you are unsure of the exact request that is failing, capture the traffic between the API gateway and your API.
If the call succeeds, you can rule out any problems with the API, otherwise you should troubleshoot your API further.
11.3.2. API Gateway > API
To rule out any network issues between the API gateway and the API, make the same call as before — directly to your API — from your API gateway server.
If the call succeeds, you can move on to troubleshooting the API gateway itself.
11.3.3. API gateway
There are a number of steps to go through to check that the API gateway is working correctly.
11.3.3.1. Is the API gateway up and running?
Log in to the machine where the gateway is running. If this fails, your gateway server might be down.
After you have logged in, check that the NGINX process is running. For this, run ps ax | grep nginx or htop.
NGINX is running if you see nginx master process and nginx worker process in the list.
11.3.3.2. Are there any errors in the gateway logs?
Following are some common errors you might see in the gateway logs, for example in error.log:
API gateway can’t connect to API
upstream timed out (110: Connection timed out) while connecting to upstream, client: X.X.X.X, server: api.example.com, request: "GET /RESOURCE?CREDENTIALS HTTP/1.1", upstream: "http://Y.Y.Y.Y:80/RESOURCE?CREDENTIALS", host: "api.example.com"
API gateway cannot connect to 3scale
2015/11/20 11:33:51 [error] 3578#0: *1 upstream timed out (110: Connection timed out) while connecting to upstream, client: 127.0.0.1, server: , request: "GET /api/activities.json?user_key=USER_KEY HTTP/1.1", subrequest: "/threescale_authrep", upstream: "https://54.83.62.186:443/transactions/authrep.xml?provider_key=YOUR_PROVIDER_KEY&service_id=SERVICE_ID&usage[hits]=1&user_key=USER_KEY&log%5Bcode%5D=", host: "localhost"
11.3.4. API gateway > 3scale
Once you are sure the API gateway is running correctly, the next step is troubleshooting the connection between the API gateway and 3scale.
11.3.4.1. Can the API gateway reach 3scale?
If you are using NGINX as your API gateway, the following message displays in the nginx error logs when the gateway is unable to contact 3scale.
2015/11/20 11:33:51 [error] 3578#0: *1 upstream timed out (110: Connection timed out) while connecting to upstream, client: 127.0.0.1, server: , request: "GET /api/activities.json?user_key=USER_KEY HTTP/1.1", subrequest: "/threescale_authrep", upstream: "https://54.83.62.186:443/transactions/authrep.xml?provider_key=YOUR_PROVIDER_KEY&service_id=SERVICE_ID&usage[hits]=1&user_key=USER_KEY&log%5Bcode%5D=", host: "localhost"
Here, note the upstream value. This IP corresponds to one of the IPs that the 3scale product resolves to. This implies that there is a problem reaching 3scale. You can do a reverse DNS lookup to check the domain for an IP by calling nslookup.
For example, because the API gateway is unable to reach 3scale, it does not mean that 3scale is down. One of the most common reasons for this would be firewall rules preventing the API gateway from connecting to 3scale.
There may be network issues between the gateway and 3scale that could cause connections to timeout. In this case, you should go through the steps in troubleshooting generic connectivity issues to identify where the problem lies.
To rule out networking issues, use traceroute or MTR to check the routing and packet transmission. You can also run the same command from a machine that is able to connect to 3scale and your API gateway and compare the output.
Additionally, to see the traffic that is being sent between your API gateway and 3scale, you can use tcpdump as long as you temporarily switch to using the HTTP endpoint for the 3scale product (su1.3scale.net).
11.3.4.2. Is the API gateway resolving 3scale addresses correctly?
Ensure you have the resolver directive added to your nginx.conf.
For example, in nginx.conf:
http {
  lua_shared_dict api_keys 10m;
  server_names_hash_bucket_size 128;
  lua_package_path ";;$prefix/?.lua;";
  init_by_lua 'math.randomseed(ngx.time()) ; cjson = require("cjson")';

  resolver 8.8.8.8 8.8.4.4;
You can substitute the Google DNS (8.8.8.8 and 8.8.4.4) with your preferred DNS.
To check DNS resolution from your API gateway, call nslookup as follows with the specified resolver IP:
nslookup su1.3scale.net 8.8.8.8
;; connection timed out; no servers could be reached
The above example shows the response returned if Google DNS cannot be reached. If this is the case, you must update the resolver IPs. You might also see the following alert in your nginx error.log:
2016/05/09 14:15:15 [alert] 9391#0: send() failed (1: Operation not permitted) while resolving, resolver: 8.8.8.8:53
Finally, run dig any su1.3scale.net to see the IP addresses currently in operation for the 3scale Service Management API. Note that this is not the entire range of IP addresses that might be used by 3scale. Some may be swapped in and out for capacity reasons. Additionally, you may add more domain names for the 3scale service in the future. For this you should always test against the specific address that are supplied to you during integration, if applicable.
11.3.4.3. Is the API gateway calling 3scale correctly?
If you want to check the request your API gateway is making to 3scale for troubleshooting purposes only you can add the following snippet to the 3scale authrep location in nginx.conf (/threescale_authrep for API Key and App\_id authentication modes):
body_filter_by_lua_block{
  if ngx.req.get_headers()["X-3scale-debug"] == ngx.var.provider_key then
    local resp = ""
    ngx.ctx.buffered = (ngx.ctx.buffered or "") .. string.sub(ngx.arg[1], 1, 1000)
    if ngx.arg[2] then
      resp = ngx.ctx.buffered
    end

    ngx.log(0, ngx.req.raw_header())
    ngx.log(0, resp)
  end
}
This snippet will add the following extra logging to the nginx error.log when the X-3scale-debug header is sent, e.g. curl -v -H 'X-3scale-debug: YOUR_PROVIDER_KEY' -X GET "https://726e3b99.ngrok.com/api/contacts.json?access_token=7c6f24f5"
This will produce the following log entries:
2016/05/05 14:24:33 [] 7238#0: *57 [lua] body_filter_by_lua:7: GET /api/contacts.json?access_token=7c6f24f5 HTTP/1.1
Host: 726e3b99.ngrok.io
User-Agent: curl/7.43.0
Accept: */*
X-Forwarded-Proto: https
X-Forwarded-For: 2.139.235.79

 while sending to client, client: 127.0.0.1, server: pili-virtualbox, request: "GET /api/contacts.json?access_token=7c6f24f5 HTTP/1.1", subrequest: "/threescale_authrep", upstream: "https://54.83.62.94:443/transactions/oauth_authrep.xml?provider_key=REDACTED&service_id=REDACTED&usage[hits]=1&access_token=7c6f24f5", host: "726e3b99.ngrok.io"
2016/05/05 14:24:33 [] 7238#0: *57 [lua] body_filter_by_lua:8: <?xml version="1.0" encoding="UTF-8"?><error code="access_token_invalid">access_token "7c6f24f5" is invalid: expired or never defined</error> while sending to client, client: 127.0.0.1, server: pili-virtualbox, request: "GET /api/contacts.json?access_token=7c6f24f5 HTTP/1.1", subrequest: "/threescale_authrep", upstream: "https://54.83.62.94:443/transactions/oauth_authrep.xml?provider_key=REDACTED&service_id=REDACTED&usage[hits]=1&access_token=7c6f24f5", host: "726e3b99.ngrok.io"
The first entry (2016/05/05 14:24:33 [] 7238#0: *57 [lua] body_filter_by_lua:7:) prints out the request headers sent to 3scale, in this case: Host, User-Agent, Accept, X-Forwarded-Proto and X-Forwarded-For.
The second entry (2016/05/05 14:24:33 [] 7238#0: *57 [lua] body_filter_by_lua:8:) prints out the response from 3scale, in this case: <error code="access_token_invalid">access_token "7c6f24f5" is invalid: expired or never defined</error>.
Both will print out the original request (GET /api/contacts.json?access_token=7c6f24f5) and subrequest location (/threescale_authrep) as well as the upstream request (upstream: "https://54.83.62.94:443/transactions/threescale_authrep.xml?provider_key=REDACTED&service_id=REDACTED&usage[hits]=1&access_token=7c6f24f5".) This last value allows you to see which of the 3scale IPs have been resolved and also the exact request made to 3scale.
11.3.5. 3scale
11.3.5.1. Is 3scale returning an error?
It is also possible that 3scale is available but is returning an error to your API gateway which would prevent calls going through to your API. Try to make the authorization call directly in 3scale and check the response. If you get an error, check the #troubleshooting-api-error-codes[Error Codes] section to see what the issue is.
11.3.5.2. Use the 3scale debug headers
You can also turn on the 3scale debug headers by making a call to your API with the X-3scale-debug header, example:
curl -v -X GET "https://api.example.com/endpoint?user_key" X-3scale-debug: YOUR_SERVICE_TOKEN
This will return the following headers with the API response:
X-3scale-matched-rules: /, /api/contacts.json
< X-3scale-credentials: access_token=TOKEN_VALUE
< X-3scale-usage: usage[hits]=2
< X-3scale-hostname: HOSTNAME_VALUE
11.3.5.3. Check the integration errors
You can also check the integration errors on your Admin Portal to check for any issues reporting traffic to 3scale. See https://YOUR_DOMAIN-admin.3scale.net/apiconfig/errors.
One of the reasons for integration errors can be sending credentials in the headers with underscores_in_headers directive not enabled in server block.
11.3.6. Client API gateway
11.3.6.1. Is the API gateway reachable from the public internet?
Try directing a browser to the IP address (or domain name) of your gateway server. If this fails, ensure that you have opened the firewall on the relevant ports.
11.3.6.2. Is the API gateway reachable by the client?
If possible, try to connect to the API gateway from the client using one of the methods outlined earlier (telnet, curl, etc.) If the connection fails, the problem lies in the network between the two.
Otherwise, you should move on to troubleshooting the client making the calls to the API.
11.3.7. Client
11.3.7.1. Test the same call using a different client
If a request is not returning the expected result, test with a different HTTP client. For example, if you are calling an API with a Java HTTP client and you see something wrong, cross-check with cURL.
You can also call the API through a proxy between the client and the gateway to capture the exact parameters and headers being sent by the client.
11.3.7.2. Inspect the traffic sent by client
Use a tool like Wireshark to see the requests being made by the client. This will allow you to identify if the client is making calls to the API and the details of the request.
11.4. ActiveDocs issues
Sometimes calls that work when you call the API from the command line fail when going through ActiveDocs.
To enable ActiveDocs calls to work, we send these out through a proxy on our side. This proxy will add certain headers that can sometimes cause issues on the API if they are not expected. To identify if this is the case, try the following steps:
11.4.1. Use petstore.swagger.io
Swagger provides a hosted swagger-ui at petstore.swagger.io which you can use to test your Swagger spec and API going through the latest version of swagger-ui. If both swagger-ui and ActiveDocs fail in the same way, you can rule out any issues with ActiveDocs or the ActiveDocs proxy and focus the troubleshooting on your own spec. Alternatively, you can check the swagger-ui GitHub repo for any known issues with the current version of swagger-ui.
11.4.2. Check that firewall allows connections from ActiveDocs proxy
We recommend to not whitelist IP address for clients using your API. The ActiveDocs proxy uses floating IP addresses for high availability and there is currently no mechanism to notify of any changes to these IPs.
11.4.3. Call the API with incorrect credentials
One way to identify whether the ActiveDocs proxy is working correctly is to call your API with invalid credentials. This will help you to confirm or rule out any problems with both the ActiveDocs proxy and your API gateway.
If you get a 403 code back from the API call (or from the code you have configured on your gateway for invalid credentials), the problem lies with your API because the calls are reaching your gateway.
11.4.4. Compare calls
To identify any differences in headers and parameters between calls made from ActiveDocs versus outside of ActiveDocs, run calls through services such as APItools on-premise or Runscope. This will allow you to inspect and compare your HTTP calls before sending them to your API. You will then be able to identify potential headers and/or parameters in the request that could cause issues.
11.5. Logging in NGINX
For a comprehensive guide on this, see the NGINX Logging and Monitoring docs.
11.5.1. Enabling debugging log
To find out more about enabling debugging log, see the NGINX debugging log documentation.
11.6. 3scale error codes
To double-check the error codes that are returned by the 3scale Service Management API endpoints, see the 3scale API Documentation page by following these steps:
- Click the question mark (?) icon, which is in the upper-right corner of the Admin Portal.
- Choose 3scale API Docs.
The following is a list HTTP response codes returned by 3scale, and the conditions under which they are returned:
400: Bad request. This can be because of:
- Invalid encoding
- Payload too large
-
Content type is invalid (for POST calls). Valid values for the
Content-Typeheader are:application/x-www-form-urlencoded,multipart/form-data, or empty header.
403:
- Credentials are not valid
- Sending body data to 3scale for a GET request
- 404: Non-existent entity referenced, such as applications, metrics, etc.
409:
- Usage limits exceeded
- Application is not active
-
Application key is invalid or missing (for
app_id/app_keyauthentication method) - Referrer is not allowed or missing (when referrer filters are enabled and required)
- 422: Missing required parameters
Most of these error responses will also contain an XML body with a machine readable error category and a human readable explanation.
When using the standard API gateway configuration, any return code different from 200 provided by 3scale can result in a response to the client with one of the following codes:
- 403
- 404