Analytics
Share API performance insights across the organization with crisp, clear reporting.
Abstract
Chapter 1. Exporting Analytics
This article shows how to create scripts that extend the current capabilities of the built-in 3scale analytics.
By using the Account Management and Analytics API (Enterprise only), you can create scripts that get the custom information that you need in the format that you prefer. This article describes a particular use case, but the same approach can be used to get whatever data you need out of 3scale.
1.1. Why DIY?
3scale continously improves the features available on your API Admin Portal. However, you may be ahead of our developement plans and have a very specific need that’s not yet supported.
Luckily for you, there is a way around this potential frustration because 3scale always gives you the tools to access all your data. The mantra is: what 3scale does not do yet, you can always do yourself.
DIY has some costs – it takes some resources to write the scripts – but the cost is not too high, as we will show in this article. More importantly, DIY gives you total flexibility and control to implement any use case you can think of.
1.2. A real-world example
Recently a customer came to us with a very specific need that could not be solved with 3scale in a streamlined way.
They were onboarding thousands of new developers per week, which was fantastic news! They were able to survive such success thanks to the 3scale API Management Platform. Onboarding so many developers would be a daunting task – luckily 3scale provides automates necessities such as key provisioning, sign-up workflows, and email communication. So far so good.
There was, however, something that was not possible to do with 3scale, which was quite important for them. Since they are onboarding so many people, they needed a straight-forward way to classify the new developers based on their engagement with their API so that their operations and marketing teams could interact with the new developers more effectively.
Such a feature, at least at the required level of detail, is not yet available in 3scale’s built-in analytics tools. However since all the data is already available, it can be extracted using 3scale’s Account and Analytics API.
1.3. What kind of insight did the customer want?
They would like to know how many new developers have signed up for the free evaluation plan in the last 10 days, split up different ways.
First, they wanted to know how many developers signed up but didn’t ever use their API. What they wanted to do with this information is out of scope for this article, but it’s clearly valuable information that would help adoption of your API.
Second, they wanted to split the developers that had used their API into two groups:
- Developers that used it for a period of time – say the first half of the 10 days – and then stopped using the API. These developers tried it out, but became inactive.
- Developers that have been using the API consistently. For those, they would like to know the percent growth (or decline).
This information is available on 3scale’s built-in analytics. The problem is that there is no view to show it aggregated, which makes the whole experience quite cumbersome.
A typical answer to this problem would be this classification will be part of the upcoming analytics revamp. (Funny thing is that’s actually the case.) But that does not solve the problem if you need it now. We at 3scale want to give you the tools to do everything you need to do without depending on our release schedule.
1.4. Hands-on implementation
1.4.1. Winning recipe
This recipe usually gives better results in achieving custom work.
Tinker a bit with ActiveDocs. 3scale ActiveDocs, available in your Admin Portal, under the Documentation → 3scale API Docs section. 3scale has all of its APIs available as ActiveDocs so that you can try them out from your browser. This allows you to find the request that best serves your needs, get the request (curl-like) and get a grasp of the response. See an example…
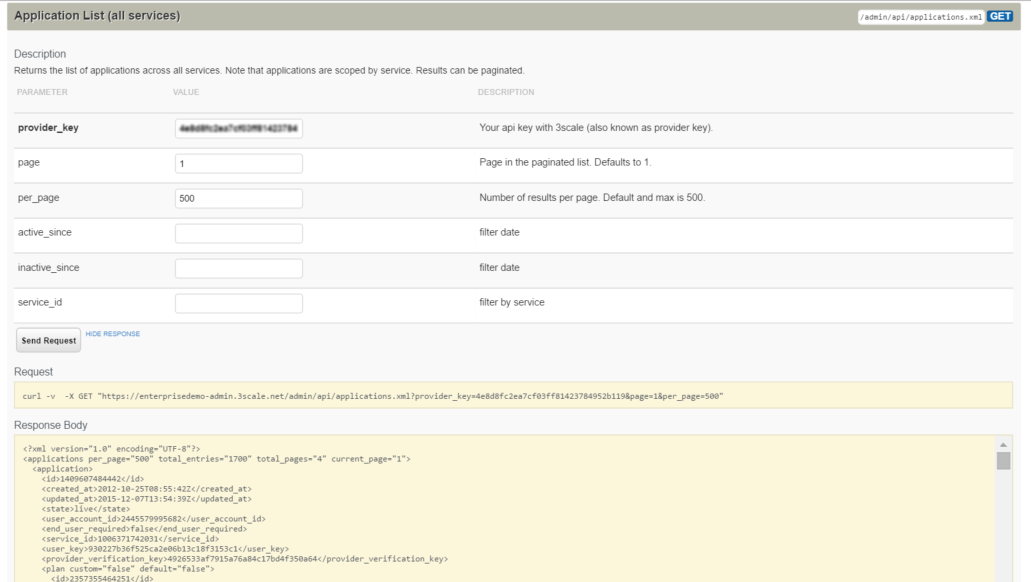
This is the ActiveDocs for the API request to fetch all applications that will be used on the script to extend the analytics.
- Once you’ve done the research with the ActiveDocs, put down the request on your scripting language of choice (ours is pedestrian Ruby). Thanks to the request and responses provided by ActiveDocs, it has never been easier to explore what the API does.
- Repeat until you have a script that does exactly what you need. For the example of the extended analytics, the script is available as a gist. You can try it out in your account.
As pedestrian as it sounds, this is the easiest way to proceed. The ActiveDocs let you quickly get a grasp of what the API is able to do. Then, it’s just a matter of finding which 3 or 4 requests are needed for the task you want to do and putting a script together.
1.4.2. Step-by-step guide
These were the steps taken to achieve the custom analytics that this customer wanted:
- Retrieve the full list of applications. This operation requires pagination, but as you can see, it’s dead simple.
def api_call_applications_list(domain, provider_key)
  done = false
  res = Array.new
  page = 1

      while !done
    url = "https://#{domain}/admin/api/applications.xml?provider_key=#{provider_key}&page=#{page}&per_page=100"
    page += 1
    response = RestClient.get url
    raise Exception.new("Wrong response code (#{response.code}) in request #{url}") if response.code!=200
    document = Nokogiri::XML(response.to_str)    done = document.xpath("applications/@current_page").text == document.xpath("applications/@total_pages").text
    document.xpath("//application").each do |item|
      app = Hash.new
      app["created_at"] = DateTime.parse(item.xpath("created_at").text)
      app["plan_name"] = item.xpath("plan/name").text
      app["service_id"] = item.xpath("plan/service_id").text
      app["account_id"] = item.xpath("user_account_id").text
      app["id"] = item.xpath("id").text
      res << app
    end
  end
  return res
end- Filter the applications that do not meet the criteria, i.e. the plan must be "evaluation" and they have to be newer than 10 days.
def filter_applications(domain, provider_key, plan_name, num_of_days)
  res = api_call_applications_list(domain, provider_key)
  res.each do |item|
    res.delete(item) if item["plan_name"] != plan_name
    res.delete(item) if item["created_at"] > (DateTime.now - num_of_days)
  end
  return res
end- Then for each application that meets the criteria, get its usage, meaning how many hits the application has had in the last 10 days.
def api_call_application_usage(domain, provider_key, application_id, metric, from, to, granularity)
  url = "https://#{domain}/stats/applications/#{application_id}/usage.xml?provider_key=#{provider_key}&metric_name=#{metric}&since=#{from}&until=#{to}&granularity=#{granularity}"
  response = RestClient.get url
  raise Exception.new("Wrong response code (#{response.code}) in request #{url}") if response.code!=200
  document = Nokogiri::XML(response.to_str)
  return document.xpath("//usage/data/values").text.split(",")
end- Finally, you must cross-reference the applications to the accounts because the information of the developers is stored in the account object.
def api_call_account_read(domain, provider_key, account_id)
  url = "https://#{domain}/admin/api/accounts/#{account_id}.xml?provider_key=#{provider_key}"
  response = RestClient.get url
  raise Exception.new("Wrong response code (#{response.code}) in request #{url}") if response.code!=200
  document = Nokogiri::XML(response.to_str)
  account = Hash.new
  account["email"] = document.xpath("//users/user/email").text
  account["name"] = document.xpath("//users/user/first_name").text + " " + document.xpath("//users/user/last_name").text
  return account
end
And that’s pretty much it. Now you only need to put everything together (you can get the full script as a gist) and you’re done. You have a script that gets the information that was not yet available on 3scale’s built-in analytics.
1.5. Conclusions
3scale is very DIY-friendly. We believe that anyone should be able to extend the current capabilities of any service that they’ve contracted. As much as we would like to think that we can cover all the bases, we will always be a bit behind in certain aspects, whether because it’s a super special need or simply because we are busy building other features. Whatever the case, we want to avoid blocking you when something is not possible right away. We give you full access to your data and a complete API toolset to work with it.
If you have scripts that you want to share with us and the rest of 3scale’s users, please send them to us. We would be happy to collect them and publish them.
Chapter 2. Out-of-the-box Analytics
By the end of this tutorial, you will be able to find visual information on an application’s traffic.
Each application using an API has a traffic trace in the 3scale system, which can be viewed from the Admin Portal as well as recovered by an API.
2.1. Step 1: Find the application
You can find the application from the Developers or Applications tabs or by searching as described in the finding applications tutorial.
2.2. Step 2: Understand the application display
Once you’ve located the application, you’ll see an overview screen with information about the application as shown in the following image.
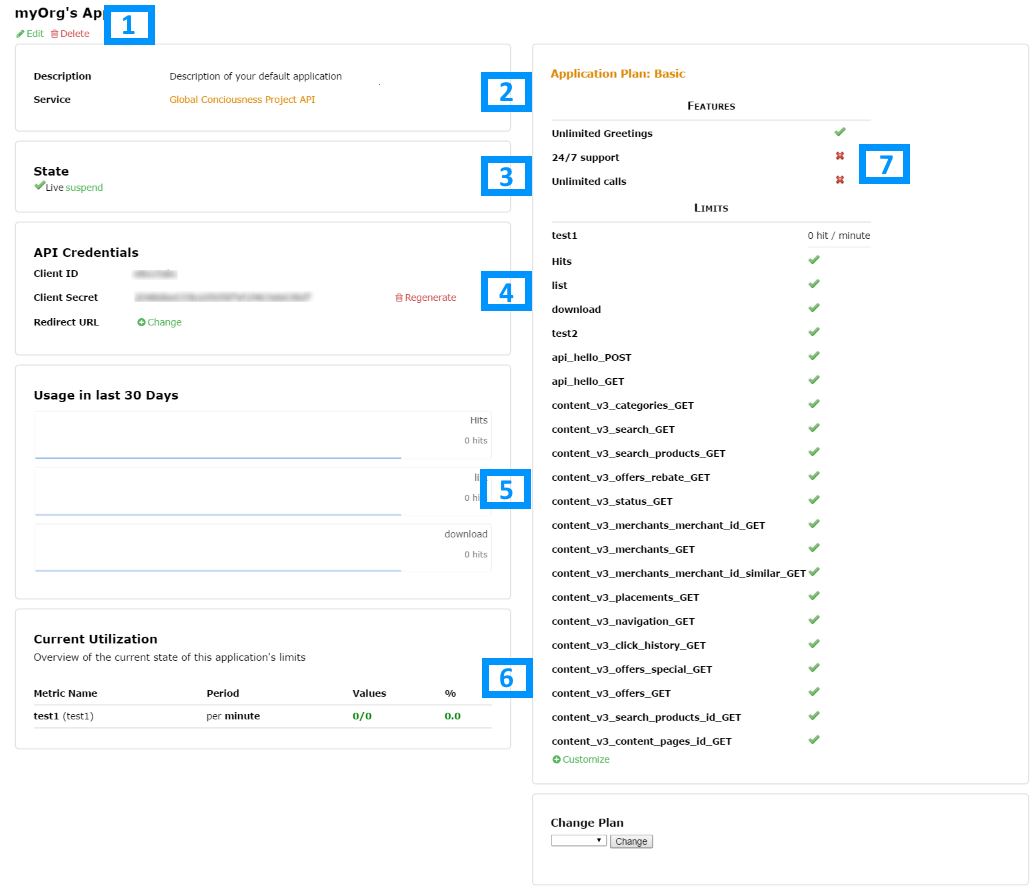
The items labeled in the diagram correspond to the following information:
- The name of the application given by the developer.
- Meta data captured for the application (learn how to set which data to capture in the advanced section).
- The status of the application – is it live or suspended?
- The current API identifiers, keys, and certificates that the application has. (This view varies depending on what authentication method was used to integrate the API into 3scale).
- A summary of traffic statistics for the application.
- Information on which application plan the application is on and which rate limits apply.
2.3. Step 3: Use the menu to access the full screen statistics view
On the screen shown in the screenshot above, you will find a breadcrumb like this on top of the app’s name: "Account 'account' > Application 'application name' > Analytics. Click on Analytics. This will take you to the usage charts view for the application as shown in the image below.
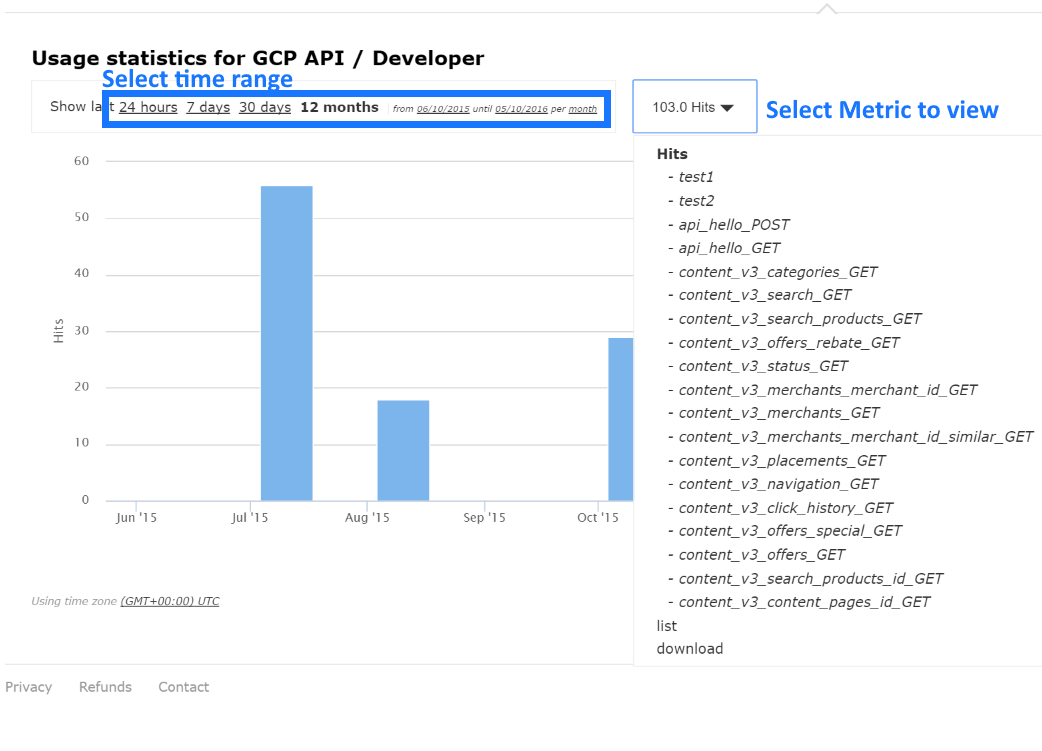
Controlling the metrics, methods, and time range allows you to check different types of data about the application.
Chapter 3. Response Code Tracking
This tutorial shows how to set up and use the response codes log in the 3scale system. Walk through the configuration steps and see how to use this feature in the long run.
Tracking response codes from your API is a great way to see how your clients are using it and to see in real time whether everything is fine with your servers.
3.1. Setup
Setting up response code logging is really simple. To enable this feature, just set the APICAST_RESPONSE_CODESenvironment variable to 1 or True.
<!-- Integration screen download screen -->
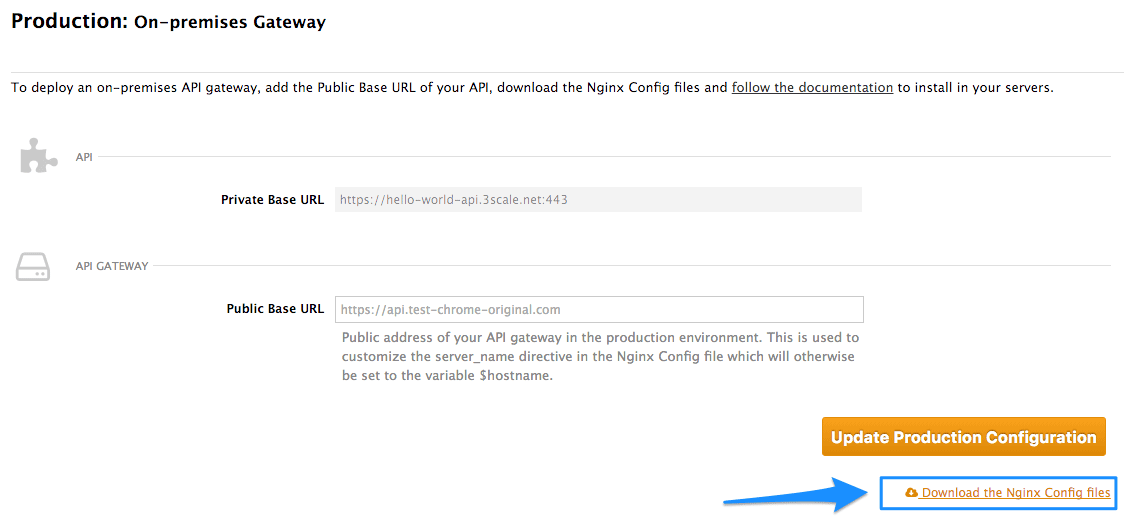
If you’ve integrated your API with 3scale using the plugin or API, you will have to add some additional code. You won’t be able to use the authrep call here ecause the response code is known after receiving a response from the API itself. Instead, you will have to split the authrep into two separate calls – authentication, to authenticate the request to the API; and report, to report the usage and log the response code into the 3scale system.
Since the code itself depends on the language, this example will show how the codes are logged in using the 3scale Service Management REST API. For the plugins, please refer to their respective GitHub repositories and adjust reporting accordingly to the RESTful example below.
In order implement the correct flow with response code reporting, you will have to split the authentication and reporting process into two steps. In the first step, you will authorize the call against some usage such as
curl -v -X GET "https://su1.3scale.net/transactions/authorize.xml?provider_key=PROVIDER_KEY&user_key=USER_KEY&usage%5Bhits%5D=1"
-
The second step after receiving a successful authentication respose from 3scale will be processing the call in your API and then reporting the usage together with the response code value. For this example, assume it will be a successfull
200response. The call to your API will then look like this:
curl -v -X POST "https://su1.3scale.net/transactions.xml" -d 'provider_key=PROVIDER_KEY&transactions%5B0%5D%5Buser_key%5D=USER_KEY&transactions%5B0%5D%5Busage%5D%5Bhits%5D=1&transactions%5B0%5D%5Blog%5D%5Bcode%5D=200'
The part of the code responsible for registering the response codes is the last transaction part: transactions%5B0%5D%5Blog%5D%5Bcode%5D=200 reporting. In this case, a 200 response code. The code above is just a URL-encoded version of transactions[0][log][code]=200
In other words, you have to report an additional transaction element, a code value part of a request log. The transactions[0] means that this code value is a part of the first transaction in a batch (in this case we are reporting only one transaction). The latter part of the hash is referring to response code value of the request log.
3.2. Verify the integration
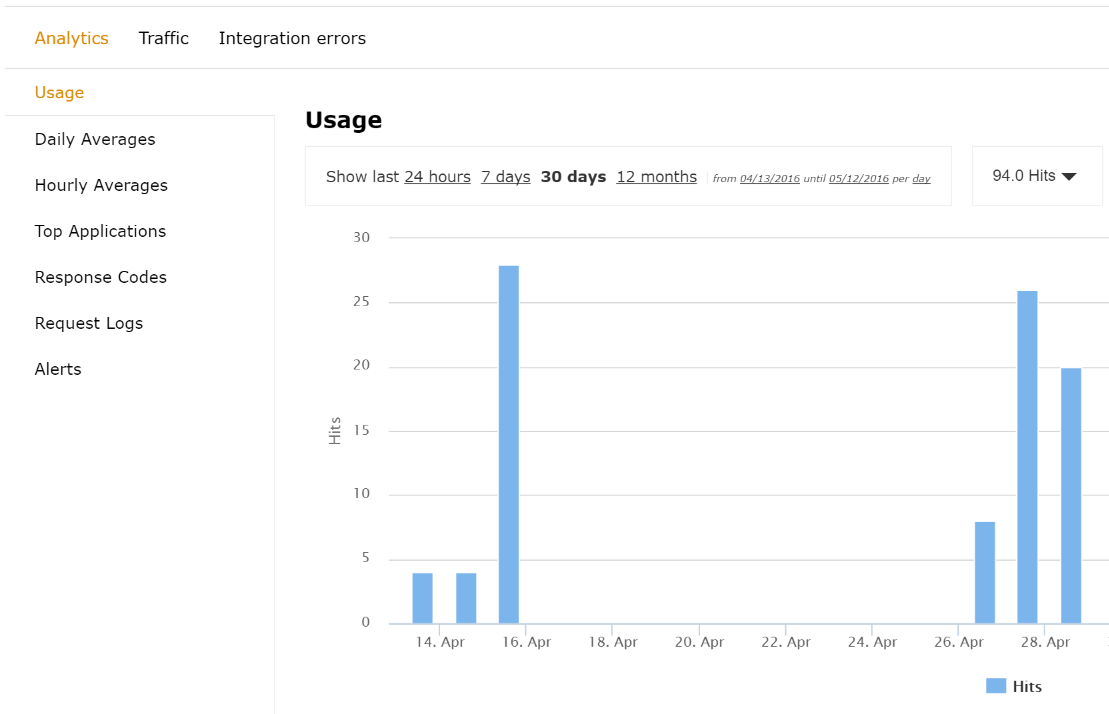
You have set up reporting response codes from your API to 3scale. How do you verify that it went well and monitor the responses? First you will have to call your API (through a 3scale traffic agent like NGINX proxy or plugin) with valid 3scale credentials. Then verify that the call was correctly reported on the Analytics > Usage page.
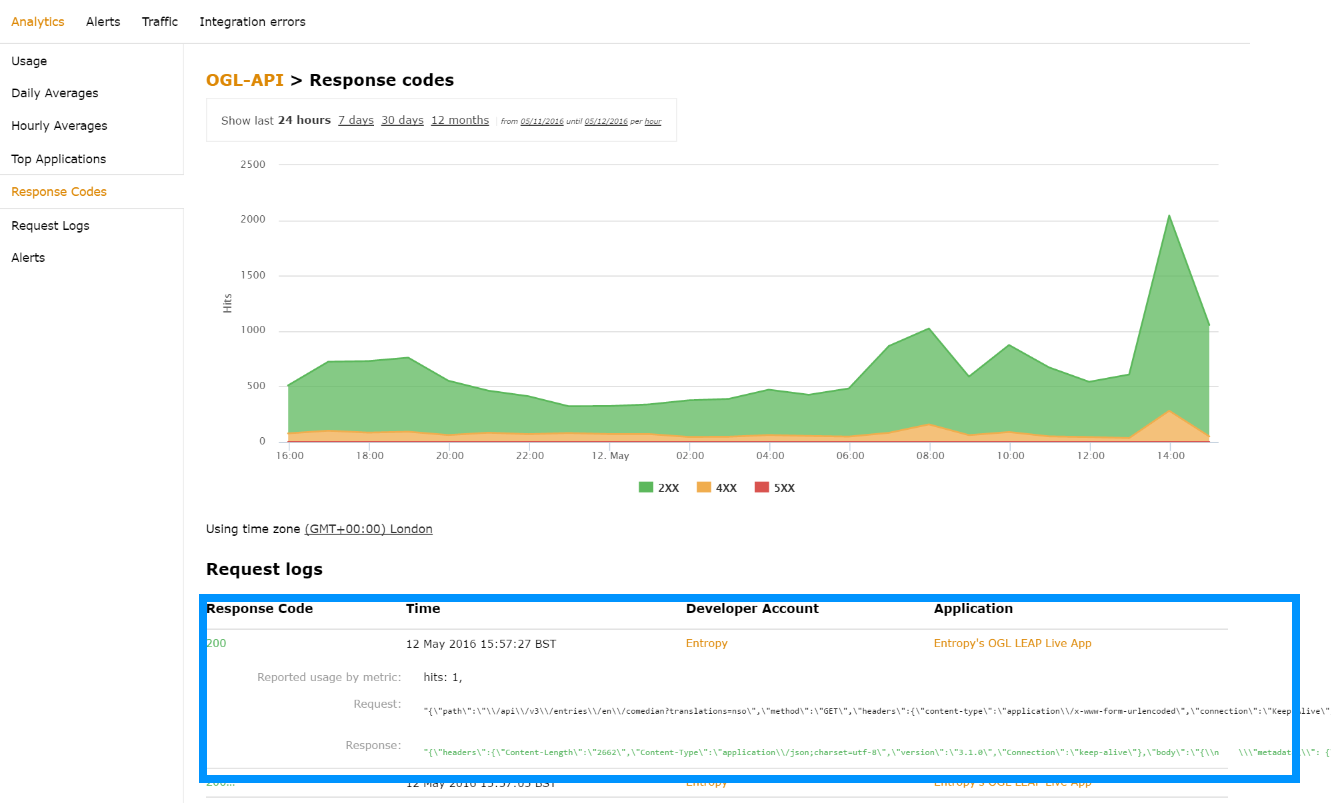
If everything is going well so far, go to the Analytics >Response codes page. You should be able to see a graph with your latest traffic divided by colors, depending if the response was 2xx, 4xx, or 5xx.
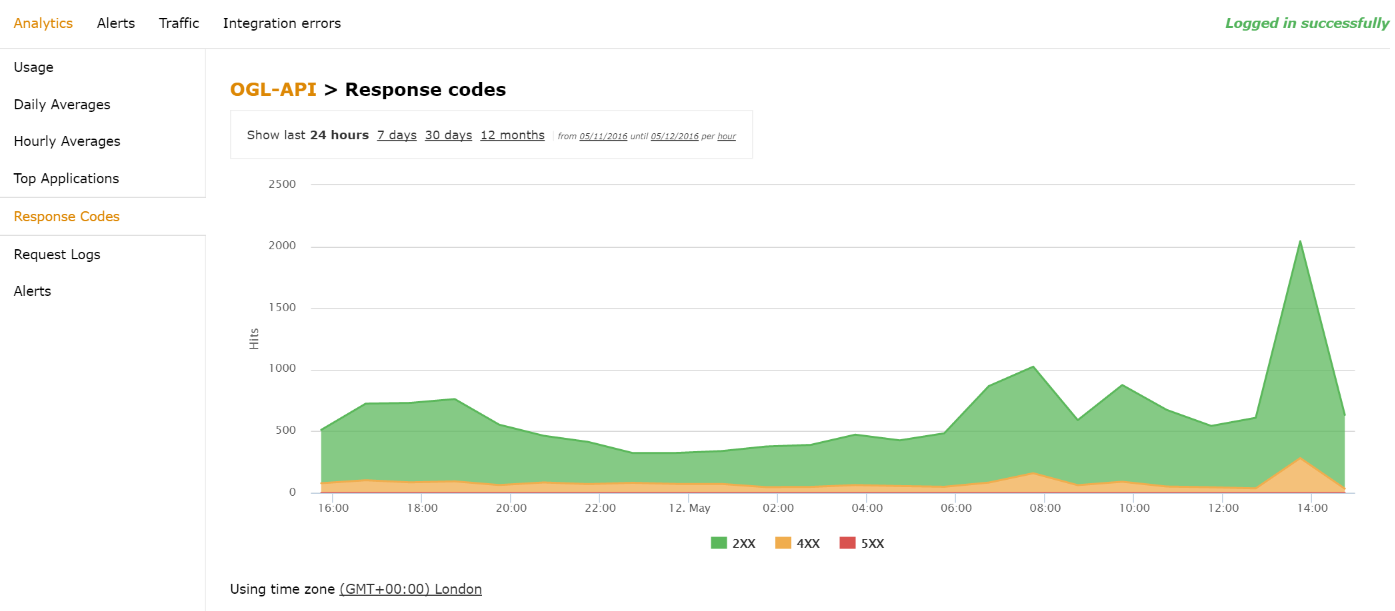
3.3. Monitoring response codes
The graph tool gives you the ability to view the history of response codes. You can also check the response code statistics for different periods of time and different levels of granularity. Simply click on the time selection bar and define the time period and granularity that will fit your needs.
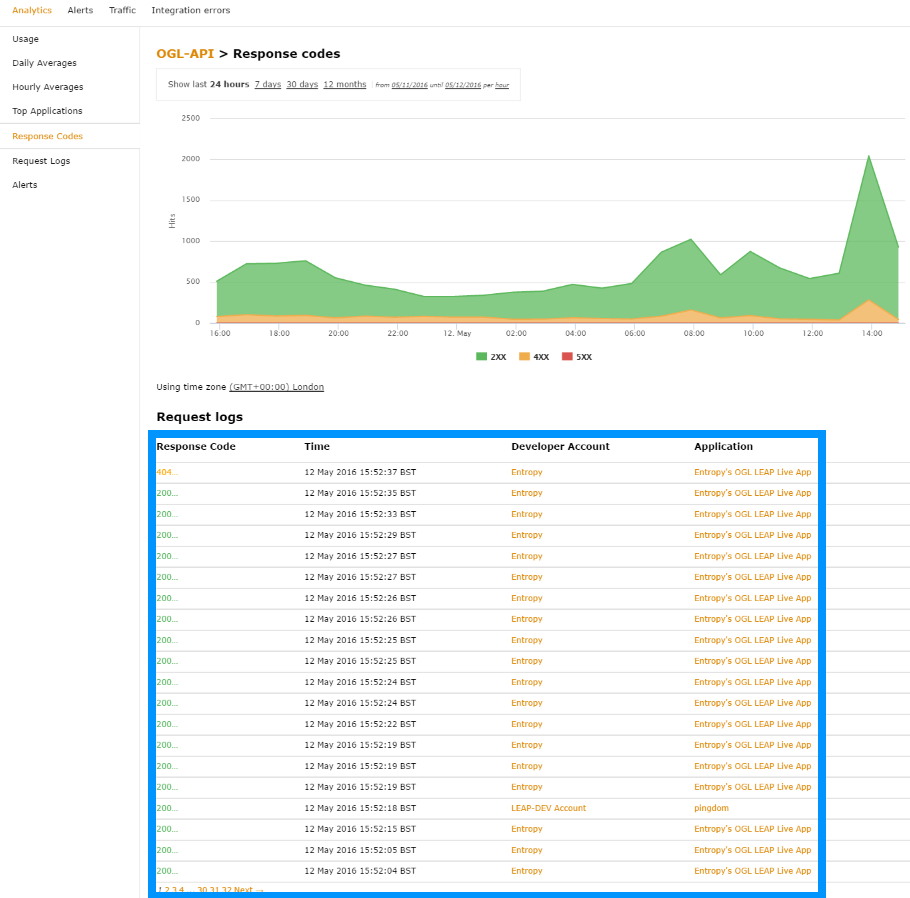
If you click on the response code itself, you will see the details of the call, which is very useful if you’re trying to debug the API or find out the exact details of a particular call.