
Chapter 2. Infrastructure Components
2.1. Kubernetes Infrastructure
2.1.1. Overview
Within OpenShift, Kubernetes manages containerized applications across a set of containers or hosts and provides mechanisms for deployment, maintenance, and application-scaling. Docker packages, instantiates, and runs containerized applications.
A Kubernetes cluster consists of one or more masters and a set of nodes.
2.1.2. Masters
The master is the host or hosts that contain the master components, including the API server, controller manager server, and etcd. The master manages nodes in its Kubernetes cluster and schedules pods to run on nodes.
Table 2.1. Master Components
| Component | Description |
|---|---|
| API Server | The Kubernetes API server validates and configures the data for pods, services, and replication controllers. It also assigns pods to nodes and synchronizes pod information with service configuration. |
| etcd | etcd stores the persistent master state while other components watch etcd for changes to bring themselves into the desired state. etcd can be optionally configured for high availability, typically deployed with 2n+1 peer services. |
| Controller Manager Server | The controller manager server watches etcd for changes to replication controller objects and then uses the API to enforce the desired state. |
| Pacemaker | Optional, used when configuring highly-available masters. Pacemaker is the core technology of the High Availability Add-on for Red Hat Enterprise Linux, providing consensus, fencing, and service management. It can be run on all master hosts to ensure that all active-passive components have one instance running. |
| Virtual IP | Optional, used when configuring highly-available masters. The virtual IP (VIP) is the single point of contact, but not a single point of failure, for all OpenShift clients that:
There is one VIP and it is managed by Pacemaker. |
2.1.2.1. High Availability Masters
You can optionally configure your masters for high availability (HA) to ensure that the cluster has no single point of failure.
To mitigate concerns about availability of the master, two activities are recommended:
- A runbook entry should be created for reconstructing the master. A runbook entry is a necessary backstop for any highly-available service. Additional solutions merely control the frequency that the runbook must be consulted. For example, a cold standby of the master host can adequately fulfill SLAs that require no more than minutes of downtime for creation of new applications or recovery of failed application components.
- Use a high availability solution to configure your masters and ensure that the cluster has no single point of failure. The advanced installation method provides specific examples using Pacemaker as the management technology, which Red Hat recommends. However, you can take the concepts and apply them towards your existing high availability solutions.
In production OpenShift Enterprise clusters, you must maintain high availability of the API Server load balancer. If the API Server load balancer is not available, nodes cannot report their status, all their pods are marked dead, and the pods' endpoints are removed from the service.
In addition to configuring HA for OpenShift Enterprise, you must separately configure HA for the API Server load balancer. To configure HA, it is much preferred to integrate an enterprise load balancer (LB) such as an F5 Big-IP™ or a Citrix Netscaler™ appliance. If such solutions are not available, it is possible to run multiple HAProxy load balancers and use Keepalived to provide a floating virtual IP address for HA. However, this solution is not recommended for production instances.
Moving from a single master cluster to multiple masters after installation is not supported.
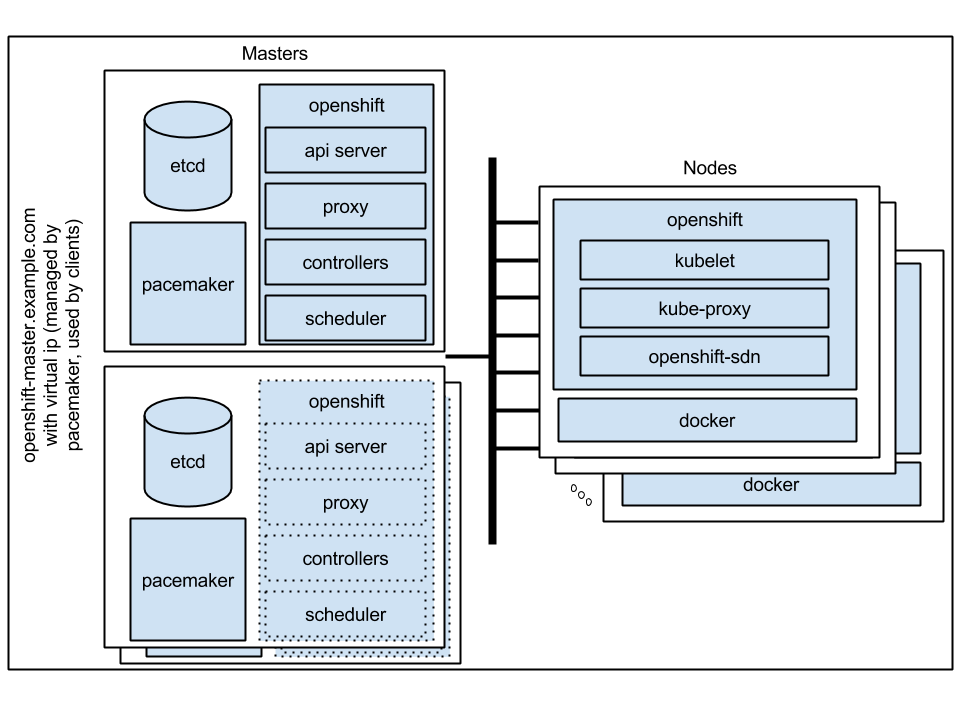
When using Pacemaker, master components have the following availability:
Table 2.2. Availability Matrix
| Role | Style | Notes |
|---|---|---|
| etcd | Active-active | Fully redundant deployment with load balancing |
| Master service | Active-passive | One active at a time, managed by Pacemaker |
| Pacemaker | Active-active | Fully redundant deployment |
| Virtual IP | Active-passive | One active at a time, managed by Pacemaker |
Figure 2.1. Highly-available Masters Using Pacemaker
2.1.3. Nodes
A node provides the runtime environments for containers. Each node in a Kubernetes cluster has the required services to be managed by the master. Nodes also have the required services to run pods, including Docker, a kubelet, and a service proxy.
OpenShift creates nodes from a cloud provider, physical systems, or virtual systems. Kubernetes interacts with node objects that are a representation of those nodes. The master uses the information from node objects to validate nodes with health checks. A node is ignored until it passes the health checks, and the master continues checking nodes until they are valid. The Kubernetes documentation has more information on node management.
Administrators can manage nodes in an OpenShift instance using the CLI. To define full configuration and security options when launching node servers, use dedicated node configuration files.
2.1.3.1. Kubelet
Each node has a kubelet that updates the node as specified by a container manifest, which is a YAML file that describes a pod. The kubelet uses a set of manifests to ensure that its containers are started and that they continue to run. A sample manifest can be found in the Kubernetes documentation.
A container manifest can be provided to a kubelet by:
- A file path on the command line that is checked every 20 seconds.
- An HTTP endpoint passed on the command line that is checked every 20 seconds.
- The kubelet watching an etcd server, such as /registry/hosts/$(hostname -f), and acting on any changes.
- The kubelet listening for HTTP and responding to a simple API to submit a new manifest.
2.1.3.2. Service Proxy
Each node also runs a simple network proxy that reflects the services defined in the API on that node. This allows the node to do simple TCP and UDP stream forwarding across a set of back ends.
2.1.3.3. Node Object Definition
The following is an example node object definition in Kubernetes:
apiVersion: v1 1
kind: Node 2
metadata:
  creationTimestamp: null
  labels: 3
    kubernetes.io/hostname: node1.example.com
  name: node1.example.com 4
spec:
  externalID: node1.example.com 5
status:
  nodeInfo:
    bootID: ""
    containerRuntimeVersion: ""
    kernelVersion: ""
    kubeProxyVersion: ""
    kubeletVersion: ""
    machineID: ""
    osImage: ""
    systemUUID: ""
- 1
apiVersiondefines the API version to use.- 2
kindset toNodeidentifies this as a definition for a node object.- 3
metadata.labelslists any labels that have been added to the node.- 4
metadata.nameis a required value that defines the name of the node object. This value is shown in theNAMEcolumn when running theoc get nodescommand.- 5
spec.externalIDdefines the fully-qualified domain name where the node can be reached. Defaults to themetadata.namevalue when empty.
The REST API Reference has more details on these definitions.
2.2. Image Registry
2.2.1. Overview
OpenShift can utilize any server implementing the Docker registry API as a source of images, including the canonical Docker Hub, private registries run by third parties, and the integrated OpenShift registry.
2.2.2. Integrated OpenShift Registry
OpenShift provides an integrated Docker registry that adds the ability to provision new image repositories on the fly. This allows users to automatically have a place for their builds to push the resulting images.
Whenever a new image is pushed to the integrated registry, the registry notifies OpenShift about the new image, passing along all the information about it, such as the namespace, name, and image metadata. Different pieces of OpenShift react to new images, creating new builds and deployments.
2.2.3. Third Party Registries
OpenShift can create containers using images from third party registries, but it is unlikely that these registries offer the same image notification support as the integrated OpenShift registry. In this situation OpenShift will fetch tags from the remote registry upon imagestream creation. Refreshing the fetched tags is as simple as running oc import-image <stream>. When new images are detected, the previously-described build and deployment reactions occur.
To create an image stream from an external registry, set the spec.dockerImageRepository field appropriately. For example:
{
  "apiVersion": "v1",
  "kind": "ImageStream",
  "metadata": {
    "name": "ruby"
  },
  "spec": {
    "dockerImageRepository": "openshift/ruby-20-centos7"
  }
}
After OpenShift synchronizes the tag and image metadata, it looks something like this:
{
  "kind": "ImageStream",
  "apiVersion": "v1",
  "metadata": {
    "name": "ruby",
    "namespace": "default",
    "selfLink": "/osapi/v1/namespaces/default/imagestreams/ruby",
    "uid": "9990ea5f-f35a-11e4-937e-001c422dcd49",
    "resourceVersion": "53",
    "creationTimestamp": "2015-05-05T19:11:57Z",
    "annotations": {
      "openshift.io/image.dockerRepositoryCheck": "2015-05-05T19:12:00Z"
    }
  },
  "spec": {
    "dockerImageRepository": "openshift/ruby-20-centos7"
  },
  "status": {
    "dockerImageRepository": "openshift/ruby-20-centos7",
    "tags": [
      {
        "tag": "latest",
        "items": [
          {
            "created": "2015-05-05T19:11:58Z",
            "dockerImageReference": "openshift/ruby-20-centos7:latest",
            "image": "94439378e4546d72ef221c47fe2ac30065bcc3a98c25bc51bed77ec00efabb95"
          }
        ]
      },
      {
        "tag": "v0.4",
        "items": [
          {
            "created": "2015-05-05T19:11:59Z",
            "dockerImageReference": "openshift/ruby-20-centos7:v0.4",
            "image": "c7dbf059225847a7bfb4f40bc335ad7e70defc913de1a28aabea3a2072844a3f"
          }
        ]
      }
    ]
  }
}
Querying external registries to synchronize tag and image metadata is not currently an automated process. To resynchronize manually, run oc import-image <stream>. Within a short amount of time, OpenShift will communicate with the external registry to get up to date information about the Docker image repository associated with the image stream.
2.2.3.1. Authentication
OpenShift can communicate with registries to access private image repositories using credentials supplied by the user. This allows OpenShift to push and pull images to and from private repositories. The Authentication topic has more information.
2.3. Web Console
2.3.1. Overview
The OpenShift web console is a user interface accessible from a web browser. Developers can use the web console to visualize, browse, and manage the contents of projects.
The web console is started as part of the master. All static assets required to run the web console are served from the openshift binary. Administrators can also customize the web console using extensions, which let you run scripts and load custom stylesheets when the web console loads. You can change the look and feel of nearly any aspect of the user interface in this way.
When you access the web console from a browser, it first loads all required static assets. It then makes requests to the OpenShift APIs using the values defined from the openshift start option --public-master, or from the related master configuration file parameter masterPublicURL. The web console uses WebSockets to maintain a persistent connection with the API server and receive updated information as soon as it is available.
JavaScript must be enabled to use the web console. For the best experience, use a web browser that supports WebSockets.
Figure 2.2. Web Console Request Architecture

The configured host names and IP addresses for the web console are whitelisted to access the API server safely even when the browser would consider the requests to be cross-origin. To access the API server from a web application using a different host name, you must whitelist that host name by specifying the --cors-allowed-origins option on openshift start or from the related master configuration file parameter corsAllowedOrigins.
2.3.2. Browser Requirements
Review the tested integrations for OpenShift Enterprise. The following browser versions and operating systems can be used to access the web console.
Table 2.3. Browser Requirements
| Browser (Latest Stable) | Operating System |
|---|---|
| Firefox | Fedora 23, Windows 8 |
| Internet Explorer | Windows 8 |
| Chrome | Fedora 23, Windows 8, and MacOSX |
| Safari | MacOSX, iPad 2, iPhone 4 |
2.3.3. Project Overviews
After logging in, the web console provides developers with an overview for the currently selected project:
Figure 2.3. Web Console Project Overview
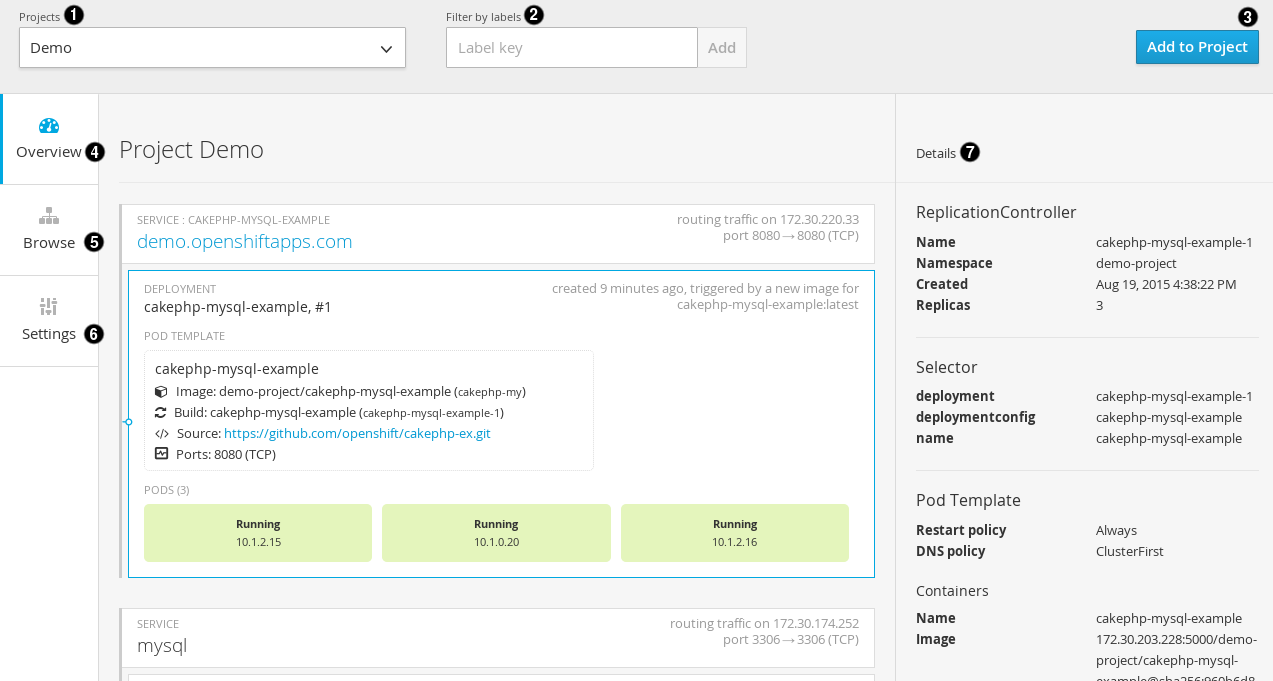
- The project selector allows you to switch between projects you have access to.
- Create new applications using a source repository or using a template.
- The Overview tab (currently selected) visualizes the contents of your project with a high-level view of each component.
- The Browse tab explores the different objects types within your project: Builds, Deployments, Image Streams, Pods, and Services.
- The Settings tab provides general information about your project, as well as the quota and resource limits that are set on your project.
- When you click on one of your objects in the Overview page, the Details pane displays detailed information about that object. In this example, the cakephp-mysql-example deployment is selected, and the Details pane is displaying details on the related replication controller.
2.3.4. JVM Console
This feature is currently in Technology Preview and not intended for production use.
For pods based on Java images, the web console also exposes access to a hawt.io-based JVM console for viewing and managing any relevant integration components. A Connect link is displayed in the pod’s details on the Browse → Pods page, provided the container has a port named jolokia.
Figure 2.4. Pod with a Link to the JVM Console

After connecting to the JVM console, different pages are displayed depending on which components are relevant to the connected pod.
Figure 2.5. JVM Console

The following pages are available:
| Page | Description |
|---|---|
| JMX | View and manage JMX domains and mbeans. |
| Threads | View and monitor the state of threads. |
| ActiveMQ | View and manage Apache ActiveMQ brokers. |
| Camel | View and and manage Apache Camel routes and dependencies. |