
Chapter 4. Remote health monitoring with connected clusters
4.1. About remote health monitoring
OpenShift Dedicated collects telemetry and configuration data about your cluster and reports it to Red Hat by using the Telemeter Client and the Insights Operator. The data that is provided to Red Hat enables the benefits outlined in this document.
A cluster that reports data to Red Hat through Telemetry and the Insights Operator is considered a connected cluster.
Telemetry is the term that Red Hat uses to describe the information being sent to Red Hat by the OpenShift Dedicated Telemeter Client. Lightweight attributes are sent from connected clusters to Red Hat to enable subscription management automation, monitor the health of clusters, assist with support, and improve customer experience.
The Insights Operator gathers OpenShift Dedicated configuration data and sends it to Red Hat. The data is used to produce insights about potential issues that a cluster might be exposed to. These insights are communicated to cluster administrators on OpenShift Cluster Manager.
More information is provided in this document about these two processes.
Telemetry and Insights Operator benefits
Telemetry and the Insights Operator enable the following benefits for end-users:
- Enhanced identification and resolution of issues. Events that might seem normal to an end-user can be observed by Red Hat from a broader perspective across a fleet of clusters. Some issues can be more rapidly identified from this point of view and resolved without an end-user needing to open a support case or file a Jira issue.
-
Advanced release management. OpenShift Dedicated offers the
candidate,fast, andstablerelease channels, which enable you to choose an update strategy. The graduation of a release fromfasttostableis dependent on the success rate of updates and on the events seen during upgrades. With the information provided by connected clusters, Red Hat can improve the quality of releases tostablechannels and react more rapidly to issues found in thefastchannels. - Targeted prioritization of new features and functionality. The data collected provides insights about which areas of OpenShift Dedicated are used most. With this information, Red Hat can focus on developing the new features and functionality that have the greatest impact for our customers.
- A streamlined support experience. You can provide a cluster ID for a connected cluster when creating a support ticket on the Red Hat Customer Portal. This enables Red Hat to deliver a streamlined support experience that is specific to your cluster, by using the connected information. This document provides more information about that enhanced support experience.
- Predictive analytics. The insights displayed for your cluster on OpenShift Cluster Manager are enabled by the information collected from connected clusters. Red Hat is investing in applying deep learning, machine learning, and artificial intelligence automation to help identify issues that OpenShift Dedicated clusters are exposed to.
On OpenShift Dedicated, remote health reporting is always enabled. You cannot opt out of it.
4.1.1. About Telemetry
Telemetry sends a carefully chosen subset of the cluster monitoring metrics to Red Hat. The Telemeter Client fetches the metrics values every four minutes and thirty seconds and uploads the data to Red Hat. These metrics are described in this document.
This stream of data is used by Red Hat to monitor the clusters in real-time and to react as necessary to problems that impact our customers. It also allows Red Hat to roll out OpenShift Dedicated upgrades to customers to minimize service impact and continuously improve the upgrade experience.
This debugging information is available to Red Hat Support and Engineering teams with the same restrictions as accessing data reported through support cases. All connected cluster information is used by Red Hat to help make OpenShift Dedicated better and more intuitive to use.
4.1.1.1. Information collected by Telemetry
The following information is collected by Telemetry:
4.1.1.1.1. System information
- Version information, including the OpenShift Dedicated cluster version and installed update details that are used to determine update version availability
- Update information, including the number of updates available per cluster, the channel and image repository used for an update, update progress information, and the number of errors that occur in an update
- The unique random identifier that is generated during an installation
- Configuration details that help Red Hat Support to provide beneficial support for customers, including node configuration at the cloud infrastructure level, hostnames, IP addresses, Kubernetes pod names, namespaces, and services
- The OpenShift Dedicated framework components installed in a cluster and their condition and status
- Events for all namespaces listed as "related objects" for a degraded Operator
- Information about degraded software
- Information about the validity of certificates
- The name of the provider platform that OpenShift Dedicated is deployed on and the data center location
4.1.1.1.2. Sizing Information
- Sizing information about clusters, machine types, and machines, including the number of CPU cores and the amount of RAM used for each
- The number of etcd members and the number of objects stored in the etcd cluster
4.1.1.1.3. Usage information
- Usage information about components, features, and extensions
- Usage details about Technology Previews and unsupported configurations
Telemetry does not collect identifying information such as usernames or passwords. Red Hat does not intend to collect personal information. If Red Hat discovers that personal information has been inadvertently received, Red Hat will delete such information. To the extent that any telemetry data constitutes personal data, please refer to the Red Hat Privacy Statement for more information about Red Hat’s privacy practices.
4.1.1.2. User Telemetry
Red Hat collects anonymized user data from your browser. This anonymized data includes what pages, features, and resource types that the user of all clusters with enabled telemetry uses.
Other considerations:
- User events are grouped as a SHA-1 hash.
-
User’s IP address is saved as
0.0.0.0. - User names and IP addresses are never saved as separate values.
Additional resources
- See Showing data collected by Telemetry for details about how to list the attributes that Telemetry gathers from Prometheus in OpenShift Dedicated.
- See the upstream cluster-monitoring-operator source code for a list of the attributes that Telemetry gathers from Prometheus.
4.1.2. About the Insights Operator
The Insights Operator periodically gathers configuration and component failure status and, by default, reports that data every two hours to Red Hat. This information enables Red Hat to assess configuration and deeper failure data than is reported through Telemetry.
Users of OpenShift Dedicated can display the report of each cluster in the Insights Advisor service on Red Hat Hybrid Cloud Console. If any issues have been identified, Insights provides further details and, if available, steps on how to solve a problem.
The Insights Operator does not collect identifying information, such as user names, passwords, or certificates. See Red Hat Insights Data & Application Security for information about Red Hat Insights data collection and controls.
Red Hat uses all connected cluster information to:
- Identify potential cluster issues and provide a solution and preventive actions in the Insights Advisor service on Red Hat Hybrid Cloud Console
- Improve OpenShift Dedicated by providing aggregated and critical information to product and support teams
- Make OpenShift Dedicated more intuitive
4.1.2.1. Information collected by the Insights Operator
The following information is collected by the Insights Operator:
- General information about your cluster and its components to identify issues that are specific to your OpenShift Dedicated version and environment
- Configuration files, such as the image registry configuration, of your cluster to determine incorrect settings and issues that are specific to parameters you set
- Errors that occur in the cluster components
- Progress information of running updates, and the status of any component upgrades
- Details of the platform that OpenShift Dedicated is deployed on, such as Amazon Web Services, and the region that the cluster is located in
-
If an Operator reports an issue, information is collected about core OpenShift Dedicated pods in the
openshift-*andkube-*projects. This includes state, resource, security context, volume information, and more.
Additional resources
- The Insights Operator source code is available for review and contribution. See the Insights Operator upstream project for a list of the items collected by the Insights Operator.
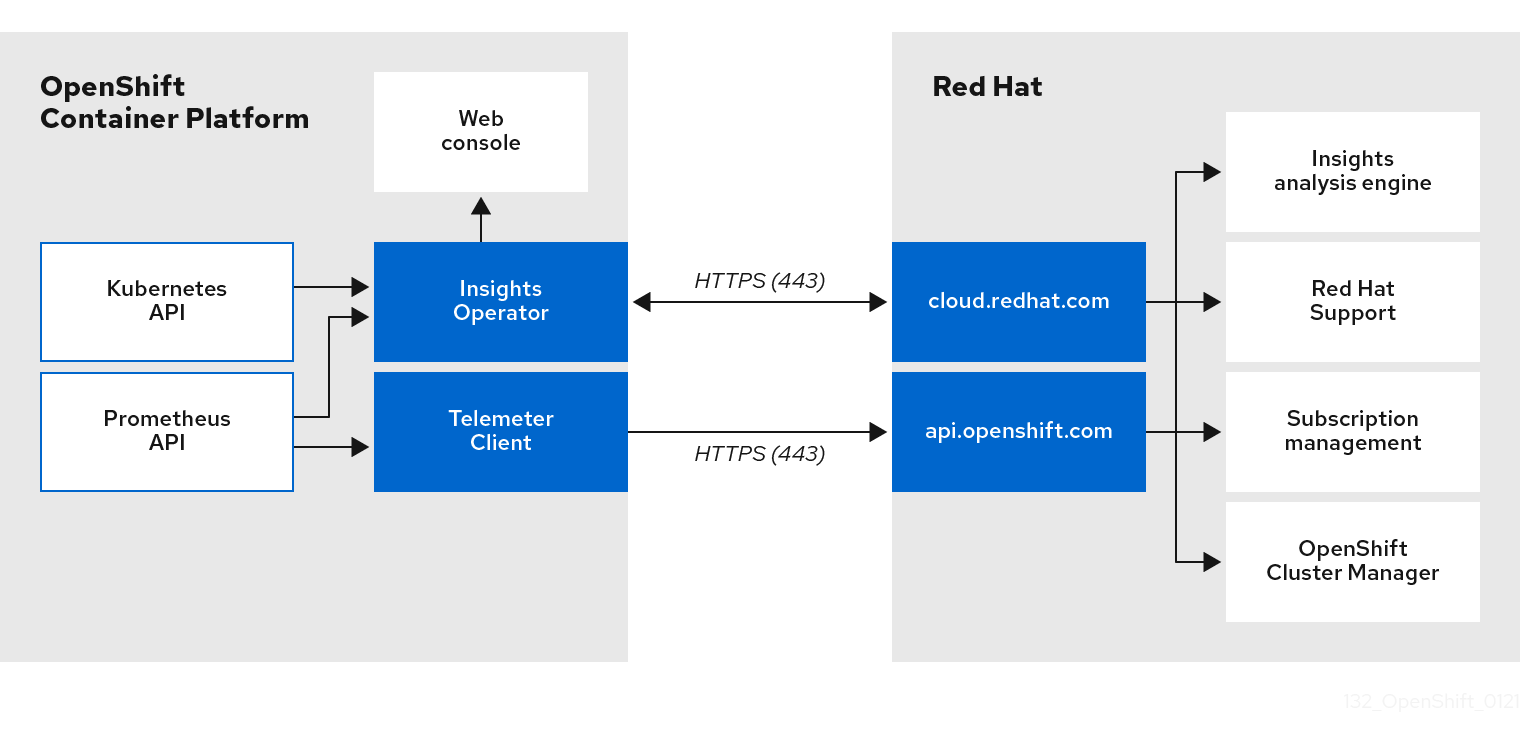
4.1.3. Understanding Telemetry and Insights Operator data flow
The Telemeter Client collects selected time series data from the Prometheus API. The time series data is uploaded to api.openshift.com every four minutes and thirty seconds for processing.
The Insights Operator gathers selected data from the Kubernetes API and the Prometheus API into an archive. The archive is uploaded to OpenShift Cluster Manager every two hours for processing. The Insights Operator also downloads the latest Insights analysis from OpenShift Cluster Manager. This is used to populate the Insights status pop-up that is included in the Overview page in the OpenShift Dedicated web console.
All of the communication with Red Hat occurs over encrypted channels by using Transport Layer Security (TLS) and mutual certificate authentication. All of the data is encrypted in transit and at rest.
Access to the systems that handle customer data is controlled through multi-factor authentication and strict authorization controls. Access is granted on a need-to-know basis and is limited to required operations.
Telemetry and Insights Operator data flow
Additional resources
- See Monitoring overview for more information about the OpenShift Dedicated monitoring stack.
4.1.4. Additional details about how remote health monitoring data is used
The information collected to enable remote health monitoring is detailed in Information collected by Telemetry and Information collected by the Insights Operator.
As further described in the preceding sections of this document, Red Hat collects data about your use of the Red Hat Product(s) for purposes such as providing support and upgrades, optimizing performance or configuration, minimizing service impacts, identifying and remediating threats, troubleshooting, improving the offerings and user experience, responding to issues, and for billing purposes if applicable.
Collection safeguards
Red Hat employs technical and organizational measures designed to protect the telemetry and configuration data.
Sharing
Red Hat may share the data collected through Telemetry and the Insights Operator internally within Red Hat to improve your user experience. Red Hat may share telemetry and configuration data with its business partners in an aggregated form that does not identify customers to help the partners better understand their markets and their customers’ use of Red Hat offerings or to ensure the successful integration of products jointly supported by those partners.
Third parties
Red Hat may engage certain third parties to assist in the collection, analysis, and storage of the Telemetry and configuration data.
4.2. Showing data collected by remote health monitoring
User control / enabling and disabling telemetry and configuration data collection
As an administrator, you can review the metrics collected by Telemetry and the Insights Operator.
4.2.1. Showing data collected by Telemetry
You can view the cluster and components time series data captured by Telemetry.
Prerequisites
-
You have installed the OpenShift Container Platform CLI (
oc). -
You have access to the cluster as a user with the
dedicated-adminrole.
Procedure
- Log in to a cluster.
Run the following command, which queries a cluster’s Prometheus service and returns the full set of time series data captured by Telemetry:
$ curl -G -k -H "Authorization: Bearer $(oc whoami -t)" \
https://$(oc get route prometheus-k8s-federate -n \
openshift-monitoring -o jsonpath="{.spec.host}")/federate \
--data-urlencode 'match[]={__name__=~"cluster:usage:.*"}' \
--data-urlencode 'match[]={__name__="count:up0"}' \
--data-urlencode 'match[]={__name__="count:up1"}' \
--data-urlencode 'match[]={__name__="cluster_version"}' \
--data-urlencode 'match[]={__name__="cluster_version_available_updates"}' \
--data-urlencode 'match[]={__name__="cluster_version_capability"}' \
--data-urlencode 'match[]={__name__="cluster_operator_up"}' \
--data-urlencode 'match[]={__name__="cluster_operator_conditions"}' \
--data-urlencode 'match[]={__name__="cluster_version_payload"}' \
--data-urlencode 'match[]={__name__="cluster_installer"}' \
--data-urlencode 'match[]={__name__="cluster_infrastructure_provider"}' \
--data-urlencode 'match[]={__name__="cluster_feature_set"}' \
--data-urlencode 'match[]={__name__="instance:etcd_object_counts:sum"}' \
--data-urlencode 'match[]={__name__="ALERTS",alertstate="firing"}' \
--data-urlencode 'match[]={__name__="code:apiserver_request_total:rate:sum"}' \
--data-urlencode 'match[]={__name__="cluster:capacity_cpu_cores:sum"}' \
--data-urlencode 'match[]={__name__="cluster:capacity_memory_bytes:sum"}' \
--data-urlencode 'match[]={__name__="cluster:cpu_usage_cores:sum"}' \
--data-urlencode 'match[]={__name__="cluster:memory_usage_bytes:sum"}' \
--data-urlencode 'match[]={__name__="openshift:cpu_usage_cores:sum"}' \
--data-urlencode 'match[]={__name__="openshift:memory_usage_bytes:sum"}' \
--data-urlencode 'match[]={__name__="workload:cpu_usage_cores:sum"}' \
--data-urlencode 'match[]={__name__="workload:memory_usage_bytes:sum"}' \
--data-urlencode 'match[]={__name__="cluster:virt_platform_nodes:sum"}' \
--data-urlencode 'match[]={__name__="cluster:node_instance_type_count:sum"}' \
--data-urlencode 'match[]={__name__="cnv:vmi_status_running:count"}' \
--data-urlencode 'match[]={__name__="cluster:vmi_request_cpu_cores:sum"}' \
--data-urlencode 'match[]={__name__="node_role_os_version_machine:cpu_capacity_cores:sum"}' \
--data-urlencode 'match[]={__name__="node_role_os_version_machine:cpu_capacity_sockets:sum"}' \
--data-urlencode 'match[]={__name__="subscription_sync_total"}' \
--data-urlencode 'match[]={__name__="olm_resolution_duration_seconds"}' \
--data-urlencode 'match[]={__name__="csv_succeeded"}' \
--data-urlencode 'match[]={__name__="csv_abnormal"}' \
--data-urlencode 'match[]={__name__="cluster:kube_persistentvolumeclaim_resource_requests_storage_bytes:provisioner:sum"}' \
--data-urlencode 'match[]={__name__="cluster:kubelet_volume_stats_used_bytes:provisioner:sum"}' \
--data-urlencode 'match[]={__name__="ceph_cluster_total_bytes"}' \
--data-urlencode 'match[]={__name__="ceph_cluster_total_used_raw_bytes"}' \
--data-urlencode 'match[]={__name__="ceph_health_status"}' \
--data-urlencode 'match[]={__name__="odf_system_raw_capacity_total_bytes"}' \
--data-urlencode 'match[]={__name__="odf_system_raw_capacity_used_bytes"}' \
--data-urlencode 'match[]={__name__="odf_system_health_status"}' \
--data-urlencode 'match[]={__name__="job:ceph_osd_metadata:count"}' \
--data-urlencode 'match[]={__name__="job:kube_pv:count"}' \
--data-urlencode 'match[]={__name__="job:odf_system_pvs:count"}' \
--data-urlencode 'match[]={__name__="job:ceph_pools_iops:total"}' \
--data-urlencode 'match[]={__name__="job:ceph_pools_iops_bytes:total"}' \
--data-urlencode 'match[]={__name__="job:ceph_versions_running:count"}' \
--data-urlencode 'match[]={__name__="job:noobaa_total_unhealthy_buckets:sum"}' \
--data-urlencode 'match[]={__name__="job:noobaa_bucket_count:sum"}' \
--data-urlencode 'match[]={__name__="job:noobaa_total_object_count:sum"}' \
--data-urlencode 'match[]={__name__="odf_system_bucket_count", system_type="OCS", system_vendor="Red Hat"}' \
--data-urlencode 'match[]={__name__="odf_system_objects_total", system_type="OCS", system_vendor="Red Hat"}' \
--data-urlencode 'match[]={__name__="noobaa_accounts_num"}' \
--data-urlencode 'match[]={__name__="noobaa_total_usage"}' \
--data-urlencode 'match[]={__name__="console_url"}' \
--data-urlencode 'match[]={__name__="cluster:ovnkube_master_egress_routing_via_host:max"}' \
--data-urlencode 'match[]={__name__="cluster:network_attachment_definition_instances:max"}' \
--data-urlencode 'match[]={__name__="cluster:network_attachment_definition_enabled_instance_up:max"}' \
--data-urlencode 'match[]={__name__="cluster:ingress_controller_aws_nlb_active:sum"}' \
--data-urlencode 'match[]={__name__="cluster:route_metrics_controller_routes_per_shard:min"}' \
--data-urlencode 'match[]={__name__="cluster:route_metrics_controller_routes_per_shard:max"}' \
--data-urlencode 'match[]={__name__="cluster:route_metrics_controller_routes_per_shard:avg"}' \
--data-urlencode 'match[]={__name__="cluster:route_metrics_controller_routes_per_shard:median"}' \
--data-urlencode 'match[]={__name__="cluster:openshift_route_info:tls_termination:sum"}' \
--data-urlencode 'match[]={__name__="insightsclient_request_send_total"}' \
--data-urlencode 'match[]={__name__="cam_app_workload_migrations"}' \
--data-urlencode 'match[]={__name__="cluster:apiserver_current_inflight_requests:sum:max_over_time:2m"}' \
--data-urlencode 'match[]={__name__="cluster:alertmanager_integrations:max"}' \
--data-urlencode 'match[]={__name__="cluster:telemetry_selected_series:count"}' \
--data-urlencode 'match[]={__name__="openshift:prometheus_tsdb_head_series:sum"}' \
--data-urlencode 'match[]={__name__="openshift:prometheus_tsdb_head_samples_appended_total:sum"}' \
--data-urlencode 'match[]={__name__="monitoring:container_memory_working_set_bytes:sum"}' \
--data-urlencode 'match[]={__name__="namespace_job:scrape_series_added:topk3_sum1h"}' \
--data-urlencode 'match[]={__name__="namespace_job:scrape_samples_post_metric_relabeling:topk3"}' \
--data-urlencode 'match[]={__name__="monitoring:haproxy_server_http_responses_total:sum"}' \
--data-urlencode 'match[]={__name__="rhmi_status"}' \
--data-urlencode 'match[]={__name__="status:upgrading:version:rhoam_state:max"}' \
--data-urlencode 'match[]={__name__="state:rhoam_critical_alerts:max"}' \
--data-urlencode 'match[]={__name__="state:rhoam_warning_alerts:max"}' \
--data-urlencode 'match[]={__name__="rhoam_7d_slo_percentile:max"}' \
--data-urlencode 'match[]={__name__="rhoam_7d_slo_remaining_error_budget:max"}' \
--data-urlencode 'match[]={__name__="cluster_legacy_scheduler_policy"}' \
--data-urlencode 'match[]={__name__="cluster_master_schedulable"}' \
--data-urlencode 'match[]={__name__="che_workspace_status"}' \
--data-urlencode 'match[]={__name__="che_workspace_started_total"}' \
--data-urlencode 'match[]={__name__="che_workspace_failure_total"}' \
--data-urlencode 'match[]={__name__="che_workspace_start_time_seconds_sum"}' \
--data-urlencode 'match[]={__name__="che_workspace_start_time_seconds_count"}' \
--data-urlencode 'match[]={__name__="cco_credentials_mode"}' \
--data-urlencode 'match[]={__name__="cluster:kube_persistentvolume_plugin_type_counts:sum"}' \
--data-urlencode 'match[]={__name__="visual_web_terminal_sessions_total"}' \
--data-urlencode 'match[]={__name__="acm_managed_cluster_info"}' \
--data-urlencode 'match[]={__name__="cluster:vsphere_vcenter_info:sum"}' \
--data-urlencode 'match[]={__name__="cluster:vsphere_esxi_version_total:sum"}' \
--data-urlencode 'match[]={__name__="cluster:vsphere_node_hw_version_total:sum"}' \
--data-urlencode 'match[]={__name__="openshift:build_by_strategy:sum"}' \
--data-urlencode 'match[]={__name__="rhods_aggregate_availability"}' \
--data-urlencode 'match[]={__name__="rhods_total_users"}' \
--data-urlencode 'match[]={__name__="instance:etcd_disk_wal_fsync_duration_seconds:histogram_quantile",quantile="0.99"}' \
--data-urlencode 'match[]={__name__="instance:etcd_mvcc_db_total_size_in_bytes:sum"}' \
--data-urlencode 'match[]={__name__="instance:etcd_network_peer_round_trip_time_seconds:histogram_quantile",quantile="0.99"}' \
--data-urlencode 'match[]={__name__="instance:etcd_mvcc_db_total_size_in_use_in_bytes:sum"}' \
--data-urlencode 'match[]={__name__="instance:etcd_disk_backend_commit_duration_seconds:histogram_quantile",quantile="0.99"}' \
--data-urlencode 'match[]={__name__="jaeger_operator_instances_storage_types"}' \
--data-urlencode 'match[]={__name__="jaeger_operator_instances_strategies"}' \
--data-urlencode 'match[]={__name__="jaeger_operator_instances_agent_strategies"}' \
--data-urlencode 'match[]={__name__="appsvcs:cores_by_product:sum"}' \
--data-urlencode 'match[]={__name__="nto_custom_profiles:count"}' \
--data-urlencode 'match[]={__name__="openshift_csi_share_configmap"}' \
--data-urlencode 'match[]={__name__="openshift_csi_share_secret"}' \
--data-urlencode 'match[]={__name__="openshift_csi_share_mount_failures_total"}' \
--data-urlencode 'match[]={__name__="openshift_csi_share_mount_requests_total"}' \
--data-urlencode 'match[]={__name__="cluster:velero_backup_total:max"}' \
--data-urlencode 'match[]={__name__="cluster:velero_restore_total:max"}' \
--data-urlencode 'match[]={__name__="eo_es_storage_info"}' \
--data-urlencode 'match[]={__name__="eo_es_redundancy_policy_info"}' \
--data-urlencode 'match[]={__name__="eo_es_defined_delete_namespaces_total"}' \
--data-urlencode 'match[]={__name__="eo_es_misconfigured_memory_resources_info"}' \
--data-urlencode 'match[]={__name__="cluster:eo_es_data_nodes_total:max"}' \
--data-urlencode 'match[]={__name__="cluster:eo_es_documents_created_total:sum"}' \
--data-urlencode 'match[]={__name__="cluster:eo_es_documents_deleted_total:sum"}' \
--data-urlencode 'match[]={__name__="pod:eo_es_shards_total:max"}' \
--data-urlencode 'match[]={__name__="eo_es_cluster_management_state_info"}' \
--data-urlencode 'match[]={__name__="imageregistry:imagestreamtags_count:sum"}' \
--data-urlencode 'match[]={__name__="imageregistry:operations_count:sum"}' \
--data-urlencode 'match[]={__name__="log_logging_info"}' \
--data-urlencode 'match[]={__name__="log_collector_error_count_total"}' \
--data-urlencode 'match[]={__name__="log_forwarder_pipeline_info"}' \
--data-urlencode 'match[]={__name__="log_forwarder_input_info"}' \
--data-urlencode 'match[]={__name__="log_forwarder_output_info"}' \
--data-urlencode 'match[]={__name__="cluster:log_collected_bytes_total:sum"}' \
--data-urlencode 'match[]={__name__="cluster:log_logged_bytes_total:sum"}' \
--data-urlencode 'match[]={__name__="cluster:kata_monitor_running_shim_count:sum"}' \
--data-urlencode 'match[]={__name__="platform:hypershift_hostedclusters:max"}' \
--data-urlencode 'match[]={__name__="platform:hypershift_nodepools:max"}' \
--data-urlencode 'match[]={__name__="namespace:noobaa_unhealthy_bucket_claims:max"}' \
--data-urlencode 'match[]={__name__="namespace:noobaa_buckets_claims:max"}' \
--data-urlencode 'match[]={__name__="namespace:noobaa_unhealthy_namespace_resources:max"}' \
--data-urlencode 'match[]={__name__="namespace:noobaa_namespace_resources:max"}' \
--data-urlencode 'match[]={__name__="namespace:noobaa_unhealthy_namespace_buckets:max"}' \
--data-urlencode 'match[]={__name__="namespace:noobaa_namespace_buckets:max"}' \
--data-urlencode 'match[]={__name__="namespace:noobaa_accounts:max"}' \
--data-urlencode 'match[]={__name__="namespace:noobaa_usage:max"}' \
--data-urlencode 'match[]={__name__="namespace:noobaa_system_health_status:max"}' \
--data-urlencode 'match[]={__name__="ocs_advanced_feature_usage"}' \
--data-urlencode 'match[]={__name__="os_image_url_override:sum"}'
4.3. Using Insights to identify issues with your cluster
Insights repeatedly analyzes the data Insights Operator sends. Users of OpenShift Dedicated can display the report in the Insights Advisor service on Red Hat Hybrid Cloud Console.
4.3.1. About Red Hat Insights Advisor for OpenShift Dedicated
You can use Insights Advisor to assess and monitor the health of your OpenShift Dedicated clusters. Whether you are concerned about individual clusters, or with your whole infrastructure, it is important to be aware of the exposure of your cluster infrastructure to issues that can affect service availability, fault tolerance, performance, or security.
Using cluster data collected by the Insights Operator, Insights repeatedly compares that data against a library of recommendations. Each recommendation is a set of cluster-environment conditions that can leave OpenShift Dedicated clusters at risk. The results of the Insights analysis are available in the Insights Advisor service on Red Hat Hybrid Cloud Console. In the Console, you can perform the following actions:
- See clusters impacted by a specific recommendation.
- Use robust filtering capabilities to refine your results to those recommendations.
- Learn more about individual recommendations, details about the risks they present, and get resolutions tailored to your individual clusters.
- Share results with other stakeholders.
4.3.2. Understanding Insights Advisor recommendations
Insights Advisor bundles information about various cluster states and component configurations that can negatively affect the service availability, fault tolerance, performance, or security of your clusters. This information set is called a recommendation in Insights Advisor and includes the following information:
- Name: A concise description of the recommendation
- Added: When the recommendation was published to the Insights Advisor archive
- Category: Whether the issue has the potential to negatively affect service availability, fault tolerance, performance, or security
- Total risk: A value derived from the likelihood that the condition will negatively affect your infrastructure, and the impact on operations if that were to happen
- Clusters: A list of clusters on which a recommendation is detected
- Description: A brief synopsis of the issue, including how it affects your clusters
- Link to associated topics: More information from Red Hat about the issue
4.3.3. Displaying potential issues with your cluster
This section describes how to display the Insights report in Insights Advisor on OpenShift Cluster Manager.
Note that Insights repeatedly analyzes your cluster and shows the latest results. These results can change, for example, if you fix an issue or a new issue has been detected.
Prerequisites
- Your cluster is registered on OpenShift Cluster Manager.
- Remote health reporting is enabled, which is the default.
- You are logged in to OpenShift Cluster Manager.
Procedure
Navigate to Advisor → Recommendations on OpenShift Cluster Manager.
Depending on the result, Insights Advisor displays one of the following:
- No matching recommendations found, if Insights did not identify any issues.
- A list of issues Insights has detected, grouped by risk (low, moderate, important, and critical).
- No clusters yet, if Insights has not yet analyzed the cluster. The analysis starts shortly after the cluster has been installed, registered, and connected to the internet.
If any issues are displayed, click the > icon in front of the entry for more details.
Depending on the issue, the details can also contain a link to more information from Red Hat about the issue.
4.3.4. Displaying all Insights Advisor recommendations
The Recommendations view, by default, only displays the recommendations that are detected on your clusters. However, you can view all of the recommendations in the advisor archive.
Prerequisites
- Remote health reporting is enabled, which is the default.
- Your cluster is registered on Red Hat Hybrid Cloud Console.
- You are logged in to OpenShift Cluster Manager.
Procedure
- Navigate to Advisor → Recommendations on OpenShift Cluster Manager.
Click the X icons next to the Clusters Impacted and Status filters.
You can now browse through all of the potential recommendations for your cluster.
4.3.5. Advisor recommendation filters
The Insights advisor service can return a large number of recommendations. To focus on your most critical recommendations, you can apply filters to the Advisor recommendations list to remove low-priority recommendations.
By default, filters are set to only show enabled recommendations that are impacting one or more clusters. To view all or disabled recommendations in the Insights library, you can customize the filters.
To apply a filter, select a filter type and then set its value based on the options that are available in the drop-down list. You can apply multiple filters to the list of recommendations.
You can set the following filter types:
- Name: Search for a recommendation by name.
- Total risk: Select one or more values from Critical, Important, Moderate, and Low indicating the likelihood and the severity of a negative impact on a cluster.
- Impact: Select one or more values from Critical, High, Medium, and Low indicating the potential impact to the continuity of cluster operations.
- Likelihood: Select one or more values from Critical, High, Medium, and Low indicating the potential for a negative impact to a cluster if the recommendation comes to fruition.
- Category: Select one or more categories from Service Availability, Performance, Fault Tolerance, Security, and Best Practice to focus your attention on.
- Status: Click a radio button to show enabled recommendations (default), disabled recommendations, or all recommendations.
- Clusters impacted: Set the filter to show recommendations currently impacting one or more clusters, non-impacting recommendations, or all recommendations.
- Risk of change: Select one or more values from High, Moderate, Low, and Very low indicating the risk that the implementation of the resolution could have on cluster operations.
4.3.5.1. Filtering Insights advisor recommendations
As an OpenShift Dedicated cluster manager, you can filter the recommendations that are displayed on the recommendations list. By applying filters, you can reduce the number of reported recommendations and concentrate on your highest priority recommendations.
The following procedure demonstrates how to set and remove Category filters; however, the procedure is applicable to any of the filter types and respective values.
Prerequisites
You are logged in to the OpenShift Cluster Manager Hybrid Cloud Console.
Procedure
- Go to Red Hat Hybrid Cloud Console → OpenShift → Advisor recommendations.
- In the main, filter-type drop-down list, select the Category filter type.
- Expand the filter-value drop-down list and select the checkbox next to each category of recommendation you want to view. Leave the checkboxes for unnecessary categories clear.
- Optional: Add additional filters to further refine the list.
Only recommendations from the selected categories are shown in the list.
Verification
- After applying filters, you can view the updated recommendations list. The applied filters are added next to the default filters.
4.3.5.2. Removing filters from Insights Advisor recommendations
You can apply multiple filters to the list of recommendations. When ready, you can remove them individually or completely reset them.
Removing filters individually
- Click the X icon next to each filter, including the default filters, to remove them individually.
Removing all non-default filters
- Click Reset filters to remove only the filters that you applied, leaving the default filters in place.
4.3.6. Disabling Insights Advisor recommendations
You can disable specific recommendations that affect your clusters, so that they no longer appear in your reports. It is possible to disable a recommendation for a single cluster or all of your clusters.
Disabling a recommendation for all of your clusters also applies to any future clusters.
Prerequisites
- Remote health reporting is enabled, which is the default.
- Your cluster is registered on OpenShift Cluster Manager.
- You are logged in to OpenShift Cluster Manager.
Procedure
- Navigate to Advisor → Recommendations on OpenShift Cluster Manager.
- Optional: Use the Clusters Impacted and Status filters as needed.
Disable an alert by using one of the following methods:
To disable an alert:
-
Click the Options menu
 for that alert, and then click Disable recommendation.
- Enter a justification note and click Save.
-
Click the Options menu
To view the clusters affected by this alert before disabling the alert:
- Click the name of the recommendation to disable. You are directed to the single recommendation page.
- Review the list of clusters in the Affected clusters section.
- Click Actions → Disable recommendation to disable the alert for all of your clusters.
- Enter a justification note and click Save.
4.3.7. Enabling a previously disabled Insights Advisor recommendation
When a recommendation is disabled for all clusters, you no longer see the recommendation in the Insights Advisor. You can change this behavior.
Prerequisites
- Remote health reporting is enabled, which is the default.
- Your cluster is registered on OpenShift Cluster Manager.
- You are logged in to OpenShift Cluster Manager.
Procedure
- Navigate to Advisor → Recommendations on OpenShift Cluster Manager.
Filter the recommendations to display on the disabled recommendations:
- From the Status drop-down menu, select Status.
- From the Filter by status drop-down menu, select Disabled.
- Optional: Clear the Clusters impacted filter.
- Locate the recommendation to enable.
-
Click the Options menu
, and then click Enable recommendation.
4.3.8. Displaying the Insights status in the web console
Insights repeatedly analyzes your cluster and you can display the status of identified potential issues of your cluster in the OpenShift Dedicated web console. This status shows the number of issues in the different categories and, for further details, links to the reports in OpenShift Cluster Manager.
Prerequisites
- Your cluster is registered in OpenShift Cluster Manager.
- Remote health reporting is enabled, which is the default.
- You are logged in to the OpenShift Dedicated web console.
Procedure
- Navigate to Home → Overview in the OpenShift Dedicated web console.
Click Insights on the Status card.
The pop-up window lists potential issues grouped by risk. Click the individual categories or View all recommendations in Insights Advisor to display more details.
4.4. Using the Insights Operator
The Insights Operator periodically gathers configuration and component failure status and, by default, reports that data every two hours to Red Hat. This information enables Red Hat to assess configuration and deeper failure data than is reported through Telemetry. Users of OpenShift Dedicated can display the report in the Insights Advisor service on Red Hat Hybrid Cloud Console.
Additional resources
- For more information on using Insights Advisor to identify issues with your cluster, see Using Insights to identify issues with your cluster.
4.4.1. Understanding Insights Operator alerts
The Insights Operator declares alerts through the Prometheus monitoring system to the Alertmanager. You can view these alerts in the Alerting UI in the OpenShift Dedicated web console by using one of the following methods:
- In the Administrator perspective, click Observe → Alerting.
- In the Developer perspective, click Observe → <project_name> → Alerts tab.
Currently, Insights Operator sends the following alerts when the conditions are met:
Table 4.1. Insights Operator alerts
| Alert | Description |
|---|---|
|
| Insights Operator is disabled. |
|
| Simple content access is not enabled in Red Hat Subscription Management. |
|
| Insights has an active recommendation for the cluster. |
4.4.2. Obfuscating Deployment Validation Operator data
Cluster administrators can configure the Insight Operator to obfuscate data from the Deployment Validation Operator (DVO), if the Operator is installed. When the workload_names value is added to the insights-config ConfigMap object, workload names—rather than UIDs—are displayed in Insights for Openshift, making them more recognizable for cluster administrators.
Prerequisites
- Remote health reporting is enabled, which is the default.
- You are logged in to the OpenShift Dedicated web console with the "cluster-admin" role.
-
The insights-config
ConfigMapobject exists in theopenshift-insightsnamespace. - The cluster is self managed and the Deployment Validation Operator is installed.
Procedure
- Go to Workloads → ConfigMaps and select Project: openshift-insights.
-
Click on the insights-config
ConfigMapobject to open it. - Click Actions and select Edit ConfigMap.
- Click the YAML view radio button.
In the file, set the
obfuscationattribute with theworkload_namesvalue.apiVersion: v1 kind: ConfigMap # ... data: config.yaml: | dataReporting: obfuscation: - workload_names # ...- Click Save. The insights-config config-map details page opens.
-
Verify that the value of the
config.yamlobfuscationattribute is set to- workload_names.