
Support
OpenShift Dedicated Support.
Abstract
Chapter 1. Support overview
Red Hat offers cluster administrators tools for gathering data for your cluster, monitoring, and troubleshooting.
1.1. Get support
Get support: Visit the Red Hat Customer Portal to review knowledge base articles, submit a support case, and review additional product documentation and resources.
1.2. Remote health monitoring issues
Remote health monitoring issues: OpenShift Dedicated collects telemetry and configuration data about your cluster and reports it to Red Hat by using the Telemeter Client and the Insights Operator. Red Hat uses this data to understand and resolve issues in connected cluster. OpenShift Dedicated collects data and monitors health using the following:
Telemetry: The Telemetry Client gathers and uploads the metrics values to Red Hat every four minutes and thirty seconds. Red Hat uses this data to:
- Monitor the clusters.
- Roll out OpenShift Dedicated upgrades.
- Improve the upgrade experience.
Insight Operator: By default, OpenShift Dedicated installs and enables the Insight Operator, which reports configuration and component failure status every two hours. The Insight Operator helps to:
- Identify potential cluster issues proactively.
- Provide a solution and preventive action in Red Hat OpenShift Cluster Manager.
You can review telemetry information.
If you have enabled remote health reporting, Use Insights to identify issues. You can optionally disable remote health reporting.
1.3. Troubleshooting issues
A cluster administrator can monitor and troubleshoot the following OpenShift Dedicated component issues:
Node issues: A cluster administrator can verify and troubleshoot node-related issues by reviewing the status, resource usage, and configuration of a node. You can query the following:
- Kubelet’s status on a node.
- Cluster node journal logs.
Operator issues: A cluster administrator can do the following to resolve Operator issues:
- Verify Operator subscription status.
- Check Operator pod health.
- Gather Operator logs.
Pod issues: A cluster administrator can troubleshoot pod-related issues by reviewing the status of a pod and completing the following:
- Review pod and container logs.
- Start debug pods with root access.
Storage issues: A multi-attach storage error occurs when the mounting volume on a new node is not possible because the failed node cannot unmount the attached volume. A cluster administrator can do the following to resolve multi-attach storage issues:
- Enable multiple attachments by using RWX volumes.
- Recover or delete the failed node when using an RWO volume.
Monitoring issues: A cluster administrator can follow the procedures on the troubleshooting page for monitoring. If the metrics for your user-defined projects are unavailable or if Prometheus is consuming a lot of disk space, check the following:
- Investigate why user-defined metrics are unavailable.
- Determine why Prometheus is consuming a lot of disk space.
Logging issues: A cluster administrator can follow the procedures in the "Support" and "Troubleshooting logging" sections to resolve logging issues:
-
OpenShift CLI (
oc) issues: Investigate OpenShift CLI (oc) issues by increasing the log level.
Chapter 2. Managing your cluster resources
You can apply global configuration options in OpenShift Dedicated. Operators apply these configuration settings across the cluster.
2.1. Interacting with your cluster resources
You can interact with cluster resources by using the OpenShift CLI (oc) tool in OpenShift Dedicated. The cluster resources that you see after running the oc api-resources command can be edited.
Prerequisites
-
You have access to the cluster as a user with the
dedicated-adminrole. -
You have access to the web console or you have installed the
ocCLI tool.
Procedure
To see which configuration Operators have been applied, run the following command:
$ oc api-resources -o name | grep config.openshift.io
To see what cluster resources you can configure, run the following command:
$ oc explain <resource_name>.config.openshift.io
To see the configuration of custom resource definition (CRD) objects in the cluster, run the following command:
$ oc get <resource_name>.config -o yaml
To edit the cluster resource configuration, run the following command:
$ oc edit <resource_name>.config -o yaml
Chapter 3. Getting support
3.1. Getting support
If you experience difficulty with a procedure described in this documentation, or with OpenShift Dedicated in general, visit the Red Hat Customer Portal.
From the Customer Portal, you can:
- Search or browse through the Red Hat Knowledgebase of articles and solutions relating to Red Hat products.
- Submit a support case to Red Hat Support.
- Access other product documentation.
To identify issues with your cluster, you can use Insights in OpenShift Cluster Manager. Insights provides details about issues and, if available, information on how to solve a problem.
If you have a suggestion for improving this documentation or have found an error, submit a Jira issue for the most relevant documentation component. Please provide specific details, such as the section name and OpenShift Dedicated version.
3.2. About the Red Hat Knowledgebase
The Red Hat Knowledgebase provides rich content aimed at helping you make the most of Red Hat’s products and technologies. The Red Hat Knowledgebase consists of articles, product documentation, and videos outlining best practices on installing, configuring, and using Red Hat products. In addition, you can search for solutions to known issues, each providing concise root cause descriptions and remedial steps.
3.3. Searching the Red Hat Knowledgebase
In the event of an OpenShift Dedicated issue, you can perform an initial search to determine if a solution already exists within the Red Hat Knowledgebase.
Prerequisites
- You have a Red Hat Customer Portal account.
Procedure
- Log in to the Red Hat Customer Portal.
- Click Search.
In the search field, input keywords and strings relating to the problem, including:
- OpenShift Dedicated components (such as etcd)
- Related procedure (such as installation)
- Warnings, error messages, and other outputs related to explicit failures
- Click the Enter key.
- Optional: Select the OpenShift Dedicated product filter.
- Optional: Select the Documentation content type filter.
3.4. Submitting a support case
Prerequisites
-
You have access to the cluster as a user with the
dedicated-adminrole. -
You have installed the OpenShift CLI (
oc). - You have access to the Red Hat OpenShift Cluster Manager.
- You have a Red Hat Customer Portal account.
Procedure
- Log in to the Customer Support page of the Red Hat Customer Portal.
- Click Get support.
On the Cases tab of the Customer Support page:
- Optional: Change the pre-filled account and owner details if needed.
- Select the appropriate category for your issue, such as Bug or Defect, and click Continue.
Enter the following information:
- In the Summary field, enter a concise but descriptive problem summary and further details about the symptoms being experienced, as well as your expectations.
- Select OpenShift Dedicated from the Product drop-down menu.
- Review the list of suggested Red Hat Knowledgebase solutions for a potential match against the problem that is being reported. If the suggested articles do not address the issue, click Continue.
- Review the updated list of suggested Red Hat Knowledgebase solutions for a potential match against the problem that is being reported. The list is refined as you provide more information during the case creation process. If the suggested articles do not address the issue, click Continue.
- Ensure that the account information presented is as expected, and if not, amend accordingly.
Check that the autofilled OpenShift Dedicated Cluster ID is correct. If it is not, manually obtain your cluster ID.
To manually obtain your cluster ID using OpenShift Cluster Manager:
- Navigate to Clusters.
- Click on the name of the cluster you need to open a support case for.
- Find the value in the Cluster ID field of the Details section of the Overview tab.
Complete the following questions where prompted and then click Continue:
- What are you experiencing? What are you expecting to happen?
- Define the value or impact to you or the business.
- Where are you experiencing this behavior? What environment?
- When does this behavior occur? Frequency? Repeatedly? At certain times?
- Upload relevant diagnostic data files and click Continue.
- Input relevant case management details and click Continue.
- Preview the case details and click Submit.
3.5. Additional resources
- For details about identifying issues with your cluster, see Using Insights to identify issues with your cluster.
Chapter 4. Remote health monitoring with connected clusters
4.1. About remote health monitoring
OpenShift Dedicated collects telemetry and configuration data about your cluster and reports it to Red Hat by using the Telemeter Client and the Insights Operator. The data that is provided to Red Hat enables the benefits outlined in this document.
A cluster that reports data to Red Hat through Telemetry and the Insights Operator is considered a connected cluster.
Telemetry is the term that Red Hat uses to describe the information being sent to Red Hat by the OpenShift Dedicated Telemeter Client. Lightweight attributes are sent from connected clusters to Red Hat to enable subscription management automation, monitor the health of clusters, assist with support, and improve customer experience.
The Insights Operator gathers OpenShift Dedicated configuration data and sends it to Red Hat. The data is used to produce insights about potential issues that a cluster might be exposed to. These insights are communicated to cluster administrators on OpenShift Cluster Manager.
More information is provided in this document about these two processes.
Telemetry and Insights Operator benefits
Telemetry and the Insights Operator enable the following benefits for end-users:
- Enhanced identification and resolution of issues. Events that might seem normal to an end-user can be observed by Red Hat from a broader perspective across a fleet of clusters. Some issues can be more rapidly identified from this point of view and resolved without an end-user needing to open a support case or file a Jira issue.
-
Advanced release management. OpenShift Dedicated offers the
candidate,fast, andstablerelease channels, which enable you to choose an update strategy. The graduation of a release fromfasttostableis dependent on the success rate of updates and on the events seen during upgrades. With the information provided by connected clusters, Red Hat can improve the quality of releases tostablechannels and react more rapidly to issues found in thefastchannels. - Targeted prioritization of new features and functionality. The data collected provides insights about which areas of OpenShift Dedicated are used most. With this information, Red Hat can focus on developing the new features and functionality that have the greatest impact for our customers.
- A streamlined support experience. You can provide a cluster ID for a connected cluster when creating a support ticket on the Red Hat Customer Portal. This enables Red Hat to deliver a streamlined support experience that is specific to your cluster, by using the connected information. This document provides more information about that enhanced support experience.
- Predictive analytics. The insights displayed for your cluster on OpenShift Cluster Manager are enabled by the information collected from connected clusters. Red Hat is investing in applying deep learning, machine learning, and artificial intelligence automation to help identify issues that OpenShift Dedicated clusters are exposed to.
On OpenShift Dedicated, remote health reporting is always enabled. You cannot opt out of it.
4.1.1. About Telemetry
Telemetry sends a carefully chosen subset of the cluster monitoring metrics to Red Hat. The Telemeter Client fetches the metrics values every four minutes and thirty seconds and uploads the data to Red Hat. These metrics are described in this document.
This stream of data is used by Red Hat to monitor the clusters in real-time and to react as necessary to problems that impact our customers. It also allows Red Hat to roll out OpenShift Dedicated upgrades to customers to minimize service impact and continuously improve the upgrade experience.
This debugging information is available to Red Hat Support and Engineering teams with the same restrictions as accessing data reported through support cases. All connected cluster information is used by Red Hat to help make OpenShift Dedicated better and more intuitive to use.
4.1.1.1. Information collected by Telemetry
The following information is collected by Telemetry:
4.1.1.1.1. System information
- Version information, including the OpenShift Dedicated cluster version and installed update details that are used to determine update version availability
- Update information, including the number of updates available per cluster, the channel and image repository used for an update, update progress information, and the number of errors that occur in an update
- The unique random identifier that is generated during an installation
- Configuration details that help Red Hat Support to provide beneficial support for customers, including node configuration at the cloud infrastructure level, hostnames, IP addresses, Kubernetes pod names, namespaces, and services
- The OpenShift Dedicated framework components installed in a cluster and their condition and status
- Events for all namespaces listed as "related objects" for a degraded Operator
- Information about degraded software
- Information about the validity of certificates
- The name of the provider platform that OpenShift Dedicated is deployed on and the data center location
4.1.1.1.2. Sizing Information
- Sizing information about clusters, machine types, and machines, including the number of CPU cores and the amount of RAM used for each
- The number of etcd members and the number of objects stored in the etcd cluster
4.1.1.1.3. Usage information
- Usage information about components, features, and extensions
- Usage details about Technology Previews and unsupported configurations
Telemetry does not collect identifying information such as usernames or passwords. Red Hat does not intend to collect personal information. If Red Hat discovers that personal information has been inadvertently received, Red Hat will delete such information. To the extent that any telemetry data constitutes personal data, please refer to the Red Hat Privacy Statement for more information about Red Hat’s privacy practices.
4.1.1.2. User Telemetry
Red Hat collects anonymized user data from your browser. This anonymized data includes what pages, features, and resource types that the user of all clusters with enabled telemetry uses.
Other considerations:
- User events are grouped as a SHA-1 hash.
-
User’s IP address is saved as
0.0.0.0. - User names and IP addresses are never saved as separate values.
Additional resources
- See Showing data collected by Telemetry for details about how to list the attributes that Telemetry gathers from Prometheus in OpenShift Dedicated.
- See the upstream cluster-monitoring-operator source code for a list of the attributes that Telemetry gathers from Prometheus.
4.1.2. About the Insights Operator
The Insights Operator periodically gathers configuration and component failure status and, by default, reports that data every two hours to Red Hat. This information enables Red Hat to assess configuration and deeper failure data than is reported through Telemetry.
Users of OpenShift Dedicated can display the report of each cluster in the Insights Advisor service on Red Hat Hybrid Cloud Console. If any issues have been identified, Insights provides further details and, if available, steps on how to solve a problem.
The Insights Operator does not collect identifying information, such as user names, passwords, or certificates. See Red Hat Insights Data & Application Security for information about Red Hat Insights data collection and controls.
Red Hat uses all connected cluster information to:
- Identify potential cluster issues and provide a solution and preventive actions in the Insights Advisor service on Red Hat Hybrid Cloud Console
- Improve OpenShift Dedicated by providing aggregated and critical information to product and support teams
- Make OpenShift Dedicated more intuitive
4.1.2.1. Information collected by the Insights Operator
The following information is collected by the Insights Operator:
- General information about your cluster and its components to identify issues that are specific to your OpenShift Dedicated version and environment
- Configuration files, such as the image registry configuration, of your cluster to determine incorrect settings and issues that are specific to parameters you set
- Errors that occur in the cluster components
- Progress information of running updates, and the status of any component upgrades
- Details of the platform that OpenShift Dedicated is deployed on, such as Amazon Web Services, and the region that the cluster is located in
-
If an Operator reports an issue, information is collected about core OpenShift Dedicated pods in the
openshift-*andkube-*projects. This includes state, resource, security context, volume information, and more.
Additional resources
- The Insights Operator source code is available for review and contribution. See the Insights Operator upstream project for a list of the items collected by the Insights Operator.
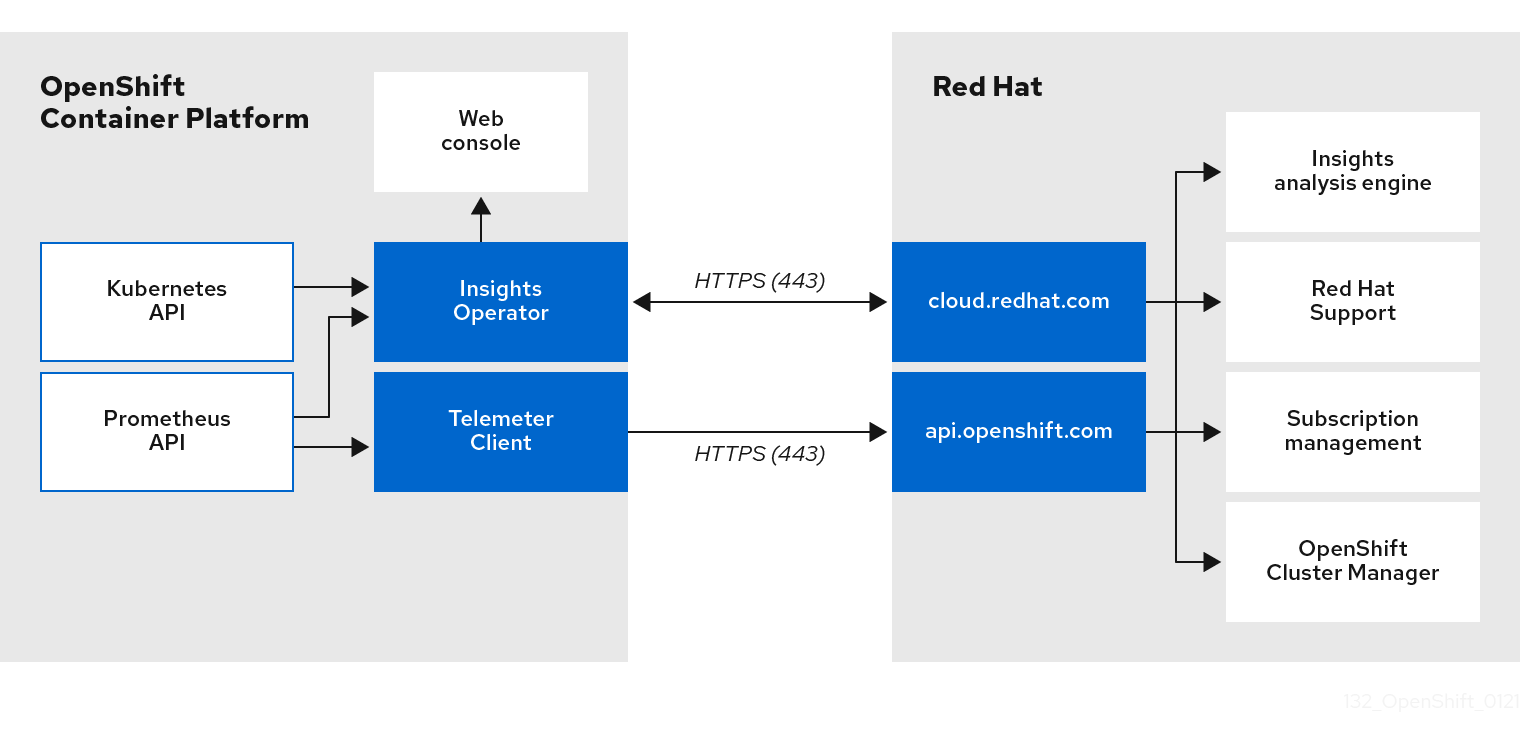
4.1.3. Understanding Telemetry and Insights Operator data flow
The Telemeter Client collects selected time series data from the Prometheus API. The time series data is uploaded to api.openshift.com every four minutes and thirty seconds for processing.
The Insights Operator gathers selected data from the Kubernetes API and the Prometheus API into an archive. The archive is uploaded to OpenShift Cluster Manager every two hours for processing. The Insights Operator also downloads the latest Insights analysis from OpenShift Cluster Manager. This is used to populate the Insights status pop-up that is included in the Overview page in the OpenShift Dedicated web console.
All of the communication with Red Hat occurs over encrypted channels by using Transport Layer Security (TLS) and mutual certificate authentication. All of the data is encrypted in transit and at rest.
Access to the systems that handle customer data is controlled through multi-factor authentication and strict authorization controls. Access is granted on a need-to-know basis and is limited to required operations.
Telemetry and Insights Operator data flow
Additional resources
- See Monitoring overview for more information about the OpenShift Dedicated monitoring stack.
4.1.4. Additional details about how remote health monitoring data is used
The information collected to enable remote health monitoring is detailed in Information collected by Telemetry and Information collected by the Insights Operator.
As further described in the preceding sections of this document, Red Hat collects data about your use of the Red Hat Product(s) for purposes such as providing support and upgrades, optimizing performance or configuration, minimizing service impacts, identifying and remediating threats, troubleshooting, improving the offerings and user experience, responding to issues, and for billing purposes if applicable.
Collection safeguards
Red Hat employs technical and organizational measures designed to protect the telemetry and configuration data.
Sharing
Red Hat may share the data collected through Telemetry and the Insights Operator internally within Red Hat to improve your user experience. Red Hat may share telemetry and configuration data with its business partners in an aggregated form that does not identify customers to help the partners better understand their markets and their customers’ use of Red Hat offerings or to ensure the successful integration of products jointly supported by those partners.
Third parties
Red Hat may engage certain third parties to assist in the collection, analysis, and storage of the Telemetry and configuration data.
4.2. Showing data collected by remote health monitoring
User control / enabling and disabling telemetry and configuration data collection
As an administrator, you can review the metrics collected by Telemetry and the Insights Operator.
4.2.1. Showing data collected by Telemetry
You can view the cluster and components time series data captured by Telemetry.
Prerequisites
-
You have installed the OpenShift Container Platform CLI (
oc). -
You have access to the cluster as a user with the
dedicated-adminrole.
Procedure
- Log in to a cluster.
Run the following command, which queries a cluster’s Prometheus service and returns the full set of time series data captured by Telemetry:
$ curl -G -k -H "Authorization: Bearer $(oc whoami -t)" \
https://$(oc get route prometheus-k8s-federate -n \
openshift-monitoring -o jsonpath="{.spec.host}")/federate \
--data-urlencode 'match[]={__name__=~"cluster:usage:.*"}' \
--data-urlencode 'match[]={__name__="count:up0"}' \
--data-urlencode 'match[]={__name__="count:up1"}' \
--data-urlencode 'match[]={__name__="cluster_version"}' \
--data-urlencode 'match[]={__name__="cluster_version_available_updates"}' \
--data-urlencode 'match[]={__name__="cluster_version_capability"}' \
--data-urlencode 'match[]={__name__="cluster_operator_up"}' \
--data-urlencode 'match[]={__name__="cluster_operator_conditions"}' \
--data-urlencode 'match[]={__name__="cluster_version_payload"}' \
--data-urlencode 'match[]={__name__="cluster_installer"}' \
--data-urlencode 'match[]={__name__="cluster_infrastructure_provider"}' \
--data-urlencode 'match[]={__name__="cluster_feature_set"}' \
--data-urlencode 'match[]={__name__="instance:etcd_object_counts:sum"}' \
--data-urlencode 'match[]={__name__="ALERTS",alertstate="firing"}' \
--data-urlencode 'match[]={__name__="code:apiserver_request_total:rate:sum"}' \
--data-urlencode 'match[]={__name__="cluster:capacity_cpu_cores:sum"}' \
--data-urlencode 'match[]={__name__="cluster:capacity_memory_bytes:sum"}' \
--data-urlencode 'match[]={__name__="cluster:cpu_usage_cores:sum"}' \
--data-urlencode 'match[]={__name__="cluster:memory_usage_bytes:sum"}' \
--data-urlencode 'match[]={__name__="openshift:cpu_usage_cores:sum"}' \
--data-urlencode 'match[]={__name__="openshift:memory_usage_bytes:sum"}' \
--data-urlencode 'match[]={__name__="workload:cpu_usage_cores:sum"}' \
--data-urlencode 'match[]={__name__="workload:memory_usage_bytes:sum"}' \
--data-urlencode 'match[]={__name__="cluster:virt_platform_nodes:sum"}' \
--data-urlencode 'match[]={__name__="cluster:node_instance_type_count:sum"}' \
--data-urlencode 'match[]={__name__="cnv:vmi_status_running:count"}' \
--data-urlencode 'match[]={__name__="cluster:vmi_request_cpu_cores:sum"}' \
--data-urlencode 'match[]={__name__="node_role_os_version_machine:cpu_capacity_cores:sum"}' \
--data-urlencode 'match[]={__name__="node_role_os_version_machine:cpu_capacity_sockets:sum"}' \
--data-urlencode 'match[]={__name__="subscription_sync_total"}' \
--data-urlencode 'match[]={__name__="olm_resolution_duration_seconds"}' \
--data-urlencode 'match[]={__name__="csv_succeeded"}' \
--data-urlencode 'match[]={__name__="csv_abnormal"}' \
--data-urlencode 'match[]={__name__="cluster:kube_persistentvolumeclaim_resource_requests_storage_bytes:provisioner:sum"}' \
--data-urlencode 'match[]={__name__="cluster:kubelet_volume_stats_used_bytes:provisioner:sum"}' \
--data-urlencode 'match[]={__name__="ceph_cluster_total_bytes"}' \
--data-urlencode 'match[]={__name__="ceph_cluster_total_used_raw_bytes"}' \
--data-urlencode 'match[]={__name__="ceph_health_status"}' \
--data-urlencode 'match[]={__name__="odf_system_raw_capacity_total_bytes"}' \
--data-urlencode 'match[]={__name__="odf_system_raw_capacity_used_bytes"}' \
--data-urlencode 'match[]={__name__="odf_system_health_status"}' \
--data-urlencode 'match[]={__name__="job:ceph_osd_metadata:count"}' \
--data-urlencode 'match[]={__name__="job:kube_pv:count"}' \
--data-urlencode 'match[]={__name__="job:odf_system_pvs:count"}' \
--data-urlencode 'match[]={__name__="job:ceph_pools_iops:total"}' \
--data-urlencode 'match[]={__name__="job:ceph_pools_iops_bytes:total"}' \
--data-urlencode 'match[]={__name__="job:ceph_versions_running:count"}' \
--data-urlencode 'match[]={__name__="job:noobaa_total_unhealthy_buckets:sum"}' \
--data-urlencode 'match[]={__name__="job:noobaa_bucket_count:sum"}' \
--data-urlencode 'match[]={__name__="job:noobaa_total_object_count:sum"}' \
--data-urlencode 'match[]={__name__="odf_system_bucket_count", system_type="OCS", system_vendor="Red Hat"}' \
--data-urlencode 'match[]={__name__="odf_system_objects_total", system_type="OCS", system_vendor="Red Hat"}' \
--data-urlencode 'match[]={__name__="noobaa_accounts_num"}' \
--data-urlencode 'match[]={__name__="noobaa_total_usage"}' \
--data-urlencode 'match[]={__name__="console_url"}' \
--data-urlencode 'match[]={__name__="cluster:ovnkube_master_egress_routing_via_host:max"}' \
--data-urlencode 'match[]={__name__="cluster:network_attachment_definition_instances:max"}' \
--data-urlencode 'match[]={__name__="cluster:network_attachment_definition_enabled_instance_up:max"}' \
--data-urlencode 'match[]={__name__="cluster:ingress_controller_aws_nlb_active:sum"}' \
--data-urlencode 'match[]={__name__="cluster:route_metrics_controller_routes_per_shard:min"}' \
--data-urlencode 'match[]={__name__="cluster:route_metrics_controller_routes_per_shard:max"}' \
--data-urlencode 'match[]={__name__="cluster:route_metrics_controller_routes_per_shard:avg"}' \
--data-urlencode 'match[]={__name__="cluster:route_metrics_controller_routes_per_shard:median"}' \
--data-urlencode 'match[]={__name__="cluster:openshift_route_info:tls_termination:sum"}' \
--data-urlencode 'match[]={__name__="insightsclient_request_send_total"}' \
--data-urlencode 'match[]={__name__="cam_app_workload_migrations"}' \
--data-urlencode 'match[]={__name__="cluster:apiserver_current_inflight_requests:sum:max_over_time:2m"}' \
--data-urlencode 'match[]={__name__="cluster:alertmanager_integrations:max"}' \
--data-urlencode 'match[]={__name__="cluster:telemetry_selected_series:count"}' \
--data-urlencode 'match[]={__name__="openshift:prometheus_tsdb_head_series:sum"}' \
--data-urlencode 'match[]={__name__="openshift:prometheus_tsdb_head_samples_appended_total:sum"}' \
--data-urlencode 'match[]={__name__="monitoring:container_memory_working_set_bytes:sum"}' \
--data-urlencode 'match[]={__name__="namespace_job:scrape_series_added:topk3_sum1h"}' \
--data-urlencode 'match[]={__name__="namespace_job:scrape_samples_post_metric_relabeling:topk3"}' \
--data-urlencode 'match[]={__name__="monitoring:haproxy_server_http_responses_total:sum"}' \
--data-urlencode 'match[]={__name__="rhmi_status"}' \
--data-urlencode 'match[]={__name__="status:upgrading:version:rhoam_state:max"}' \
--data-urlencode 'match[]={__name__="state:rhoam_critical_alerts:max"}' \
--data-urlencode 'match[]={__name__="state:rhoam_warning_alerts:max"}' \
--data-urlencode 'match[]={__name__="rhoam_7d_slo_percentile:max"}' \
--data-urlencode 'match[]={__name__="rhoam_7d_slo_remaining_error_budget:max"}' \
--data-urlencode 'match[]={__name__="cluster_legacy_scheduler_policy"}' \
--data-urlencode 'match[]={__name__="cluster_master_schedulable"}' \
--data-urlencode 'match[]={__name__="che_workspace_status"}' \
--data-urlencode 'match[]={__name__="che_workspace_started_total"}' \
--data-urlencode 'match[]={__name__="che_workspace_failure_total"}' \
--data-urlencode 'match[]={__name__="che_workspace_start_time_seconds_sum"}' \
--data-urlencode 'match[]={__name__="che_workspace_start_time_seconds_count"}' \
--data-urlencode 'match[]={__name__="cco_credentials_mode"}' \
--data-urlencode 'match[]={__name__="cluster:kube_persistentvolume_plugin_type_counts:sum"}' \
--data-urlencode 'match[]={__name__="visual_web_terminal_sessions_total"}' \
--data-urlencode 'match[]={__name__="acm_managed_cluster_info"}' \
--data-urlencode 'match[]={__name__="cluster:vsphere_vcenter_info:sum"}' \
--data-urlencode 'match[]={__name__="cluster:vsphere_esxi_version_total:sum"}' \
--data-urlencode 'match[]={__name__="cluster:vsphere_node_hw_version_total:sum"}' \
--data-urlencode 'match[]={__name__="openshift:build_by_strategy:sum"}' \
--data-urlencode 'match[]={__name__="rhods_aggregate_availability"}' \
--data-urlencode 'match[]={__name__="rhods_total_users"}' \
--data-urlencode 'match[]={__name__="instance:etcd_disk_wal_fsync_duration_seconds:histogram_quantile",quantile="0.99"}' \
--data-urlencode 'match[]={__name__="instance:etcd_mvcc_db_total_size_in_bytes:sum"}' \
--data-urlencode 'match[]={__name__="instance:etcd_network_peer_round_trip_time_seconds:histogram_quantile",quantile="0.99"}' \
--data-urlencode 'match[]={__name__="instance:etcd_mvcc_db_total_size_in_use_in_bytes:sum"}' \
--data-urlencode 'match[]={__name__="instance:etcd_disk_backend_commit_duration_seconds:histogram_quantile",quantile="0.99"}' \
--data-urlencode 'match[]={__name__="jaeger_operator_instances_storage_types"}' \
--data-urlencode 'match[]={__name__="jaeger_operator_instances_strategies"}' \
--data-urlencode 'match[]={__name__="jaeger_operator_instances_agent_strategies"}' \
--data-urlencode 'match[]={__name__="appsvcs:cores_by_product:sum"}' \
--data-urlencode 'match[]={__name__="nto_custom_profiles:count"}' \
--data-urlencode 'match[]={__name__="openshift_csi_share_configmap"}' \
--data-urlencode 'match[]={__name__="openshift_csi_share_secret"}' \
--data-urlencode 'match[]={__name__="openshift_csi_share_mount_failures_total"}' \
--data-urlencode 'match[]={__name__="openshift_csi_share_mount_requests_total"}' \
--data-urlencode 'match[]={__name__="cluster:velero_backup_total:max"}' \
--data-urlencode 'match[]={__name__="cluster:velero_restore_total:max"}' \
--data-urlencode 'match[]={__name__="eo_es_storage_info"}' \
--data-urlencode 'match[]={__name__="eo_es_redundancy_policy_info"}' \
--data-urlencode 'match[]={__name__="eo_es_defined_delete_namespaces_total"}' \
--data-urlencode 'match[]={__name__="eo_es_misconfigured_memory_resources_info"}' \
--data-urlencode 'match[]={__name__="cluster:eo_es_data_nodes_total:max"}' \
--data-urlencode 'match[]={__name__="cluster:eo_es_documents_created_total:sum"}' \
--data-urlencode 'match[]={__name__="cluster:eo_es_documents_deleted_total:sum"}' \
--data-urlencode 'match[]={__name__="pod:eo_es_shards_total:max"}' \
--data-urlencode 'match[]={__name__="eo_es_cluster_management_state_info"}' \
--data-urlencode 'match[]={__name__="imageregistry:imagestreamtags_count:sum"}' \
--data-urlencode 'match[]={__name__="imageregistry:operations_count:sum"}' \
--data-urlencode 'match[]={__name__="log_logging_info"}' \
--data-urlencode 'match[]={__name__="log_collector_error_count_total"}' \
--data-urlencode 'match[]={__name__="log_forwarder_pipeline_info"}' \
--data-urlencode 'match[]={__name__="log_forwarder_input_info"}' \
--data-urlencode 'match[]={__name__="log_forwarder_output_info"}' \
--data-urlencode 'match[]={__name__="cluster:log_collected_bytes_total:sum"}' \
--data-urlencode 'match[]={__name__="cluster:log_logged_bytes_total:sum"}' \
--data-urlencode 'match[]={__name__="cluster:kata_monitor_running_shim_count:sum"}' \
--data-urlencode 'match[]={__name__="platform:hypershift_hostedclusters:max"}' \
--data-urlencode 'match[]={__name__="platform:hypershift_nodepools:max"}' \
--data-urlencode 'match[]={__name__="namespace:noobaa_unhealthy_bucket_claims:max"}' \
--data-urlencode 'match[]={__name__="namespace:noobaa_buckets_claims:max"}' \
--data-urlencode 'match[]={__name__="namespace:noobaa_unhealthy_namespace_resources:max"}' \
--data-urlencode 'match[]={__name__="namespace:noobaa_namespace_resources:max"}' \
--data-urlencode 'match[]={__name__="namespace:noobaa_unhealthy_namespace_buckets:max"}' \
--data-urlencode 'match[]={__name__="namespace:noobaa_namespace_buckets:max"}' \
--data-urlencode 'match[]={__name__="namespace:noobaa_accounts:max"}' \
--data-urlencode 'match[]={__name__="namespace:noobaa_usage:max"}' \
--data-urlencode 'match[]={__name__="namespace:noobaa_system_health_status:max"}' \
--data-urlencode 'match[]={__name__="ocs_advanced_feature_usage"}' \
--data-urlencode 'match[]={__name__="os_image_url_override:sum"}'
4.3. Using Insights to identify issues with your cluster
Insights repeatedly analyzes the data Insights Operator sends. Users of OpenShift Dedicated can display the report in the Insights Advisor service on Red Hat Hybrid Cloud Console.
4.3.1. About Red Hat Insights Advisor for OpenShift Dedicated
You can use Insights Advisor to assess and monitor the health of your OpenShift Dedicated clusters. Whether you are concerned about individual clusters, or with your whole infrastructure, it is important to be aware of the exposure of your cluster infrastructure to issues that can affect service availability, fault tolerance, performance, or security.
Using cluster data collected by the Insights Operator, Insights repeatedly compares that data against a library of recommendations. Each recommendation is a set of cluster-environment conditions that can leave OpenShift Dedicated clusters at risk. The results of the Insights analysis are available in the Insights Advisor service on Red Hat Hybrid Cloud Console. In the Console, you can perform the following actions:
- See clusters impacted by a specific recommendation.
- Use robust filtering capabilities to refine your results to those recommendations.
- Learn more about individual recommendations, details about the risks they present, and get resolutions tailored to your individual clusters.
- Share results with other stakeholders.
4.3.2. Understanding Insights Advisor recommendations
Insights Advisor bundles information about various cluster states and component configurations that can negatively affect the service availability, fault tolerance, performance, or security of your clusters. This information set is called a recommendation in Insights Advisor and includes the following information:
- Name: A concise description of the recommendation
- Added: When the recommendation was published to the Insights Advisor archive
- Category: Whether the issue has the potential to negatively affect service availability, fault tolerance, performance, or security
- Total risk: A value derived from the likelihood that the condition will negatively affect your infrastructure, and the impact on operations if that were to happen
- Clusters: A list of clusters on which a recommendation is detected
- Description: A brief synopsis of the issue, including how it affects your clusters
- Link to associated topics: More information from Red Hat about the issue
4.3.3. Displaying potential issues with your cluster
This section describes how to display the Insights report in Insights Advisor on OpenShift Cluster Manager.
Note that Insights repeatedly analyzes your cluster and shows the latest results. These results can change, for example, if you fix an issue or a new issue has been detected.
Prerequisites
- Your cluster is registered on OpenShift Cluster Manager.
- Remote health reporting is enabled, which is the default.
- You are logged in to OpenShift Cluster Manager.
Procedure
Navigate to Advisor → Recommendations on OpenShift Cluster Manager.
Depending on the result, Insights Advisor displays one of the following:
- No matching recommendations found, if Insights did not identify any issues.
- A list of issues Insights has detected, grouped by risk (low, moderate, important, and critical).
- No clusters yet, if Insights has not yet analyzed the cluster. The analysis starts shortly after the cluster has been installed, registered, and connected to the internet.
If any issues are displayed, click the > icon in front of the entry for more details.
Depending on the issue, the details can also contain a link to more information from Red Hat about the issue.
4.3.4. Displaying all Insights Advisor recommendations
The Recommendations view, by default, only displays the recommendations that are detected on your clusters. However, you can view all of the recommendations in the advisor archive.
Prerequisites
- Remote health reporting is enabled, which is the default.
- Your cluster is registered on Red Hat Hybrid Cloud Console.
- You are logged in to OpenShift Cluster Manager.
Procedure
- Navigate to Advisor → Recommendations on OpenShift Cluster Manager.
Click the X icons next to the Clusters Impacted and Status filters.
You can now browse through all of the potential recommendations for your cluster.
4.3.5. Advisor recommendation filters
The Insights advisor service can return a large number of recommendations. To focus on your most critical recommendations, you can apply filters to the Advisor recommendations list to remove low-priority recommendations.
By default, filters are set to only show enabled recommendations that are impacting one or more clusters. To view all or disabled recommendations in the Insights library, you can customize the filters.
To apply a filter, select a filter type and then set its value based on the options that are available in the drop-down list. You can apply multiple filters to the list of recommendations.
You can set the following filter types:
- Name: Search for a recommendation by name.
- Total risk: Select one or more values from Critical, Important, Moderate, and Low indicating the likelihood and the severity of a negative impact on a cluster.
- Impact: Select one or more values from Critical, High, Medium, and Low indicating the potential impact to the continuity of cluster operations.
- Likelihood: Select one or more values from Critical, High, Medium, and Low indicating the potential for a negative impact to a cluster if the recommendation comes to fruition.
- Category: Select one or more categories from Service Availability, Performance, Fault Tolerance, Security, and Best Practice to focus your attention on.
- Status: Click a radio button to show enabled recommendations (default), disabled recommendations, or all recommendations.
- Clusters impacted: Set the filter to show recommendations currently impacting one or more clusters, non-impacting recommendations, or all recommendations.
- Risk of change: Select one or more values from High, Moderate, Low, and Very low indicating the risk that the implementation of the resolution could have on cluster operations.
4.3.5.1. Filtering Insights advisor recommendations
As an OpenShift Dedicated cluster manager, you can filter the recommendations that are displayed on the recommendations list. By applying filters, you can reduce the number of reported recommendations and concentrate on your highest priority recommendations.
The following procedure demonstrates how to set and remove Category filters; however, the procedure is applicable to any of the filter types and respective values.
Prerequisites
You are logged in to the OpenShift Cluster Manager Hybrid Cloud Console.
Procedure
- Go to Red Hat Hybrid Cloud Console → OpenShift → Advisor recommendations.
- In the main, filter-type drop-down list, select the Category filter type.
- Expand the filter-value drop-down list and select the checkbox next to each category of recommendation you want to view. Leave the checkboxes for unnecessary categories clear.
- Optional: Add additional filters to further refine the list.
Only recommendations from the selected categories are shown in the list.
Verification
- After applying filters, you can view the updated recommendations list. The applied filters are added next to the default filters.
4.3.5.2. Removing filters from Insights Advisor recommendations
You can apply multiple filters to the list of recommendations. When ready, you can remove them individually or completely reset them.
Removing filters individually
- Click the X icon next to each filter, including the default filters, to remove them individually.
Removing all non-default filters
- Click Reset filters to remove only the filters that you applied, leaving the default filters in place.
4.3.6. Disabling Insights Advisor recommendations
You can disable specific recommendations that affect your clusters, so that they no longer appear in your reports. It is possible to disable a recommendation for a single cluster or all of your clusters.
Disabling a recommendation for all of your clusters also applies to any future clusters.
Prerequisites
- Remote health reporting is enabled, which is the default.
- Your cluster is registered on OpenShift Cluster Manager.
- You are logged in to OpenShift Cluster Manager.
Procedure
- Navigate to Advisor → Recommendations on OpenShift Cluster Manager.
- Optional: Use the Clusters Impacted and Status filters as needed.
Disable an alert by using one of the following methods:
To disable an alert:
-
Click the Options menu
 for that alert, and then click Disable recommendation.
- Enter a justification note and click Save.
-
Click the Options menu
To view the clusters affected by this alert before disabling the alert:
- Click the name of the recommendation to disable. You are directed to the single recommendation page.
- Review the list of clusters in the Affected clusters section.
- Click Actions → Disable recommendation to disable the alert for all of your clusters.
- Enter a justification note and click Save.
4.3.7. Enabling a previously disabled Insights Advisor recommendation
When a recommendation is disabled for all clusters, you no longer see the recommendation in the Insights Advisor. You can change this behavior.
Prerequisites
- Remote health reporting is enabled, which is the default.
- Your cluster is registered on OpenShift Cluster Manager.
- You are logged in to OpenShift Cluster Manager.
Procedure
- Navigate to Advisor → Recommendations on OpenShift Cluster Manager.
Filter the recommendations to display on the disabled recommendations:
- From the Status drop-down menu, select Status.
- From the Filter by status drop-down menu, select Disabled.
- Optional: Clear the Clusters impacted filter.
- Locate the recommendation to enable.
-
Click the Options menu
, and then click Enable recommendation.
4.3.8. Displaying the Insights status in the web console
Insights repeatedly analyzes your cluster and you can display the status of identified potential issues of your cluster in the OpenShift Dedicated web console. This status shows the number of issues in the different categories and, for further details, links to the reports in OpenShift Cluster Manager.
Prerequisites
- Your cluster is registered in OpenShift Cluster Manager.
- Remote health reporting is enabled, which is the default.
- You are logged in to the OpenShift Dedicated web console.
Procedure
- Navigate to Home → Overview in the OpenShift Dedicated web console.
Click Insights on the Status card.
The pop-up window lists potential issues grouped by risk. Click the individual categories or View all recommendations in Insights Advisor to display more details.
4.4. Using the Insights Operator
The Insights Operator periodically gathers configuration and component failure status and, by default, reports that data every two hours to Red Hat. This information enables Red Hat to assess configuration and deeper failure data than is reported through Telemetry. Users of OpenShift Dedicated can display the report in the Insights Advisor service on Red Hat Hybrid Cloud Console.
Additional resources
- For more information on using Insights Advisor to identify issues with your cluster, see Using Insights to identify issues with your cluster.
4.4.1. Understanding Insights Operator alerts
The Insights Operator declares alerts through the Prometheus monitoring system to the Alertmanager. You can view these alerts in the Alerting UI in the OpenShift Dedicated web console by using one of the following methods:
- In the Administrator perspective, click Observe → Alerting.
- In the Developer perspective, click Observe → <project_name> → Alerts tab.
Currently, Insights Operator sends the following alerts when the conditions are met:
Table 4.1. Insights Operator alerts
| Alert | Description |
|---|---|
|
| Insights Operator is disabled. |
|
| Simple content access is not enabled in Red Hat Subscription Management. |
|
| Insights has an active recommendation for the cluster. |
4.4.2. Obfuscating Deployment Validation Operator data
Cluster administrators can configure the Insight Operator to obfuscate data from the Deployment Validation Operator (DVO), if the Operator is installed. When the workload_names value is added to the insights-config ConfigMap object, workload names—rather than UIDs—are displayed in Insights for Openshift, making them more recognizable for cluster administrators.
Prerequisites
- Remote health reporting is enabled, which is the default.
- You are logged in to the OpenShift Dedicated web console with the "cluster-admin" role.
-
The insights-config
ConfigMapobject exists in theopenshift-insightsnamespace. - The cluster is self managed and the Deployment Validation Operator is installed.
Procedure
- Go to Workloads → ConfigMaps and select Project: openshift-insights.
-
Click on the insights-config
ConfigMapobject to open it. - Click Actions and select Edit ConfigMap.
- Click the YAML view radio button.
In the file, set the
obfuscationattribute with theworkload_namesvalue.apiVersion: v1 kind: ConfigMap # ... data: config.yaml: | dataReporting: obfuscation: - workload_names # ...- Click Save. The insights-config config-map details page opens.
-
Verify that the value of the
config.yamlobfuscationattribute is set to- workload_names.
Chapter 5. Summarizing cluster specifications
5.1. Summarizing cluster specifications by using a cluster version object
You can obtain a summary of OpenShift Dedicated cluster specifications by querying the clusterversion resource.
Prerequisites
-
You have access to the cluster as a user with the
dedicated-adminrole. -
You have installed the OpenShift CLI (
oc).
Procedure
Query cluster version, availability, uptime, and general status:
$ oc get clusterversion
Example output
NAME      VERSION   AVAILABLE   PROGRESSING   SINCE   STATUS
version   4.13.8    True        False         8h      Cluster version is 4.13.8
Obtain a detailed summary of cluster specifications, update availability, and update history:
$ oc describe clusterversion
Example output
Name:         version
Namespace:
Labels:       <none>
Annotations:  <none>
API Version:  config.openshift.io/v1
Kind:         ClusterVersion
# ...
    Image:    quay.io/openshift-release-dev/ocp-release@sha256:a956488d295fe5a59c8663a4d9992b9b5d0950f510a7387dbbfb8d20fc5970ce
    URL:      https://access.redhat.com/errata/RHSA-2023:4456
    Version:  4.13.8
  History:
    Completion Time:    2023-08-17T13:20:21Z
    Image:              quay.io/openshift-release-dev/ocp-release@sha256:a956488d295fe5a59c8663a4d9992b9b5d0950f510a7387dbbfb8d20fc5970ce
    Started Time:       2023-08-17T12:59:45Z
    State:              Completed
    Verified:           false
    Version:            4.13.8
# ...
Chapter 6. Troubleshooting
6.1. Verifying node health
6.1.1. Reviewing node status, resource usage, and configuration
Review cluster node health status, resource consumption statistics, and node logs. Additionally, query kubelet status on individual nodes.
Prerequisites
-
You have access to the cluster as a user with the
dedicated-adminrole. -
You have installed the OpenShift CLI (
oc).
Procedure
List the name, status, and role for all nodes in the cluster:
$ oc get nodes
Summarize CPU and memory usage for each node within the cluster:
$ oc adm top nodes
Summarize CPU and memory usage for a specific node:
$ oc adm top node my-node
6.2. Troubleshooting Operator issues
Operators are a method of packaging, deploying, and managing an OpenShift Dedicated application. They act like an extension of the software vendor’s engineering team, watching over an OpenShift Dedicated environment and using its current state to make decisions in real time. Operators are designed to handle upgrades seamlessly, react to failures automatically, and not take shortcuts, such as skipping a software backup process to save time.
OpenShift Dedicated 4 includes a default set of Operators that are required for proper functioning of the cluster. These default Operators are managed by the Cluster Version Operator (CVO).
As a cluster administrator, you can install application Operators from the OperatorHub using the OpenShift Dedicated web console or the CLI. You can then subscribe the Operator to one or more namespaces to make it available for developers on your cluster. Application Operators are managed by Operator Lifecycle Manager (OLM).
If you experience Operator issues, verify Operator subscription status. Check Operator pod health across the cluster and gather Operator logs for diagnosis.
6.2.1. Operator subscription condition types
Subscriptions can report the following condition types:
Table 6.1. Subscription condition types
| Condition | Description |
|---|---|
|
| Some or all of the catalog sources to be used in resolution are unhealthy. |
|
| An install plan for a subscription is missing. |
|
| An install plan for a subscription is pending installation. |
|
| An install plan for a subscription has failed. |
|
| The dependency resolution for a subscription has failed. |
Default OpenShift Dedicated cluster Operators are managed by the Cluster Version Operator (CVO) and they do not have a Subscription object. Application Operators are managed by Operator Lifecycle Manager (OLM) and they have a Subscription object.
Additional resources
6.2.2. Viewing Operator subscription status by using the CLI
You can view Operator subscription status by using the CLI.
Prerequisites
-
You have access to the cluster as a user with the
dedicated-adminrole. -
You have installed the OpenShift CLI (
oc).
Procedure
List Operator subscriptions:
$ oc get subs -n <operator_namespace>
Use the
oc describecommand to inspect aSubscriptionresource:$ oc describe sub <subscription_name> -n <operator_namespace>
In the command output, find the
Conditionssection for the status of Operator subscription condition types. In the following example, theCatalogSourcesUnhealthycondition type has a status offalsebecause all available catalog sources are healthy:Example output
Name:         cluster-logging
Namespace:    openshift-logging
Labels:       operators.coreos.com/cluster-logging.openshift-logging=
Annotations:  <none>
API Version:  operators.coreos.com/v1alpha1
Kind:         Subscription
# ...
Conditions:
   Last Transition Time:  2019-07-29T13:42:57Z
   Message:               all available catalogsources are healthy
   Reason:                AllCatalogSourcesHealthy
   Status:                False
   Type:                  CatalogSourcesUnhealthy
# ...
Default OpenShift Dedicated cluster Operators are managed by the Cluster Version Operator (CVO) and they do not have a Subscription object. Application Operators are managed by Operator Lifecycle Manager (OLM) and they have a Subscription object.
6.2.3. Viewing Operator catalog source status by using the CLI
You can view the status of an Operator catalog source by using the CLI.
Prerequisites
-
You have access to the cluster as a user with the
dedicated-adminrole. -
You have installed the OpenShift CLI (
oc).
Procedure
List the catalog sources in a namespace. For example, you can check the
openshift-marketplacenamespace, which is used for cluster-wide catalog sources:$ oc get catalogsources -n openshift-marketplace
Example output
NAME                  DISPLAY               TYPE   PUBLISHER   AGE
certified-operators   Certified Operators   grpc   Red Hat     55m
community-operators   Community Operators   grpc   Red Hat     55m
example-catalog       Example Catalog       grpc   Example Org 2m25s
redhat-marketplace    Red Hat Marketplace   grpc   Red Hat     55m
redhat-operators      Red Hat Operators     grpc   Red Hat     55m
Use the
oc describecommand to get more details and status about a catalog source:$ oc describe catalogsource example-catalog -n openshift-marketplace
Example output
Name:         example-catalog
Namespace:    openshift-marketplace
Labels:       <none>
Annotations:  operatorframework.io/managed-by: marketplace-operator
              target.workload.openshift.io/management: {"effect": "PreferredDuringScheduling"}
API Version:  operators.coreos.com/v1alpha1
Kind:         CatalogSource
# ...
Status:
  Connection State:
    Address:              example-catalog.openshift-marketplace.svc:50051
    Last Connect:         2021-09-09T17:07:35Z
    Last Observed State:  TRANSIENT_FAILURE
  Registry Service:
    Created At:         2021-09-09T17:05:45Z
    Port:               50051
    Protocol:           grpc
    Service Name:       example-catalog
    Service Namespace:  openshift-marketplace
# ...
In the preceding example output, the last observed state is
TRANSIENT_FAILURE. This state indicates that there is a problem establishing a connection for the catalog source.List the pods in the namespace where your catalog source was created:
$ oc get pods -n openshift-marketplace
Example output
NAME                                    READY   STATUS             RESTARTS   AGE
certified-operators-cv9nn               1/1     Running            0          36m
community-operators-6v8lp               1/1     Running            0          36m
marketplace-operator-86bfc75f9b-jkgbc   1/1     Running            0          42m
example-catalog-bwt8z                   0/1     ImagePullBackOff   0          3m55s
redhat-marketplace-57p8c                1/1     Running            0          36m
redhat-operators-smxx8                  1/1     Running            0          36m
When a catalog source is created in a namespace, a pod for the catalog source is created in that namespace. In the preceding example output, the status for the
example-catalog-bwt8zpod isImagePullBackOff. This status indicates that there is an issue pulling the catalog source’s index image.Use the
oc describecommand to inspect a pod for more detailed information:$ oc describe pod example-catalog-bwt8z -n openshift-marketplace
Example output
Name:         example-catalog-bwt8z
Namespace:    openshift-marketplace
Priority:     0
Node:         ci-ln-jyryyg2-f76d1-ggdbq-worker-b-vsxjd/10.0.128.2
...
Events:
  Type     Reason          Age                From               Message
  ----     ------          ----               ----               -------
  Normal   Scheduled       48s                default-scheduler  Successfully assigned openshift-marketplace/example-catalog-bwt8z to ci-ln-jyryyf2-f76d1-fgdbq-worker-b-vsxjd
  Normal   AddedInterface  47s                multus             Add eth0 [10.131.0.40/23] from openshift-sdn
  Normal   BackOff         20s (x2 over 46s)  kubelet            Back-off pulling image "quay.io/example-org/example-catalog:v1"
  Warning  Failed          20s (x2 over 46s)  kubelet            Error: ImagePullBackOff
  Normal   Pulling         8s (x3 over 47s)   kubelet            Pulling image "quay.io/example-org/example-catalog:v1"
  Warning  Failed          8s (x3 over 47s)   kubelet            Failed to pull image "quay.io/example-org/example-catalog:v1": rpc error: code = Unknown desc = reading manifest v1 in quay.io/example-org/example-catalog: unauthorized: access to the requested resource is not authorized
  Warning  Failed          8s (x3 over 47s)   kubelet            Error: ErrImagePull
In the preceding example output, the error messages indicate that the catalog source’s index image is failing to pull successfully because of an authorization issue. For example, the index image might be stored in a registry that requires login credentials.
Additional resources
- gRPC documentation: States of Connectivity
6.2.4. Querying Operator pod status
You can list Operator pods within a cluster and their status. You can also collect a detailed Operator pod summary.
Prerequisites
-
You have access to the cluster as a user with the
dedicated-adminrole. - Your API service is still functional.
-
You have installed the OpenShift CLI (
oc).
Procedure
List Operators running in the cluster. The output includes Operator version, availability, and up-time information:
$ oc get clusteroperators
List Operator pods running in the Operator’s namespace, plus pod status, restarts, and age:
$ oc get pod -n <operator_namespace>
Output a detailed Operator pod summary:
$ oc describe pod <operator_pod_name> -n <operator_namespace>
6.2.5. Gathering Operator logs
If you experience Operator issues, you can gather detailed diagnostic information from Operator pod logs.
Prerequisites
-
You have access to the cluster as a user with the
dedicated-adminrole. - Your API service is still functional.
-
You have installed the OpenShift CLI (
oc). - You have the fully qualified domain names of the control plane or control plane machines.
Procedure
List the Operator pods that are running in the Operator’s namespace, plus the pod status, restarts, and age:
$ oc get pods -n <operator_namespace>
Review logs for an Operator pod:
$ oc logs pod/<pod_name> -n <operator_namespace>
If an Operator pod has multiple containers, the preceding command will produce an error that includes the name of each container. Query logs from an individual container:
$ oc logs pod/<operator_pod_name> -c <container_name> -n <operator_namespace>
If the API is not functional, review Operator pod and container logs on each control plane node by using SSH instead. Replace
<master-node>.<cluster_name>.<base_domain>with appropriate values.List pods on each control plane node:
$ ssh core@<master-node>.<cluster_name>.<base_domain> sudo crictl pods
For any Operator pods not showing a
Readystatus, inspect the pod’s status in detail. Replace<operator_pod_id>with the Operator pod’s ID listed in the output of the preceding command:$ ssh core@<master-node>.<cluster_name>.<base_domain> sudo crictl inspectp <operator_pod_id>
List containers related to an Operator pod:
$ ssh core@<master-node>.<cluster_name>.<base_domain> sudo crictl ps --pod=<operator_pod_id>
For any Operator container not showing a
Readystatus, inspect the container’s status in detail. Replace<container_id>with a container ID listed in the output of the preceding command:$ ssh core@<master-node>.<cluster_name>.<base_domain> sudo crictl inspect <container_id>
Review the logs for any Operator containers not showing a
Readystatus. Replace<container_id>with a container ID listed in the output of the preceding command:$ ssh core@<master-node>.<cluster_name>.<base_domain> sudo crictl logs -f <container_id>
NoteOpenShift Dedicated 4 cluster nodes running Red Hat Enterprise Linux CoreOS (RHCOS) are immutable and rely on Operators to apply cluster changes. Accessing cluster nodes by using SSH is not recommended. Before attempting to collect diagnostic data over SSH, review whether the data collected by running
oc adm must gatherand otheroccommands is sufficient instead. However, if the OpenShift Dedicated API is not available, or the kubelet is not properly functioning on the target node,ocoperations will be impacted. In such situations, it is possible to access nodes usingssh core@<node>.<cluster_name>.<base_domain>.
6.3. Investigating pod issues
OpenShift Dedicated leverages the Kubernetes concept of a pod, which is one or more containers deployed together on one host. A pod is the smallest compute unit that can be defined, deployed, and managed on OpenShift Dedicated 4.
After a pod is defined, it is assigned to run on a node until its containers exit, or until it is removed. Depending on policy and exit code, Pods are either removed after exiting or retained so that their logs can be accessed.
The first thing to check when pod issues arise is the pod’s status. If an explicit pod failure has occurred, observe the pod’s error state to identify specific image, container, or pod network issues. Focus diagnostic data collection according to the error state. Review pod event messages, as well as pod and container log information. Diagnose issues dynamically by accessing running Pods on the command line, or start a debug pod with root access based on a problematic pod’s deployment configuration.
6.3.1. Understanding pod error states
Pod failures return explicit error states that can be observed in the status field in the output of oc get pods. Pod error states cover image, container, and container network related failures.
The following table provides a list of pod error states along with their descriptions.
Table 6.2. Pod error states
| Pod error state | Description |
|---|---|
|
| Generic image retrieval error. |
|
| Image retrieval failed and is backed off. |
|
| The specified image name was invalid. |
|
| Image inspection did not succeed. |
|
|
|
|
| When attempting to retrieve an image from a registry, an HTTP error was encountered. |
|
| The specified container is either not present or not managed by the kubelet, within the declared pod. |
|
| Container initialization failed. |
|
| None of the pod’s containers started successfully. |
|
| None of the pod’s containers were killed successfully. |
|
| A container has terminated. The kubelet will not attempt to restart it. |
|
| A container or image attempted to run with root privileges. |
|
| Pod sandbox creation did not succeed. |
|
| Pod sandbox configuration was not obtained. |
|
| A pod sandbox did not stop successfully. |
|
| Network initialization failed. |
|
| Network termination failed. |
6.3.2. Reviewing pod status
You can query pod status and error states. You can also query a pod’s associated deployment configuration and review base image availability.
Prerequisites
-
You have access to the cluster as a user with the
dedicated-adminrole. -
You have installed the OpenShift CLI (
oc). -
skopeois installed.
Procedure
Switch into a project:
$ oc project <project_name>
List pods running within the namespace, as well as pod status, error states, restarts, and age:
$ oc get pods
Determine whether the namespace is managed by a deployment configuration:
$ oc status
If the namespace is managed by a deployment configuration, the output includes the deployment configuration name and a base image reference.
Inspect the base image referenced in the preceding command’s output:
$ skopeo inspect docker://<image_reference>
If the base image reference is not correct, update the reference in the deployment configuration:
$ oc edit deployment/my-deployment
When deployment configuration changes on exit, the configuration will automatically redeploy. Watch pod status as the deployment progresses, to determine whether the issue has been resolved:
$ oc get pods -w
Review events within the namespace for diagnostic information relating to pod failures:
$ oc get events
6.3.3. Inspecting pod and container logs
You can inspect pod and container logs for warnings and error messages related to explicit pod failures. Depending on policy and exit code, pod and container logs remain available after pods have been terminated.
Prerequisites
-
You have access to the cluster as a user with the
dedicated-adminrole. - Your API service is still functional.
-
You have installed the OpenShift CLI (
oc).
Procedure
Query logs for a specific pod:
$ oc logs <pod_name>
Query logs for a specific container within a pod:
$ oc logs <pod_name> -c <container_name>
Logs retrieved using the preceding
oc logscommands are composed of messages sent to stdout within pods or containers.Inspect logs contained in
/var/log/within a pod.List log files and subdirectories contained in
/var/logwithin a pod:$ oc exec <pod_name> -- ls -alh /var/log
Example output
total 124K
drwxr-xr-x. 1 root root   33 Aug 11 11:23 .
drwxr-xr-x. 1 root root   28 Sep  6  2022 ..
-rw-rw----. 1 root utmp    0 Jul 10 10:31 btmp
-rw-r--r--. 1 root root  33K Jul 17 10:07 dnf.librepo.log
-rw-r--r--. 1 root root  69K Jul 17 10:07 dnf.log
-rw-r--r--. 1 root root 8.8K Jul 17 10:07 dnf.rpm.log
-rw-r--r--. 1 root root  480 Jul 17 10:07 hawkey.log
-rw-rw-r--. 1 root utmp    0 Jul 10 10:31 lastlog
drwx------. 2 root root   23 Aug 11 11:14 openshift-apiserver
drwx------. 2 root root    6 Jul 10 10:31 private
drwxr-xr-x. 1 root root   22 Mar  9 08:05 rhsm
-rw-rw-r--. 1 root utmp    0 Jul 10 10:31 wtmp
Query a specific log file contained in
/var/logwithin a pod:$ oc exec <pod_name> cat /var/log/<path_to_log>
Example output
2023-07-10T10:29:38+0000 INFO --- logging initialized ---
2023-07-10T10:29:38+0000 DDEBUG timer: config: 13 ms
2023-07-10T10:29:38+0000 DEBUG Loaded plugins: builddep, changelog, config-manager, copr, debug, debuginfo-install, download, generate_completion_cache, groups-manager, needs-restarting, playground, product-id, repoclosure, repodiff, repograph, repomanage, reposync, subscription-manager, uploadprofile
2023-07-10T10:29:38+0000 INFO Updating Subscription Management repositories.
2023-07-10T10:29:38+0000 INFO Unable to read consumer identity
2023-07-10T10:29:38+0000 INFO Subscription Manager is operating in container mode.
2023-07-10T10:29:38+0000 INFO
List log files and subdirectories contained in
/var/logwithin a specific container:$ oc exec <pod_name> -c <container_name> ls /var/log
Query a specific log file contained in
/var/logwithin a specific container:$ oc exec <pod_name> -c <container_name> cat /var/log/<path_to_log>
6.3.4. Accessing running pods
You can review running pods dynamically by opening a shell inside a pod or by gaining network access through port forwarding.
Prerequisites
-
You have access to the cluster as a user with the
dedicated-adminrole. - Your API service is still functional.
-
You have installed the OpenShift CLI (
oc).
Procedure
Switch into the project that contains the pod you would like to access. This is necessary because the
oc rshcommand does not accept the-nnamespace option:$ oc project <namespace>
Start a remote shell into a pod:
$ oc rsh <pod_name> 1- 1
- If a pod has multiple containers,
oc rshdefaults to the first container unless-c <container_name>is specified.
Start a remote shell into a specific container within a pod:
$ oc rsh -c <container_name> pod/<pod_name>
Create a port forwarding session to a port on a pod:
$ oc port-forward <pod_name> <host_port>:<pod_port> 1- 1
- Enter
Ctrl+Cto cancel the port forwarding session.
6.3.5. Starting debug pods with root access
You can start a debug pod with root access, based on a problematic pod’s deployment or deployment configuration. Pod users typically run with non-root privileges, but running troubleshooting pods with temporary root privileges can be useful during issue investigation.
Prerequisites
-
You have access to the cluster as a user with the
dedicated-adminrole. - Your API service is still functional.
-
You have installed the OpenShift CLI (
oc).
Procedure
Start a debug pod with root access, based on a deployment.
Obtain a project’s deployment name:
$ oc get deployment -n <project_name>
Start a debug pod with root privileges, based on the deployment:
$ oc debug deployment/my-deployment --as-root -n <project_name>
Start a debug pod with root access, based on a deployment configuration.
Obtain a project’s deployment configuration name:
$ oc get deploymentconfigs -n <project_name>
Start a debug pod with root privileges, based on the deployment configuration:
$ oc debug deploymentconfig/my-deployment-configuration --as-root -n <project_name>
You can append -- <command> to the preceding oc debug commands to run individual commands within a debug pod, instead of running an interactive shell.
6.3.6. Copying files to and from pods and containers
You can copy files to and from a pod to test configuration changes or gather diagnostic information.
Prerequisites
-
You have access to the cluster as a user with the
dedicated-adminrole. - Your API service is still functional.
-
You have installed the OpenShift CLI (
oc).
Procedure
Copy a file to a pod:
$ oc cp <local_path> <pod_name>:/<path> -c <container_name> 1- 1
- The first container in a pod is selected if the
-coption is not specified.
Copy a file from a pod:
$ oc cp <pod_name>:/<path> -c <container_name> <local_path> 1- 1
- The first container in a pod is selected if the
-coption is not specified.
NoteFor
oc cpto function, thetarbinary must be available within the container.
6.4. Troubleshooting storage issues
6.4.1. Resolving multi-attach errors
When a node crashes or shuts down abruptly, the attached ReadWriteOnce (RWO) volume is expected to be unmounted from the node so that it can be used by a pod scheduled on another node.
However, mounting on a new node is not possible because the failed node is unable to unmount the attached volume.
A multi-attach error is reported:
Example output
Unable to attach or mount volumes: unmounted volumes=[sso-mysql-pvol], unattached volumes=[sso-mysql-pvol default-token-x4rzc]: timed out waiting for the condition
Multi-Attach error for volume "pvc-8837384d-69d7-40b2-b2e6-5df86943eef9" Volume is already used by pod(s) sso-mysql-1-ns6b4
Procedure
To resolve the multi-attach issue, use one of the following solutions:
Enable multiple attachments by using RWX volumes.
For most storage solutions, you can use ReadWriteMany (RWX) volumes to prevent multi-attach errors.
Recover or delete the failed node when using an RWO volume.
For storage that does not support RWX, such as VMware vSphere, RWO volumes must be used instead. However, RWO volumes cannot be mounted on multiple nodes.
If you encounter a multi-attach error message with an RWO volume, force delete the pod on a shutdown or crashed node to avoid data loss in critical workloads, such as when dynamic persistent volumes are attached.
$ oc delete pod <old_pod> --force=true --grace-period=0
This command deletes the volumes stuck on shutdown or crashed nodes after six minutes.
6.5. Investigating monitoring issues
OpenShift Dedicated includes a preconfigured, preinstalled, and self-updating monitoring stack that provides monitoring for core platform components. In OpenShift Dedicated 4, cluster administrators can optionally enable monitoring for user-defined projects.
Use these procedures if the following issues occur:
- Your own metrics are unavailable.
- Prometheus is consuming a lot of disk space.
-
The
KubePersistentVolumeFillingUpalert is firing for Prometheus.
6.5.2. Determining why Prometheus is consuming a lot of disk space
Developers can create labels to define attributes for metrics in the form of key-value pairs. The number of potential key-value pairs corresponds to the number of possible values for an attribute. An attribute that has an unlimited number of potential values is called an unbound attribute. For example, a customer_id attribute is unbound because it has an infinite number of possible values.
Every assigned key-value pair has a unique time series. The use of many unbound attributes in labels can result in an exponential increase in the number of time series created. This can impact Prometheus performance and can consume a lot of disk space.
You can use the following measures when Prometheus consumes a lot of disk:
- Check the time series database (TSDB) status using the Prometheus HTTP API for more information about which labels are creating the most time series data. Doing so requires cluster administrator privileges.
- Check the number of scrape samples that are being collected.
Reduce the number of unique time series that are created by reducing the number of unbound attributes that are assigned to user-defined metrics.
NoteUsing attributes that are bound to a limited set of possible values reduces the number of potential key-value pair combinations.
- Enforce limits on the number of samples that can be scraped across user-defined projects. This requires cluster administrator privileges.
Prerequisites
-
You have access to the cluster as a user with the
dedicated-adminrole. -
You have installed the OpenShift CLI (
oc).
Procedure
- In the Administrator perspective, navigate to Observe → Metrics.
Enter a Prometheus Query Language (PromQL) query in the Expression field. The following example queries help to identify high cardinality metrics that might result in high disk space consumption:
By running the following query, you can identify the ten jobs that have the highest number of scrape samples:
topk(10, max by(namespace, job) (topk by(namespace, job) (1, scrape_samples_post_metric_relabeling)))
By running the following query, you can pinpoint time series churn by identifying the ten jobs that have created the most time series data in the last hour:
topk(10, sum by(namespace, job) (sum_over_time(scrape_series_added[1h])))
Investigate the number of unbound label values assigned to metrics with higher than expected scrape sample counts:
- If the metrics relate to a user-defined project, review the metrics key-value pairs assigned to your workload. These are implemented through Prometheus client libraries at the application level. Try to limit the number of unbound attributes referenced in your labels.
- If the metrics relate to a core OpenShift Dedicated project, create a Red Hat support case on the Red Hat Customer Portal.
Review the TSDB status using the Prometheus HTTP API by following these steps when logged in as a
dedicated-admin:Get the Prometheus API route URL by running the following command:
$ HOST=$(oc -n openshift-monitoring get route prometheus-k8s -ojsonpath={.spec.host})Extract an authentication token by running the following command:
$ TOKEN=$(oc whoami -t)
Query the TSDB status for Prometheus by running the following command:
$ curl -H "Authorization: Bearer $TOKEN" -k "https://$HOST/api/v1/status/tsdb"
Example output
"status": "success","data":{"headStats":{"numSeries":507473,
"numLabelPairs":19832,"chunkCount":946298,"minTime":1712253600010,
"maxTime":1712257935346},"seriesCountByMetricName":
[{"name":"etcd_request_duration_seconds_bucket","value":51840},
{"name":"apiserver_request_sli_duration_seconds_bucket","value":47718},
...
Additional resources
- See Setting a scrape sample limit for user-defined projects for details on how to set a scrape sample limit and create related alerting rules
6.5.3. Resolving the KubePersistentVolumeFillingUp alert firing for Prometheus
As a cluster administrator, you can resolve the KubePersistentVolumeFillingUp alert being triggered for Prometheus.
The critical alert fires when a persistent volume (PV) claimed by a prometheus-k8s-* pod in the openshift-monitoring project has less than 3% total space remaining. This can cause Prometheus to function abnormally.
There are two KubePersistentVolumeFillingUp alerts:
-
Critical alert: The alert with the
severity="critical"label is triggered when the mounted PV has less than 3% total space remaining. -
Warning alert: The alert with the
severity="warning"label is triggered when the mounted PV has less than 15% total space remaining and is expected to fill up within four days.
To address this issue, you can remove Prometheus time-series database (TSDB) blocks to create more space for the PV.
Prerequisites
-
You have access to the cluster as a user with the
dedicated-adminrole. -
You have installed the OpenShift CLI (
oc).
Procedure
List the size of all TSDB blocks, sorted from oldest to newest, by running the following command:
$ oc debug <prometheus_k8s_pod_name> -n openshift-monitoring \1
-c prometheus --image=$(oc get po -n openshift-monitoring <prometheus_k8s_pod_name> \2
-o jsonpath='{.spec.containers[?(@.name=="prometheus")].image}') \
-- sh -c 'cd /prometheus/;du -hs $(ls -dt */ | grep -Eo "[0-9|A-Z]{26}")'
Example output
308M    01HVKMPKQWZYWS8WVDAYQHNMW6
52M     01HVK64DTDA81799TBR9QDECEZ
102M    01HVK64DS7TRZRWF2756KHST5X
140M    01HVJS59K11FBVAPVY57K88Z11
90M     01HVH2A5Z58SKT810EM6B9AT50
152M    01HV8ZDVQMX41MKCN84S32RRZ1
354M    01HV6Q2N26BK63G4RYTST71FBF
156M    01HV664H9J9Z1FTZD73RD1563E
216M    01HTHXB60A7F239HN7S2TENPNS
104M    01HTHMGRXGS0WXA3WATRXHR36B
Identify which and how many blocks could be removed, then remove the blocks. The following example command removes the three oldest Prometheus TSDB blocks from the
prometheus-k8s-0pod:$ oc debug prometheus-k8s-0 -n openshift-monitoring \ -c prometheus --image=$(oc get po -n openshift-monitoring prometheus-k8s-0 \ -o jsonpath='{.spec.containers[?(@.name=="prometheus")].image}') \ -- sh -c 'ls -latr /prometheus/ | egrep -o "[0-9|A-Z]{26}" | head -3 | \ while read BLOCK; do rm -r /prometheus/$BLOCK; done'Verify the usage of the mounted PV and ensure there is enough space available by running the following command:
$ oc debug <prometheus_k8s_pod_name> -n openshift-monitoring \1
--image=$(oc get po -n openshift-monitoring <prometheus_k8s_pod_name> \2
-o jsonpath='{.spec.containers[?(@.name=="prometheus")].image}') -- df -h /prometheus/
The following example output shows the mounted PV claimed by the
prometheus-k8s-0pod that has 63% of space remaining:Example output
Starting pod/prometheus-k8s-0-debug-j82w4 ...
Filesystem      Size  Used Avail Use% Mounted on
/dev/nvme0n1p4  40G   15G  40G  37% /prometheus

Removing debug pod ...
6.6. Diagnosing OpenShift CLI (oc) issues
6.6.1. Understanding OpenShift CLI (oc) log levels
With the OpenShift CLI (oc), you can create applications and manage OpenShift Dedicated projects from a terminal.
If oc command-specific issues arise, increase the oc log level to output API request, API response, and curl request details generated by the command. This provides a granular view of a particular oc command’s underlying operation, which in turn might provide insight into the nature of a failure.
oc log levels range from 1 to 10. The following table provides a list of oc log levels, along with their descriptions.
Table 6.3. OpenShift CLI (oc) log levels
| Log level | Description |
|---|---|
| 1 to 5 | No additional logging to stderr. |
| 6 | Log API requests to stderr. |
| 7 | Log API requests and headers to stderr. |
| 8 | Log API requests, headers, and body, plus API response headers and body to stderr. |
| 9 |
Log API requests, headers, and body, API response headers and body, plus |
| 10 |
Log API requests, headers, and body, API response headers and body, plus |
6.6.2. Specifying OpenShift CLI (oc) log levels
You can investigate OpenShift CLI (oc) issues by increasing the command’s log level.
The OpenShift Dedicated user’s current session token is typically included in logged curl requests where required. You can also obtain the current user’s session token manually, for use when testing aspects of an oc command’s underlying process step-by-step.
Prerequisites
-
Install the OpenShift CLI (
oc).
Procedure
Specify the
oclog level when running anoccommand:$ oc <command> --loglevel <log_level>
where:
- <command>
- Specifies the command you are running.
- <log_level>
- Specifies the log level to apply to the command.
To obtain the current user’s session token, run the following command:
$ oc whoami -t
Example output
sha256~RCV3Qcn7H-OEfqCGVI0CvnZ6...
6.7. OpenShift Dedicated managed resources
6.7.1. Overview
The following covers all resources managed or protected by the Service Reliability Engineering Platform (SRE-P) Team. Customers should not attempt to modify these resources because doing so can lead to cluster instability.
6.7.2. Hive managed resources
The following list displays the OpenShift Dedicated resources managed by OpenShift Hive, the centralized fleet configuration management system. These resources are in addition to the OpenShift Container Platform resources created during installation. OpenShift Hive continually attempts to maintain consistency across all OpenShift Dedicated clusters. Changes to OpenShift Dedicated resources should be made through OpenShift Cluster Manager so that OpenShift Cluster Manager and Hive are synchronized. Contact ocm-feedback@redhat.com if OpenShift Cluster Manager does not support modifying the resources in question.
Example 6.1. List of Hive managed resources
Resources:
  ConfigMap:
  - namespace: openshift-config
    name: rosa-brand-logo
  - namespace: openshift-console
    name: custom-logo
  - namespace: openshift-deployment-validation-operator
    name: deployment-validation-operator-config
  - namespace: openshift-file-integrity
    name: fr-aide-conf
  - namespace: openshift-managed-upgrade-operator
    name: managed-upgrade-operator-config
  - namespace: openshift-monitoring
    name: cluster-monitoring-config
  - namespace: openshift-monitoring
    name: managed-namespaces
  - namespace: openshift-monitoring
    name: ocp-namespaces
  - namespace: openshift-monitoring
    name: osd-rebalance-infra-nodes
  - namespace: openshift-monitoring
    name: sre-dns-latency-exporter-code
  - namespace: openshift-monitoring
    name: sre-dns-latency-exporter-trusted-ca-bundle
  - namespace: openshift-monitoring
    name: sre-ebs-iops-reporter-code
  - namespace: openshift-monitoring
    name: sre-ebs-iops-reporter-trusted-ca-bundle
  - namespace: openshift-monitoring
    name: sre-stuck-ebs-vols-code
  - namespace: openshift-monitoring
    name: sre-stuck-ebs-vols-trusted-ca-bundle
  - namespace: openshift-security
    name: osd-audit-policy
  - namespace: openshift-validation-webhook
    name: webhook-cert
  - namespace: openshift
    name: motd
  Endpoints:
  - namespace: openshift-deployment-validation-operator
    name: deployment-validation-operator-metrics
  - namespace: openshift-monitoring
    name: sre-dns-latency-exporter
  - namespace: openshift-monitoring
    name: sre-ebs-iops-reporter
  - namespace: openshift-monitoring
    name: sre-stuck-ebs-vols
  - namespace: openshift-scanning
    name: loggerservice
  - namespace: openshift-security
    name: audit-exporter
  - namespace: openshift-validation-webhook
    name: validation-webhook
  Namespace:
  - name: dedicated-admin
  - name: openshift-addon-operator
  - name: openshift-aqua
  - name: openshift-aws-vpce-operator
  - name: openshift-backplane
  - name: openshift-backplane-cee
  - name: openshift-backplane-csa
  - name: openshift-backplane-cse
  - name: openshift-backplane-csm
  - name: openshift-backplane-managed-scripts
  - name: openshift-backplane-mobb
  - name: openshift-backplane-srep
  - name: openshift-backplane-tam
  - name: openshift-cloud-ingress-operator
  - name: openshift-codeready-workspaces
  - name: openshift-compliance
  - name: openshift-compliance-monkey
  - name: openshift-container-security
  - name: openshift-custom-domains-operator
  - name: openshift-customer-monitoring
  - name: openshift-deployment-validation-operator
  - name: openshift-managed-node-metadata-operator
  - name: openshift-file-integrity
  - name: openshift-logging
  - name: openshift-managed-upgrade-operator
  - name: openshift-must-gather-operator
  - name: openshift-observability-operator
  - name: openshift-ocm-agent-operator
  - name: openshift-operators-redhat
  - name: openshift-osd-metrics
  - name: openshift-rbac-permissions
  - name: openshift-route-monitor-operator
  - name: openshift-scanning
  - name: openshift-security
  - name: openshift-splunk-forwarder-operator
  - name: openshift-sre-pruning
  - name: openshift-suricata
  - name: openshift-validation-webhook
  - name: openshift-velero
  - name: openshift-monitoring
  - name: openshift
  - name: openshift-cluster-version
  - name: keycloak
  - name: goalert
  - name: configure-goalert-operator
  ReplicationController:
  - namespace: openshift-monitoring
    name: sre-ebs-iops-reporter-1
  - namespace: openshift-monitoring
    name: sre-stuck-ebs-vols-1
  Secret:
  - namespace: openshift-authentication
    name: v4-0-config-user-idp-0-file-data
  - namespace: openshift-authentication
    name: v4-0-config-user-template-error
  - namespace: openshift-authentication
    name: v4-0-config-user-template-login
  - namespace: openshift-authentication
    name: v4-0-config-user-template-provider-selection
  - namespace: openshift-config
    name: htpasswd-secret
  - namespace: openshift-config
    name: osd-oauth-templates-errors
  - namespace: openshift-config
    name: osd-oauth-templates-login
  - namespace: openshift-config
    name: osd-oauth-templates-providers
  - namespace: openshift-config
    name: rosa-oauth-templates-errors
  - namespace: openshift-config
    name: rosa-oauth-templates-login
  - namespace: openshift-config
    name: rosa-oauth-templates-providers
  - namespace: openshift-config
    name: support
  - namespace: openshift-config
    name: tony-devlab-primary-cert-bundle-secret
  - namespace: openshift-ingress
    name: tony-devlab-primary-cert-bundle-secret
  - namespace: openshift-kube-apiserver
    name: user-serving-cert-000
  - namespace: openshift-kube-apiserver
    name: user-serving-cert-001
  - namespace: openshift-monitoring
    name: dms-secret
  - namespace: openshift-monitoring
    name: observatorium-credentials
  - namespace: openshift-monitoring
    name: pd-secret
  - namespace: openshift-scanning
    name: clam-secrets
  - namespace: openshift-scanning
    name: logger-secrets
  - namespace: openshift-security
    name: splunk-auth
  ServiceAccount:
  - namespace: openshift-backplane-managed-scripts
    name: osd-backplane
  - namespace: openshift-backplane-srep
    name: 6804d07fb268b8285b023bcf65392f0e
  - namespace: openshift-backplane-srep
    name: osd-delete-ownerrefs-serviceaccounts
  - namespace: openshift-backplane
    name: osd-delete-backplane-serviceaccounts
  - namespace: openshift-cloud-ingress-operator
    name: cloud-ingress-operator
  - namespace: openshift-custom-domains-operator
    name: custom-domains-operator
  - namespace: openshift-managed-upgrade-operator
    name: managed-upgrade-operator
  - namespace: openshift-machine-api
    name: osd-disable-cpms
  - namespace: openshift-marketplace
    name: osd-patch-subscription-source
  - namespace: openshift-monitoring
    name: configure-alertmanager-operator
  - namespace: openshift-monitoring
    name: osd-cluster-ready
  - namespace: openshift-monitoring
    name: osd-rebalance-infra-nodes
  - namespace: openshift-monitoring
    name: sre-dns-latency-exporter
  - namespace: openshift-monitoring
    name: sre-ebs-iops-reporter
  - namespace: openshift-monitoring
    name: sre-stuck-ebs-vols
  - namespace: openshift-network-diagnostics
    name: sre-pod-network-connectivity-check-pruner
  - namespace: openshift-ocm-agent-operator
    name: ocm-agent-operator
  - namespace: openshift-rbac-permissions
    name: rbac-permissions-operator
  - namespace: openshift-splunk-forwarder-operator
    name: splunk-forwarder-operator
  - namespace: openshift-sre-pruning
    name: bz1980755
  - namespace: openshift-scanning
    name: logger-sa
  - namespace: openshift-scanning
    name: scanner-sa
  - namespace: openshift-sre-pruning
    name: sre-pruner-sa
  - namespace: openshift-suricata
    name: ids-test
  - namespace: openshift-suricata
    name: suricata-sa
  - namespace: openshift-validation-webhook
    name: validation-webhook
  - namespace: openshift-velero
    name: managed-velero-operator
  - namespace: openshift-velero
    name: velero
  - namespace: openshift-backplane-srep
    name: UNIQUE_BACKPLANE_SERVICEACCOUNT_ID
  Service:
  - namespace: openshift-deployment-validation-operator
    name: deployment-validation-operator-metrics
  - namespace: openshift-monitoring
    name: sre-dns-latency-exporter
  - namespace: openshift-monitoring
    name: sre-ebs-iops-reporter
  - namespace: openshift-monitoring
    name: sre-stuck-ebs-vols
  - namespace: openshift-scanning
    name: loggerservice
  - namespace: openshift-security
    name: audit-exporter
  - namespace: openshift-validation-webhook
    name: validation-webhook
  AddonOperator:
  - name: addon-operator
  ValidatingWebhookConfiguration:
  - name: sre-hiveownership-validation
  - name: sre-namespace-validation
  - name: sre-pod-validation
  - name: sre-prometheusrule-validation
  - name: sre-regular-user-validation
  - name: sre-scc-validation
  - name: sre-techpreviewnoupgrade-validation
  DaemonSet:
  - namespace: openshift-monitoring
    name: sre-dns-latency-exporter
  - namespace: openshift-scanning
    name: logger
  - namespace: openshift-scanning
    name: scanner
  - namespace: openshift-security
    name: audit-exporter
  - namespace: openshift-suricata
    name: suricata
  - namespace: openshift-validation-webhook
    name: validation-webhook
  DeploymentConfig:
  - namespace: openshift-monitoring
    name: sre-ebs-iops-reporter
  - namespace: openshift-monitoring
    name: sre-stuck-ebs-vols
  ClusterRoleBinding:
  - name: aqua-scanner-binding
  - name: backplane-cluster-admin
  - name: backplane-impersonate-cluster-admin
  - name: bz1980755
  - name: configure-alertmanager-operator-prom
  - name: dedicated-admins-cluster
  - name: dedicated-admins-registry-cas-cluster
  - name: logger-clusterrolebinding
  - name: openshift-backplane-managed-scripts-reader
  - name: osd-cluster-admin
  - name: osd-cluster-ready
  - name: osd-delete-backplane-script-resources
  - name: osd-delete-ownerrefs-serviceaccounts
  - name: osd-patch-subscription-source
  - name: osd-rebalance-infra-nodes
  - name: pcap-dedicated-admins
  - name: splunk-forwarder-operator
  - name: splunk-forwarder-operator-clusterrolebinding
  - name: sre-pod-network-connectivity-check-pruner
  - name: sre-pruner-buildsdeploys-pruning
  - name: velero
  - name: webhook-validation
  ClusterRole:
  - name: backplane-cee-readers-cluster
  - name: backplane-impersonate-cluster-admin
  - name: backplane-readers-cluster
  - name: backplane-srep-admins-cluster
  - name: backplane-srep-admins-project
  - name: bz1980755
  - name: dedicated-admins-aggregate-cluster
  - name: dedicated-admins-aggregate-project
  - name: dedicated-admins-cluster
  - name: dedicated-admins-manage-operators
  - name: dedicated-admins-project
  - name: dedicated-admins-registry-cas-cluster
  - name: dedicated-readers
  - name: image-scanner
  - name: logger-clusterrole
  - name: openshift-backplane-managed-scripts-reader
  - name: openshift-splunk-forwarder-operator
  - name: osd-cluster-ready
  - name: osd-custom-domains-dedicated-admin-cluster
  - name: osd-delete-backplane-script-resources
  - name: osd-delete-backplane-serviceaccounts
  - name: osd-delete-ownerrefs-serviceaccounts
  - name: osd-get-namespace
  - name: osd-netnamespaces-dedicated-admin-cluster
  - name: osd-patch-subscription-source
  - name: osd-readers-aggregate
  - name: osd-rebalance-infra-nodes
  - name: osd-rebalance-infra-nodes-openshift-pod-rebalance
  - name: pcap-dedicated-admins
  - name: splunk-forwarder-operator
  - name: sre-allow-read-machine-info
  - name: sre-pruner-buildsdeploys-cr
  - name: webhook-validation-cr
  RoleBinding:
  - namespace: kube-system
    name: cloud-ingress-operator-cluster-config-v1-reader
  - namespace: kube-system
    name: managed-velero-operator-cluster-config-v1-reader
  - namespace: openshift-aqua
    name: dedicated-admins-openshift-aqua
  - namespace: openshift-backplane-managed-scripts
    name: backplane-cee-mustgather
  - namespace: openshift-backplane-managed-scripts
    name: backplane-srep-mustgather
  - namespace: openshift-backplane-managed-scripts
    name: osd-delete-backplane-script-resources
  - namespace: openshift-cloud-ingress-operator
    name: osd-rebalance-infra-nodes-openshift-pod-rebalance
  - namespace: openshift-codeready-workspaces
    name: dedicated-admins-openshift-codeready-workspaces
  - namespace: openshift-config
    name: dedicated-admins-project-request
  - namespace: openshift-config
    name: dedicated-admins-registry-cas-project
  - namespace: openshift-config
    name: muo-pullsecret-reader
  - namespace: openshift-config
    name: oao-openshiftconfig-reader
  - namespace: openshift-config
    name: osd-cluster-ready
  - namespace: openshift-custom-domains-operator
    name: osd-rebalance-infra-nodes-openshift-pod-rebalance
  - namespace: openshift-customer-monitoring
    name: dedicated-admins-openshift-customer-monitoring
  - namespace: openshift-customer-monitoring
    name: prometheus-k8s-openshift-customer-monitoring
  - namespace: openshift-dns
    name: dedicated-admins-openshift-dns
  - namespace: openshift-dns
    name: osd-rebalance-infra-nodes-openshift-dns
  - namespace: openshift-image-registry
    name: osd-rebalance-infra-nodes-openshift-pod-rebalance
  - namespace: openshift-ingress-operator
    name: cloud-ingress-operator
  - namespace: openshift-ingress
    name: cloud-ingress-operator
  - namespace: openshift-kube-apiserver
    name: cloud-ingress-operator
  - namespace: openshift-machine-api
    name: cloud-ingress-operator
  - namespace: openshift-logging
    name: admin-dedicated-admins
  - namespace: openshift-logging
    name: admin-system:serviceaccounts:dedicated-admin
  - namespace: openshift-logging
    name: openshift-logging-dedicated-admins
  - namespace: openshift-logging
    name: openshift-logging:serviceaccounts:dedicated-admin
  - namespace: openshift-machine-api
    name: osd-cluster-ready
  - namespace: openshift-machine-api
    name: sre-ebs-iops-reporter-read-machine-info
  - namespace: openshift-machine-api
    name: sre-stuck-ebs-vols-read-machine-info
  - namespace: openshift-managed-node-metadata-operator
    name: osd-rebalance-infra-nodes-openshift-pod-rebalance
  - namespace: openshift-machine-api
    name: osd-disable-cpms
  - namespace: openshift-marketplace
    name: dedicated-admins-openshift-marketplace
  - namespace: openshift-monitoring
    name: backplane-cee
  - namespace: openshift-monitoring
    name: muo-monitoring-reader
  - namespace: openshift-monitoring
    name: oao-monitoring-manager
  - namespace: openshift-monitoring
    name: osd-cluster-ready
  - namespace: openshift-monitoring
    name: osd-rebalance-infra-nodes-openshift-monitoring
  - namespace: openshift-monitoring
    name: osd-rebalance-infra-nodes-openshift-pod-rebalance
  - namespace: openshift-monitoring
    name: sre-dns-latency-exporter
  - namespace: openshift-monitoring
    name: sre-ebs-iops-reporter
  - namespace: openshift-monitoring
    name: sre-stuck-ebs-vols
  - namespace: openshift-must-gather-operator
    name: backplane-cee-mustgather
  - namespace: openshift-must-gather-operator
    name: backplane-srep-mustgather
  - namespace: openshift-must-gather-operator
    name: osd-rebalance-infra-nodes-openshift-pod-rebalance
  - namespace: openshift-network-diagnostics
    name: sre-pod-network-connectivity-check-pruner
  - namespace: openshift-network-operator
    name: osd-rebalance-infra-nodes-openshift-pod-rebalance
  - namespace: openshift-ocm-agent-operator
    name: osd-rebalance-infra-nodes-openshift-pod-rebalance
  - namespace: openshift-operators-redhat
    name: admin-dedicated-admins
  - namespace: openshift-operators-redhat
    name: admin-system:serviceaccounts:dedicated-admin
  - namespace: openshift-operators-redhat
    name: openshift-operators-redhat-dedicated-admins
  - namespace: openshift-operators-redhat
    name: openshift-operators-redhat:serviceaccounts:dedicated-admin
  - namespace: openshift-operators
    name: dedicated-admins-openshift-operators
  - namespace: openshift-osd-metrics
    name: osd-rebalance-infra-nodes-openshift-pod-rebalance
  - namespace: openshift-osd-metrics
    name: prometheus-k8s
  - namespace: openshift-rbac-permissions
    name: osd-rebalance-infra-nodes-openshift-pod-rebalance
  - namespace: openshift-rbac-permissions
    name: prometheus-k8s
  - namespace: openshift-route-monitor-operator
    name: osd-rebalance-infra-nodes-openshift-pod-rebalance
  - namespace: openshift-scanning
    name: scanner-rolebinding
  - namespace: openshift-security
    name: osd-rebalance-infra-nodes-openshift-security
  - namespace: openshift-security
    name: prometheus-k8s
  - namespace: openshift-splunk-forwarder-operator
    name: osd-rebalance-infra-nodes-openshift-pod-rebalance
  - namespace: openshift-suricata
    name: suricata-rolebinding
  - namespace: openshift-user-workload-monitoring
    name: dedicated-admins-uwm-config-create
  - namespace: openshift-user-workload-monitoring
    name: dedicated-admins-uwm-config-edit
  - namespace: openshift-user-workload-monitoring
    name: dedicated-admins-uwm-managed-am-secret
  - namespace: openshift-user-workload-monitoring
    name: osd-rebalance-infra-nodes-openshift-user-workload-monitoring
  - namespace: openshift-velero
    name: osd-rebalance-infra-nodes-openshift-pod-rebalance
  - namespace: openshift-velero
    name: prometheus-k8s
  Role:
  - namespace: kube-system
    name: cluster-config-v1-reader
  - namespace: kube-system
    name: cluster-config-v1-reader-cio
  - namespace: openshift-aqua
    name: dedicated-admins-openshift-aqua
  - namespace: openshift-backplane-managed-scripts
    name: backplane-cee-pcap-collector
  - namespace: openshift-backplane-managed-scripts
    name: backplane-srep-pcap-collector
  - namespace: openshift-backplane-managed-scripts
    name: osd-delete-backplane-script-resources
  - namespace: openshift-codeready-workspaces
    name: dedicated-admins-openshift-codeready-workspaces
  - namespace: openshift-config
    name: dedicated-admins-project-request
  - namespace: openshift-config
    name: dedicated-admins-registry-cas-project
  - namespace: openshift-config
    name: muo-pullsecret-reader
  - namespace: openshift-config
    name: oao-openshiftconfig-reader
  - namespace: openshift-config
    name: osd-cluster-ready
  - namespace: openshift-customer-monitoring
    name: dedicated-admins-openshift-customer-monitoring
  - namespace: openshift-customer-monitoring
    name: prometheus-k8s-openshift-customer-monitoring
  - namespace: openshift-dns
    name: dedicated-admins-openshift-dns
  - namespace: openshift-dns
    name: osd-rebalance-infra-nodes-openshift-dns
  - namespace: openshift-ingress-operator
    name: cloud-ingress-operator
  - namespace: openshift-ingress
    name: cloud-ingress-operator
  - namespace: openshift-kube-apiserver
    name: cloud-ingress-operator
  - namespace: openshift-machine-api
    name: cloud-ingress-operator
  - namespace: openshift-logging
    name: dedicated-admins-openshift-logging
  - namespace: openshift-machine-api
    name: osd-cluster-ready
  - namespace: openshift-machine-api
    name: osd-disable-cpms
  - namespace: openshift-marketplace
    name: dedicated-admins-openshift-marketplace
  - namespace: openshift-monitoring
    name: backplane-cee
  - namespace: openshift-monitoring
    name: muo-monitoring-reader
  - namespace: openshift-monitoring
    name: oao-monitoring-manager
  - namespace: openshift-monitoring
    name: osd-cluster-ready
  - namespace: openshift-monitoring
    name: osd-rebalance-infra-nodes-openshift-monitoring
  - namespace: openshift-must-gather-operator
    name: backplane-cee-mustgather
  - namespace: openshift-must-gather-operator
    name: backplane-srep-mustgather
  - namespace: openshift-network-diagnostics
    name: sre-pod-network-connectivity-check-pruner
  - namespace: openshift-operators
    name: dedicated-admins-openshift-operators
  - namespace: openshift-osd-metrics
    name: prometheus-k8s
  - namespace: openshift-rbac-permissions
    name: prometheus-k8s
  - namespace: openshift-scanning
    name: scanner-role
  - namespace: openshift-security
    name: osd-rebalance-infra-nodes-openshift-security
  - namespace: openshift-security
    name: prometheus-k8s
  - namespace: openshift-suricata
    name: suricata-role
  - namespace: openshift-user-workload-monitoring
    name: dedicated-admins-user-workload-monitoring-create-cm
  - namespace: openshift-user-workload-monitoring
    name: dedicated-admins-user-workload-monitoring-manage-am-secret
  - namespace: openshift-user-workload-monitoring
    name: osd-rebalance-infra-nodes-openshift-user-workload-monitoring
  - namespace: openshift-velero
    name: prometheus-k8s
  CronJob:
  - namespace: openshift-backplane-managed-scripts
    name: osd-delete-backplane-script-resources
  - namespace: openshift-backplane-srep
    name: osd-delete-ownerrefs-serviceaccounts
  - namespace: openshift-backplane
    name: osd-delete-backplane-serviceaccounts
  - namespace: openshift-machine-api
    name: osd-disable-cpms
  - namespace: openshift-marketplace
    name: osd-patch-subscription-source
  - namespace: openshift-monitoring
    name: osd-rebalance-infra-nodes
  - namespace: openshift-network-diagnostics
    name: sre-pod-network-connectivity-check-pruner
  - namespace: openshift-sre-pruning
    name: builds-pruner
  - namespace: openshift-sre-pruning
    name: bz1980755
  - namespace: openshift-sre-pruning
    name: deployments-pruner
  - namespace: openshift-suricata
    name: ids-tester
  Job:
  - namespace: openshift-monitoring
    name: osd-cluster-ready
  CredentialsRequest:
  - namespace: openshift-cloud-ingress-operator
    name: cloud-ingress-operator-credentials-aws
  - namespace: openshift-cloud-ingress-operator
    name: cloud-ingress-operator-credentials-gcp
  - namespace: openshift-monitoring
    name: sre-ebs-iops-reporter-aws-credentials
  - namespace: openshift-monitoring
    name: sre-stuck-ebs-vols-aws-credentials
  - namespace: openshift-velero
    name: managed-velero-operator-iam-credentials-aws
  - namespace: openshift-velero
    name: managed-velero-operator-iam-credentials-gcp
  APIScheme:
  - namespace: openshift-cloud-ingress-operator
    name: rh-api
  PublishingStrategy:
  - namespace: openshift-cloud-ingress-operator
    name: publishingstrategy
  ScanSettingBinding:
  - namespace: openshift-compliance
    name: fedramp-high-ocp
  - namespace: openshift-compliance
    name: fedramp-high-rhcos
  ScanSetting:
  - namespace: openshift-compliance
    name: osd
  TailoredProfile:
  - namespace: openshift-compliance
    name: rhcos4-high-rosa
  OAuth:
  - name: cluster
  EndpointSlice:
  - namespace: openshift-deployment-validation-operator
    name: deployment-validation-operator-metrics-rhtwg
  - namespace: openshift-monitoring
    name: sre-dns-latency-exporter-4cw9r
  - namespace: openshift-monitoring
    name: sre-ebs-iops-reporter-6tx5g
  - namespace: openshift-monitoring
    name: sre-stuck-ebs-vols-gmdhs
  - namespace: openshift-scanning
    name: loggerservice-zprbq
  - namespace: openshift-security
    name: audit-exporter-nqfdk
  - namespace: openshift-validation-webhook
    name: validation-webhook-97b8t
  FileIntegrity:
  - namespace: openshift-file-integrity
    name: osd-fileintegrity
  MachineHealthCheck:
  - namespace: openshift-machine-api
    name: srep-infra-healthcheck
  - namespace: openshift-machine-api
    name: srep-metal-worker-healthcheck
  - namespace: openshift-machine-api
    name: srep-worker-healthcheck
  MachineSet:
  - namespace: openshift-machine-api
    name: sbasabat-mc-qhqkn-infra-us-east-1a
  - namespace: openshift-machine-api
    name: sbasabat-mc-qhqkn-worker-us-east-1a
  ContainerRuntimeConfig:
  - name: custom-crio
  KubeletConfig:
  - name: custom-kubelet
  MachineConfig:
  - name: 00-master-chrony
  - name: 00-worker-chrony
  SubjectPermission:
  - namespace: openshift-rbac-permissions
    name: backplane-cee
  - namespace: openshift-rbac-permissions
    name: backplane-csa
  - namespace: openshift-rbac-permissions
    name: backplane-cse
  - namespace: openshift-rbac-permissions
    name: backplane-csm
  - namespace: openshift-rbac-permissions
    name: backplane-mobb
  - namespace: openshift-rbac-permissions
    name: backplane-srep
  - namespace: openshift-rbac-permissions
    name: backplane-tam
  - namespace: openshift-rbac-permissions
    name: dedicated-admin-serviceaccounts
  - namespace: openshift-rbac-permissions
    name: dedicated-admin-serviceaccounts-core-ns
  - namespace: openshift-rbac-permissions
    name: dedicated-admins
  - namespace: openshift-rbac-permissions
    name: dedicated-admins-alert-routing-edit
  - namespace: openshift-rbac-permissions
    name: dedicated-admins-core-ns
  - namespace: openshift-rbac-permissions
    name: dedicated-admins-customer-monitoring
  - namespace: openshift-rbac-permissions
    name: osd-delete-backplane-serviceaccounts
  VeleroInstall:
  - namespace: openshift-velero
    name: cluster
  PrometheusRule:
  - namespace: openshift-monitoring
    name: rhmi-sre-cluster-admins
  - namespace: openshift-monitoring
    name: rhoam-sre-cluster-admins
  - namespace: openshift-monitoring
    name: sre-alertmanager-silences-active
  - namespace: openshift-monitoring
    name: sre-alerts-stuck-builds
  - namespace: openshift-monitoring
    name: sre-alerts-stuck-volumes
  - namespace: openshift-monitoring
    name: sre-cloud-ingress-operator-offline-alerts
  - namespace: openshift-monitoring
    name: sre-avo-pendingacceptance
  - namespace: openshift-monitoring
    name: sre-configure-alertmanager-operator-offline-alerts
  - namespace: openshift-monitoring
    name: sre-control-plane-resizing-alerts
  - namespace: openshift-monitoring
    name: sre-dns-alerts
  - namespace: openshift-monitoring
    name: sre-ebs-iops-burstbalance
  - namespace: openshift-monitoring
    name: sre-elasticsearch-jobs
  - namespace: openshift-monitoring
    name: sre-elasticsearch-managed-notification-alerts
  - namespace: openshift-monitoring
    name: sre-excessive-memory
  - namespace: openshift-monitoring
    name: sre-fr-alerts-low-disk-space
  - namespace: openshift-monitoring
    name: sre-haproxy-reload-fail
  - namespace: openshift-monitoring
    name: sre-internal-slo-recording-rules
  - namespace: openshift-monitoring
    name: sre-kubequotaexceeded
  - namespace: openshift-monitoring
    name: sre-leader-election-master-status-alerts
  - namespace: openshift-monitoring
    name: sre-managed-kube-apiserver-missing-on-node
  - namespace: openshift-monitoring
    name: sre-managed-kube-controller-manager-missing-on-node
  - namespace: openshift-monitoring
    name: sre-managed-kube-scheduler-missing-on-node
  - namespace: openshift-monitoring
    name: sre-managed-node-metadata-operator-alerts
  - namespace: openshift-monitoring
    name: sre-managed-notification-alerts
  - namespace: openshift-monitoring
    name: sre-managed-upgrade-operator-alerts
  - namespace: openshift-monitoring
    name: sre-managed-velero-operator-alerts
  - namespace: openshift-monitoring
    name: sre-node-unschedulable
  - namespace: openshift-monitoring
    name: sre-oauth-server
  - namespace: openshift-monitoring
    name: sre-pending-csr-alert
  - namespace: openshift-monitoring
    name: sre-proxy-managed-notification-alerts
  - namespace: openshift-monitoring
    name: sre-pruning
  - namespace: openshift-monitoring
    name: sre-pv
  - namespace: openshift-monitoring
    name: sre-router-health
  - namespace: openshift-monitoring
    name: sre-runaway-sdn-preventing-container-creation
  - namespace: openshift-monitoring
    name: sre-slo-recording-rules
  - namespace: openshift-monitoring
    name: sre-telemeter-client
  - namespace: openshift-monitoring
    name: sre-telemetry-managed-labels-recording-rules
  - namespace: openshift-monitoring
    name: sre-upgrade-send-managed-notification-alerts
  - namespace: openshift-monitoring
    name: sre-uptime-sla
  ServiceMonitor:
  - namespace: openshift-monitoring
    name: sre-dns-latency-exporter
  - namespace: openshift-monitoring
    name: sre-ebs-iops-reporter
  - namespace: openshift-monitoring
    name: sre-stuck-ebs-vols
  ClusterUrlMonitor:
  - namespace: openshift-route-monitor-operator
    name: api
  RouteMonitor:
  - namespace: openshift-route-monitor-operator
    name: console
  NetworkPolicy:
  - namespace: openshift-deployment-validation-operator
    name: allow-from-openshift-insights
  - namespace: openshift-deployment-validation-operator
    name: allow-from-openshift-olm
  ManagedNotification:
  - namespace: openshift-ocm-agent-operator
    name: sre-elasticsearch-managed-notifications
  - namespace: openshift-ocm-agent-operator
    name: sre-managed-notifications
  - namespace: openshift-ocm-agent-operator
    name: sre-proxy-managed-notifications
  - namespace: openshift-ocm-agent-operator
    name: sre-upgrade-managed-notifications
  OcmAgent:
  - namespace: openshift-ocm-agent-operator
    name: ocmagent
  - namespace: openshift-security
    name: audit-exporter
  Console:
  - name: cluster
  CatalogSource:
  - namespace: openshift-addon-operator
    name: addon-operator-catalog
  - namespace: openshift-cloud-ingress-operator
    name: cloud-ingress-operator-registry
  - namespace: openshift-compliance
    name: compliance-operator-registry
  - namespace: openshift-container-security
    name: container-security-operator-registry
  - namespace: openshift-custom-domains-operator
    name: custom-domains-operator-registry
  - namespace: openshift-deployment-validation-operator
    name: deployment-validation-operator-catalog
  - namespace: openshift-managed-node-metadata-operator
    name: managed-node-metadata-operator-registry
  - namespace: openshift-file-integrity
    name: file-integrity-operator-registry
  - namespace: openshift-managed-upgrade-operator
    name: managed-upgrade-operator-catalog
  - namespace: openshift-monitoring
    name: configure-alertmanager-operator-registry
  - namespace: openshift-must-gather-operator
    name: must-gather-operator-registry
  - namespace: openshift-observability-operator
    name: observability-operator-catalog
  - namespace: openshift-ocm-agent-operator
    name: ocm-agent-operator-registry
  - namespace: openshift-osd-metrics
    name: osd-metrics-exporter-registry
  - namespace: openshift-rbac-permissions
    name: rbac-permissions-operator-registry
  - namespace: openshift-route-monitor-operator
    name: route-monitor-operator-registry
  - namespace: openshift-splunk-forwarder-operator
    name: splunk-forwarder-operator-catalog
  - namespace: openshift-velero
    name: managed-velero-operator-registry
  OperatorGroup:
  - namespace: openshift-addon-operator
    name: addon-operator-og
  - namespace: openshift-aqua
    name: openshift-aqua
  - namespace: openshift-cloud-ingress-operator
    name: cloud-ingress-operator
  - namespace: openshift-codeready-workspaces
    name: openshift-codeready-workspaces
  - namespace: openshift-compliance
    name: compliance-operator
  - namespace: openshift-container-security
    name: container-security-operator
  - namespace: openshift-custom-domains-operator
    name: custom-domains-operator
  - namespace: openshift-customer-monitoring
    name: openshift-customer-monitoring
  - namespace: openshift-deployment-validation-operator
    name: deployment-validation-operator-og
  - namespace: openshift-managed-node-metadata-operator
    name: managed-node-metadata-operator
  - namespace: openshift-file-integrity
    name: file-integrity-operator
  - namespace: openshift-logging
    name: openshift-logging
  - namespace: openshift-managed-upgrade-operator
    name: managed-upgrade-operator-og
  - namespace: openshift-must-gather-operator
    name: must-gather-operator
  - namespace: openshift-observability-operator
    name: observability-operator-og
  - namespace: openshift-ocm-agent-operator
    name: ocm-agent-operator-og
  - namespace: openshift-osd-metrics
    name: osd-metrics-exporter
  - namespace: openshift-rbac-permissions
    name: rbac-permissions-operator
  - namespace: openshift-route-monitor-operator
    name: route-monitor-operator
  - namespace: openshift-splunk-forwarder-operator
    name: splunk-forwarder-operator-og
  - namespace: openshift-velero
    name: managed-velero-operator
  Subscription:
  - namespace: openshift-addon-operator
    name: addon-operator
  - namespace: openshift-cloud-ingress-operator
    name: cloud-ingress-operator
  - namespace: openshift-compliance
    name: compliance-operator-sub
  - namespace: openshift-container-security
    name: container-security-operator-sub
  - namespace: openshift-custom-domains-operator
    name: custom-domains-operator
  - namespace: openshift-deployment-validation-operator
    name: deployment-validation-operator
  - namespace: openshift-managed-node-metadata-operator
    name: managed-node-metadata-operator
  - namespace: openshift-file-integrity
    name: file-integrity-operator-sub
  - namespace: openshift-managed-upgrade-operator
    name: managed-upgrade-operator
  - namespace: openshift-monitoring
    name: configure-alertmanager-operator
  - namespace: openshift-must-gather-operator
    name: must-gather-operator
  - namespace: openshift-observability-operator
    name: observability-operator
  - namespace: openshift-ocm-agent-operator
    name: ocm-agent-operator
  - namespace: openshift-osd-metrics
    name: osd-metrics-exporter
  - namespace: openshift-rbac-permissions
    name: rbac-permissions-operator
  - namespace: openshift-route-monitor-operator
    name: route-monitor-operator
  - namespace: openshift-splunk-forwarder-operator
    name: openshift-splunk-forwarder-operator
  - namespace: openshift-velero
    name: managed-velero-operator
  PackageManifest:
  - namespace: openshift-splunk-forwarder-operator
    name: splunk-forwarder-operator
  - namespace: openshift-addon-operator
    name: addon-operator
  - namespace: openshift-rbac-permissions
    name: rbac-permissions-operator
  - namespace: openshift-cloud-ingress-operator
    name: cloud-ingress-operator
  - namespace: openshift-managed-node-metadata-operator
    name: managed-node-metadata-operator
  - namespace: openshift-velero
    name: managed-velero-operator
  - namespace: openshift-deployment-validation-operator
    name: managed-upgrade-operator
  - namespace: openshift-managed-upgrade-operator
    name: managed-upgrade-operator
  - namespace: openshift-container-security
    name: container-security-operator
  - namespace: openshift-route-monitor-operator
    name: route-monitor-operator
  - namespace: openshift-file-integrity
    name: file-integrity-operator
  - namespace: openshift-custom-domains-operator
    name: managed-node-metadata-operator
  - namespace: openshift-route-monitor-operator
    name: custom-domains-operator
  - namespace: openshift-managed-upgrade-operator
    name: managed-upgrade-operator
  - namespace: openshift-ocm-agent-operator
    name: ocm-agent-operator
  - namespace: openshift-observability-operator
    name: observability-operator
  - namespace: openshift-monitoring
    name: configure-alertmanager-operator
  - namespace: openshift-must-gather-operator
    name: deployment-validation-operator
  - namespace: openshift-osd-metrics
    name: osd-metrics-exporter
  - namespace: openshift-compliance
    name: compliance-operator
  - namespace: openshift-rbac-permissions
    name: rbac-permissions-operator
  Status:
  - {}
  Project:
  - name: dedicated-admin
  - name: openshift-addon-operator
  - name: openshift-aqua
  - name: openshift-backplane
  - name: openshift-backplane-cee
  - name: openshift-backplane-csa
  - name: openshift-backplane-cse
  - name: openshift-backplane-csm
  - name: openshift-backplane-managed-scripts
  - name: openshift-backplane-mobb
  - name: openshift-backplane-srep
  - name: openshift-backplane-tam
  - name: openshift-cloud-ingress-operator
  - name: openshift-codeready-workspaces
  - name: openshift-compliance
  - name: openshift-container-security
  - name: openshift-custom-domains-operator
  - name: openshift-customer-monitoring
  - name: openshift-deployment-validation-operator
  - name: openshift-managed-node-metadata-operator
  - name: openshift-file-integrity
  - name: openshift-logging
  - name: openshift-managed-upgrade-operator
  - name: openshift-must-gather-operator
  - name: openshift-observability-operator
  - name: openshift-ocm-agent-operator
  - name: openshift-operators-redhat
  - name: openshift-osd-metrics
  - name: openshift-rbac-permissions
  - name: openshift-route-monitor-operator
  - name: openshift-scanning
  - name: openshift-security
  - name: openshift-splunk-forwarder-operator
  - name: openshift-sre-pruning
  - name: openshift-suricata
  - name: openshift-validation-webhook
  - name: openshift-velero
  ClusterResourceQuota:
  - name: loadbalancer-quota
  - name: persistent-volume-quota
  SecurityContextConstraints:
  - name: osd-scanning-scc
  - name: osd-suricata-scc
  - name: pcap-dedicated-admins
  - name: splunkforwarder
  SplunkForwarder:
  - namespace: openshift-security
    name: splunkforwarder
  Group:
  - name: cluster-admins
  - name: dedicated-admins
  User:
  - name: backplane-cluster-admin
  Backup:
  - namespace: openshift-velero
    name: daily-full-backup-20221123112305
  - namespace: openshift-velero
    name: daily-full-backup-20221125042537
  - namespace: openshift-velero
    name: daily-full-backup-20221126010038
  - namespace: openshift-velero
    name: daily-full-backup-20221127010039
  - namespace: openshift-velero
    name: daily-full-backup-20221128010040
  - namespace: openshift-velero
    name: daily-full-backup-20221129050847
  - namespace: openshift-velero
    name: hourly-object-backup-20221128051740
  - namespace: openshift-velero
    name: hourly-object-backup-20221128061740
  - namespace: openshift-velero
    name: hourly-object-backup-20221128071740
  - namespace: openshift-velero
    name: hourly-object-backup-20221128081740
  - namespace: openshift-velero
    name: hourly-object-backup-20221128091740
  - namespace: openshift-velero
    name: hourly-object-backup-20221129050852
  - namespace: openshift-velero
    name: hourly-object-backup-20221129051747
  - namespace: openshift-velero
    name: weekly-full-backup-20221116184315
  - namespace: openshift-velero
    name: weekly-full-backup-20221121033854
  - namespace: openshift-velero
    name: weekly-full-backup-20221128020040
  Schedule:
  - namespace: openshift-velero
    name: daily-full-backup
  - namespace: openshift-velero
    name: hourly-object-backup
  - namespace: openshift-velero
    name: weekly-full-backup
6.7.3. OpenShift Dedicated add-on namespaces
OpenShift Dedicated add-ons are services available for installation after cluster installation. These additional services include Red Hat OpenShift Dev Spaces, Red Hat OpenShift API Management, and Cluster Logging Operator. Any changes to resources within the following namespaces can be overridden by the add-on during upgrades, which can lead to unsupported configurations for the add-on functionality.
Example 6.2. List of add-on managed namespaces
addon-namespaces:
  ocs-converged-dev: openshift-storage
  managed-api-service-internal: redhat-rhoami-operator
  codeready-workspaces-operator: codeready-workspaces-operator
  managed-odh: redhat-ods-operator
  codeready-workspaces-operator-qe: codeready-workspaces-operator-qe
  integreatly-operator: redhat-rhmi-operator
  nvidia-gpu-addon: redhat-nvidia-gpu-addon
  integreatly-operator-internal: redhat-rhmi-operator
  rhoams: redhat-rhoam-operator
  ocs-converged: openshift-storage
  addon-operator: redhat-addon-operator
  prow-operator: prow
  cluster-logging-operator: openshift-logging
  advanced-cluster-management: redhat-open-cluster-management
  cert-manager-operator: redhat-cert-manager-operator
  dba-operator: addon-dba-operator
  reference-addon: redhat-reference-addon
  ocm-addon-test-operator: redhat-ocm-addon-test-operator
6.7.4. OpenShift Dedicated validating webhooks
OpenShift Dedicated validating webhooks are a set of dynamic admission controls maintained by the OpenShift SRE team. These HTTP callbacks, also known as webhooks, are called for various types of requests to ensure cluster stability. The following list describes the various webhooks with rules containing the registered operations and resources that are controlled. Any attempt to circumvent these validating webhooks could affect the stability and supportability of the cluster.
Example 6.3. List of validating webhooks
[
  {
    "webhookName": "clusterlogging-validation",
    "rules": [
      {
        "operations": [
          "CREATE",
          "UPDATE"
        ],
        "apiGroups": [
          "logging.openshift.io"
        ],
        "apiVersions": [
          "v1"
        ],
        "resources": [
          "clusterloggings"
        ],
        "scope": "Namespaced"
      }
    ],
    "documentString": "Managed OpenShift Customers may set log retention outside the allowed range of 0-7 days"
  },
  {
    "webhookName": "clusterrolebindings-validation",
    "rules": [
      {
        "operations": [
          "DELETE"
        ],
        "apiGroups": [
          "rbac.authorization.k8s.io"
        ],
        "apiVersions": [
          "v1"
        ],
        "resources": [
          "clusterrolebindings"
        ],
        "scope": "Cluster"
      }
    ],
    "documentString": "Managed OpenShift Customers may not delete the cluster role bindings under the managed namespaces: (^openshift-.*|kube-system)"
  },
  {
    "webhookName": "customresourcedefinitions-validation",
    "rules": [
      {
        "operations": [
          "CREATE",
          "UPDATE",
          "DELETE"
        ],
        "apiGroups": [
          "apiextensions.k8s.io"
        ],
        "apiVersions": [
          "*"
        ],
        "resources": [
          "customresourcedefinitions"
        ],
        "scope": "Cluster"
      }
    ],
    "documentString": "Managed OpenShift Customers may not change CustomResourceDefinitions managed by Red Hat."
  },
  {
    "webhookName": "hiveownership-validation",
    "rules": [
      {
        "operations": [
          "UPDATE",
          "DELETE"
        ],
        "apiGroups": [
          "quota.openshift.io"
        ],
        "apiVersions": [
          "*"
        ],
        "resources": [
          "clusterresourcequotas"
        ],
        "scope": "Cluster"
      }
    ],
    "webhookObjectSelector": {
      "matchLabels": {
        "hive.openshift.io/managed": "true"
      }
    },
    "documentString": "Managed OpenShift customers may not edit certain managed resources. A managed resource has a \"hive.openshift.io/managed\": \"true\" label."
  },
  {
    "webhookName": "imagecontentpolicies-validation",
    "rules": [
      {
        "operations": [
          "CREATE",
          "UPDATE"
        ],
        "apiGroups": [
          "config.openshift.io"
        ],
        "apiVersions": [
          "*"
        ],
        "resources": [
          "imagedigestmirrorsets",
          "imagetagmirrorsets"
        ],
        "scope": "Cluster"
      },
      {
        "operations": [
          "CREATE",
          "UPDATE"
        ],
        "apiGroups": [
          "operator.openshift.io"
        ],
        "apiVersions": [
          "*"
        ],
        "resources": [
          "imagecontentsourcepolicies"
        ],
        "scope": "Cluster"
      }
    ],
    "documentString": "Managed OpenShift customers may not create ImageContentSourcePolicy, ImageDigestMirrorSet, or ImageTagMirrorSet resources that configure mirrors that would conflict with system registries (e.g. quay.io, registry.redhat.io, registry.access.redhat.com, etc). For more details, see https://docs.openshift.com/"
  },
  {
    "webhookName": "ingress-config-validation",
    "rules": [
      {
        "operations": [
          "CREATE",
          "UPDATE",
          "DELETE"
        ],
        "apiGroups": [
          "config.openshift.io"
        ],
        "apiVersions": [
          "*"
        ],
        "resources": [
          "ingresses"
        ],
        "scope": "Cluster"
      }
    ],
    "documentString": "Managed OpenShift customers may not modify ingress config resources because it can can degrade cluster operators and can interfere with OpenShift SRE monitoring."
  },
  {
    "webhookName": "ingresscontroller-validation",
    "rules": [
      {
        "operations": [
          "CREATE",
          "UPDATE"
        ],
        "apiGroups": [
          "operator.openshift.io"
        ],
        "apiVersions": [
          "*"
        ],
        "resources": [
          "ingresscontroller",
          "ingresscontrollers"
        ],
        "scope": "Namespaced"
      }
    ],
    "documentString": "Managed OpenShift Customer may create IngressControllers without necessary taints. This can cause those workloads to be provisioned on infra or master nodes."
  },
  {
    "webhookName": "namespace-validation",
    "rules": [
      {
        "operations": [
          "CREATE",
          "UPDATE",
          "DELETE"
        ],
        "apiGroups": [
          ""
        ],
        "apiVersions": [
          "*"
        ],
        "resources": [
          "namespaces"
        ],
        "scope": "Cluster"
      }
    ],
    "documentString": "Managed OpenShift Customers may not modify namespaces specified in the [openshift-monitoring/managed-namespaces openshift-monitoring/ocp-namespaces] ConfigMaps because customer workloads should be placed in customer-created namespaces. Customers may not create namespaces identified by this regular expression (^com$|^io$|^in$) because it could interfere with critical DNS resolution. Additionally, customers may not set or change the values of these Namespace labels [managed.openshift.io/storage-pv-quota-exempt managed.openshift.io/service-lb-quota-exempt]."
  },
  {
    "webhookName": "networkpolicies-validation",
    "rules": [
      {
        "operations": [
          "CREATE",
          "UPDATE",
          "DELETE"
        ],
        "apiGroups": [
          "networking.k8s.io"
        ],
        "apiVersions": [
          "*"
        ],
        "resources": [
          "networkpolicies"
        ],
        "scope": "Namespaced"
      }
    ],
    "documentString": "Managed OpenShift Customers may not create NetworkPolicies in namespaces managed by Red Hat."
  },
  {
    "webhookName": "node-validation-osd",
    "rules": [
      {
        "operations": [
          "CREATE",
          "UPDATE",
          "DELETE"
        ],
        "apiGroups": [
          ""
        ],
        "apiVersions": [
          "*"
        ],
        "resources": [
          "nodes",
          "nodes/*"
        ],
        "scope": "*"
      }
    ],
    "documentString": "Managed OpenShift customers may not alter Node objects."
  },
  {
    "webhookName": "pod-validation",
    "rules": [
      {
        "operations": [
          "*"
        ],
        "apiGroups": [
          "v1"
        ],
        "apiVersions": [
          "*"
        ],
        "resources": [
          "pods"
        ],
        "scope": "Namespaced"
      }
    ],
    "documentString": "Managed OpenShift Customers may use tolerations on Pods that could cause those Pods to be scheduled on infra or master nodes."
  },
  {
    "webhookName": "prometheusrule-validation",
    "rules": [
      {
        "operations": [
          "CREATE",
          "UPDATE",
          "DELETE"
        ],
        "apiGroups": [
          "monitoring.coreos.com"
        ],
        "apiVersions": [
          "*"
        ],
        "resources": [
          "prometheusrules"
        ],
        "scope": "Namespaced"
      }
    ],
    "documentString": "Managed OpenShift Customers may not create PrometheusRule in namespaces managed by Red Hat."
  },
  {
    "webhookName": "regular-user-validation",
    "rules": [
      {
        "operations": [
          "*"
        ],
        "apiGroups": [
          "cloudcredential.openshift.io",
          "machine.openshift.io",
          "admissionregistration.k8s.io",
          "addons.managed.openshift.io",
          "cloudingress.managed.openshift.io",
          "managed.openshift.io",
          "ocmagent.managed.openshift.io",
          "splunkforwarder.managed.openshift.io",
          "upgrade.managed.openshift.io"
        ],
        "apiVersions": [
          "*"
        ],
        "resources": [
          "*/*"
        ],
        "scope": "*"
      },
      {
        "operations": [
          "*"
        ],
        "apiGroups": [
          "autoscaling.openshift.io"
        ],
        "apiVersions": [
          "*"
        ],
        "resources": [
          "clusterautoscalers",
          "machineautoscalers"
        ],
        "scope": "*"
      },
      {
        "operations": [
          "*"
        ],
        "apiGroups": [
          "config.openshift.io"
        ],
        "apiVersions": [
          "*"
        ],
        "resources": [
          "clusterversions",
          "clusterversions/status",
          "schedulers",
          "apiservers",
          "proxies"
        ],
        "scope": "*"
      },
      {
        "operations": [
          "CREATE",
          "UPDATE",
          "DELETE"
        ],
        "apiGroups": [
          ""
        ],
        "apiVersions": [
          "*"
        ],
        "resources": [
          "configmaps"
        ],
        "scope": "*"
      },
      {
        "operations": [
          "*"
        ],
        "apiGroups": [
          "machineconfiguration.openshift.io"
        ],
        "apiVersions": [
          "*"
        ],
        "resources": [
          "machineconfigs",
          "machineconfigpools"
        ],
        "scope": "*"
      },
      {
        "operations": [
          "*"
        ],
        "apiGroups": [
          "operator.openshift.io"
        ],
        "apiVersions": [
          "*"
        ],
        "resources": [
          "kubeapiservers",
          "openshiftapiservers"
        ],
        "scope": "*"
      },
      {
        "operations": [
          "*"
        ],
        "apiGroups": [
          "managed.openshift.io"
        ],
        "apiVersions": [
          "*"
        ],
        "resources": [
          "subjectpermissions",
          "subjectpermissions/*"
        ],
        "scope": "*"
      },
      {
        "operations": [
          "*"
        ],
        "apiGroups": [
          "network.openshift.io"
        ],
        "apiVersions": [
          "*"
        ],
        "resources": [
          "netnamespaces",
          "netnamespaces/*"
        ],
        "scope": "*"
      }
    ],
    "documentString": "Managed OpenShift customers may not manage any objects in the following APIGroups [autoscaling.openshift.io network.openshift.io machine.openshift.io admissionregistration.k8s.io addons.managed.openshift.io cloudingress.managed.openshift.io splunkforwarder.managed.openshift.io upgrade.managed.openshift.io managed.openshift.io ocmagent.managed.openshift.io config.openshift.io machineconfiguration.openshift.io operator.openshift.io cloudcredential.openshift.io], nor may Managed OpenShift customers alter the APIServer, KubeAPIServer, OpenShiftAPIServer, ClusterVersion, Proxy or SubjectPermission objects."
  },
  {
    "webhookName": "scc-validation",
    "rules": [
      {
        "operations": [
          "UPDATE",
          "DELETE"
        ],
        "apiGroups": [
          "security.openshift.io"
        ],
        "apiVersions": [
          "*"
        ],
        "resources": [
          "securitycontextconstraints"
        ],
        "scope": "Cluster"
      }
    ],
    "documentString": "Managed OpenShift Customers may not modify the following default SCCs: [anyuid hostaccess hostmount-anyuid hostnetwork hostnetwork-v2 node-exporter nonroot nonroot-v2 privileged restricted restricted-v2]"
  },
  {
    "webhookName": "sdn-migration-validation",
    "rules": [
      {
        "operations": [
          "UPDATE"
        ],
        "apiGroups": [
          "config.openshift.io"
        ],
        "apiVersions": [
          "*"
        ],
        "resources": [
          "networks"
        ],
        "scope": "Cluster"
      }
    ],
    "documentString": "Managed OpenShift customers may not modify the network config type because it can can degrade cluster operators and can interfere with OpenShift SRE monitoring."
  },
  {
    "webhookName": "service-mutation",
    "rules": [
      {
        "operations": [
          "CREATE",
          "UPDATE"
        ],
        "apiGroups": [
          ""
        ],
        "apiVersions": [
          "v1"
        ],
        "resources": [
          "services"
        ],
        "scope": "Namespaced"
      }
    ],
    "documentString": "LoadBalancer-type services on Managed OpenShift clusters must contain an additional annotation for managed policy compliance."
  },
  {
    "webhookName": "serviceaccount-validation",
    "rules": [
      {
        "operations": [
          "DELETE"
        ],
        "apiGroups": [
          ""
        ],
        "apiVersions": [
          "v1"
        ],
        "resources": [
          "serviceaccounts"
        ],
        "scope": "Namespaced"
      }
    ],
    "documentString": "Managed OpenShift Customers may not delete the service accounts under the managed namespaces。"
  },
  {
    "webhookName": "techpreviewnoupgrade-validation",
    "rules": [
      {
        "operations": [
          "CREATE",
          "UPDATE"
        ],
        "apiGroups": [
          "config.openshift.io"
        ],
        "apiVersions": [
          "*"
        ],
        "resources": [
          "featuregates"
        ],
        "scope": "Cluster"
      }
    ],
    "documentString": "Managed OpenShift Customers may not use TechPreviewNoUpgrade FeatureGate that could prevent any future ability to do a y-stream upgrade to their clusters."
  }
]