Chapter 7. Monitor
7.1. Using OpenShift Logging with OpenShift Serverless
7.1.1. About deploying cluster logging
OpenShift Container Platform cluster administrators can deploy cluster logging using the OpenShift Container Platform web console or CLI to install the Elasticsearch Operator and Cluster Logging Operator. When the operators are installed, you create a ClusterLogging custom resource (CR) to schedule cluster logging pods and other resources necessary to support cluster logging. The operators are responsible for deploying, upgrading, and maintaining cluster logging.
The ClusterLogging CR defines a complete cluster logging environment that includes all the components of the logging stack to collect, store and visualize logs. The Cluster Logging Operator watches the Cluster Logging CR and adjusts the logging deployment accordingly.
Administrators and application developers can view the logs of the projects for which they have view access.
7.1.2. About deploying and configuring cluster logging
OpenShift Container Platform cluster logging is designed to be used with the default configuration, which is tuned for small to medium sized OpenShift Container Platform clusters.
The installation instructions that follow include a sample ClusterLogging custom resource (CR), which you can use to create a cluster logging instance and configure your cluster logging environment.
If you want to use the default cluster logging install, you can use the sample CR directly.
If you want to customize your deployment, make changes to the sample CR as needed. The following describes the configurations you can make when installing your cluster logging instance or modify after installation. See the Configuring sections for more information on working with each component, including modifications you can make outside of the ClusterLogging custom resource.
7.1.2.1. Configuring and Tuning Cluster Logging
You can configure your cluster logging environment by modifying the ClusterLogging custom resource deployed in the openshift-logging project.
You can modify any of the following components upon install or after install:
- Memory and CPU
-
You can adjust both the CPU and memory limits for each component by modifying the
resourcesblock with valid memory and CPU values:
spec:
  logStore:
    elasticsearch:
      resources:
        limits:
          cpu:
          memory: 16Gi
        requests:
          cpu: 500m
          memory: 16Gi
      type: "elasticsearch"
  collection:
    logs:
      fluentd:
        resources:
          limits:
            cpu:
            memory:
          requests:
            cpu:
            memory:
        type: "fluentd"
  visualization:
    kibana:
      resources:
        limits:
          cpu:
          memory:
        requests:
          cpu:
          memory:
     type: kibana
  curation:
    curator:
      resources:
        limits:
          memory: 200Mi
        requests:
          cpu: 200m
          memory: 200Mi
type: "curator"- Elasticsearch storage
-
You can configure a persistent storage class and size for the Elasticsearch cluster using the
storageClassnameandsizeparameters. The Cluster Logging Operator creates a persistent volume claim (PVC) for each data node in the Elasticsearch cluster based on these parameters.
  spec:
    logStore:
      type: "elasticsearch"
      elasticsearch:
        nodeCount: 3
        storage:
          storageClassName: "gp2"
          size: "200G"
This example specifies each data node in the cluster will be bound to a PVC that requests "200G" of "gp2" storage. Each primary shard will be backed by a single replica.
Omitting the storage block results in a deployment that includes ephemeral storage only.
  spec:
    logStore:
      type: "elasticsearch"
      elasticsearch:
        nodeCount: 3
storage: {}- Elasticsearch replication policy
You can set the policy that defines how Elasticsearch shards are replicated across data nodes in the cluster:
-
FullRedundancy. The shards for each index are fully replicated to every data node. -
MultipleRedundancy. The shards for each index are spread over half of the data nodes. -
SingleRedundancy. A single copy of each shard. Logs are always available and recoverable as long as at least two data nodes exist. -
ZeroRedundancy. No copies of any shards. Logs may be unavailable (or lost) in the event a node is down or fails.
-
- Curator schedule
- You specify the schedule for Curator in the cron format.
  spec:
    curation:
    type: "curator"
    resources:
    curator:
      schedule: "30 3 * * *"
7.1.2.2. Sample modified ClusterLogging custom resource
The following is an example of a ClusterLogging custom resource modified using the options previously described.
Sample modified ClusterLogging custom resource
apiVersion: "logging.openshift.io/v1"
kind: "ClusterLogging"
metadata:
  name: "instance"
  namespace: "openshift-logging"
spec:
  managementState: "Managed"
  logStore:
    type: "elasticsearch"
    retentionPolicy:
      application:
        maxAge: 1d
      infra:
        maxAge: 7d
      audit:
        maxAge: 7d
    elasticsearch:
      nodeCount: 3
      resources:
        limits:
          memory: 32Gi
        requests:
          cpu: 3
          memory: 32Gi
        storage:
          storageClassName: "gp2"
          size: "200G"
      redundancyPolicy: "SingleRedundancy"
  visualization:
    type: "kibana"
    kibana:
      resources:
        limits:
          memory: 1Gi
        requests:
          cpu: 500m
          memory: 1Gi
      replicas: 1
  curation:
    type: "curator"
    curator:
      resources:
        limits:
          memory: 200Mi
        requests:
          cpu: 200m
          memory: 200Mi
      schedule: "*/5 * * * *"
  collection:
    logs:
      type: "fluentd"
      fluentd:
        resources:
          limits:
            memory: 1Gi
          requests:
            cpu: 200m
            memory: 1Gi
7.1.3. Using cluster logging to find logs for Knative Serving components
Prerequisites
-
Install the OpenShift CLI (
oc).
Procedure
Get the Kibana route:
$ oc -n openshift-logging get route kibana
- Use the route’s URL to navigate to the Kibana dashboard and log in.
- Check that the index is set to .all. If the index is not set to .all, only the OpenShift Container Platform system logs will be listed.
-
Filter the logs by using the
knative-servingnamespace. Enterkubernetes.namespace_name:knative-servingin the search box to filter results.
Knative Serving uses structured logging by default. You can enable the parsing of these logs by customizing the cluster logging Fluentd settings. This makes the logs more searchable and enables filtering on the log level to quickly identify issues.
7.1.4. Using cluster logging to find logs for services deployed with Knative Serving
With OpenShift Cluster Logging, the logs that your applications write to the console are collected in Elasticsearch. The following procedure outlines how to apply these capabilities to applications deployed by using Knative Serving.
Prerequisites
-
Install the OpenShift CLI (
oc).
Procedure
Get the Kibana route:
$ oc -n openshift-logging get route kibana
- Use the route’s URL to navigate to the Kibana dashboard and log in.
- Check that the index is set to .all. If the index is not set to .all, only the OpenShift system logs will be listed.
Filter the logs by using the
knative-servingnamespace. Enter a filter for the service in the search box to filter results.Example filter
kubernetes.namespace_name:default AND kubernetes.labels.serving_knative_dev\/service:{service_name}You can also filter by using
/configurationor/revision.-
Narrow your search by using
kubernetes.container_name:<user_container>to only display the logs generated by your application. Otherwise, you will see logs from the queue-proxy.
Use JSON-based structured logging in your application to allow for the quick filtering of these logs in production environments.
7.2. Serverless developer metrics
Metrics enable developers to monitor how Knative services are performing. You can use the OpenShift Container Platform monitoring stack to record and view health checks and metrics for your Knative services.
You can view different metrics for OpenShift Serverless by navigating to Dashboards in the OpenShift Container Platform web console Developer perspective.
If Service Mesh is enabled with mTLS, metrics for Knative Serving are disabled by default because Service Mesh prevents Prometheus from scraping metrics.
For information about resolving this issue, see Enabling Knative Serving metrics when using Service Mesh with mTLS.
Scraping the metrics does not affect autoscaling of a Knative service, because scraping requests do not go through the activator. Consequently, no scraping takes place if no pods are running.
7.2.1. Knative service metrics exposed by default
Table 7.1. Metrics exposed by default for each Knative service on port 9090
| Metric name, unit, and type | Description | Metric tags |
|---|---|---|
|
Metric unit: dimensionless Metric type: gauge | Number of requests per second that hit the queue proxy.
Formula:
| destination_configuration="event-display", destination_namespace="pingsource1", destination_pod="event-display-00001-deployment-6b455479cb-75p6w", destination_revision="event-display-00001" |
|
Metric unit: dimensionless Metric type: gauge | Number of proxied requests per second.
Formula:
| |
|
Metric unit: dimensionless Metric type: gauge | Number of requests currently being handled by this pod.
Average concurrency is calculated at the networking
| destination_configuration="event-display", destination_namespace="pingsource1", destination_pod="event-display-00001-deployment-6b455479cb-75p6w", destination_revision="event-display-00001" |
|
Metric unit: dimensionless Metric type: gauge | Number of proxied requests currently being handled by this pod:
| destination_configuration="event-display", destination_namespace="pingsource1", destination_pod="event-display-00001-deployment-6b455479cb-75p6w", destination_revision="event-display-00001" |
|
Metric unit: seconds Metric type: gauge | The number of seconds that the process has been up. | destination_configuration="event-display", destination_namespace="pingsource1", destination_pod="event-display-00001-deployment-6b455479cb-75p6w", destination_revision="event-display-00001" |
Table 7.2. Metrics exposed by default for each Knative service on port 9091
| Metric name, unit, and type | Description | Metric tags |
|---|---|---|
|
Metric unit: dimensionless Metric type: counter |
The number of requests that are routed to | configuration_name="event-display", container_name="queue-proxy", namespace_name="apiserversource1", pod_name="event-display-00001-deployment-658fd4f9cf-qcnr5", response_code="200", response_code_class="2xx", revision_name="event-display-00001", service_name="event-display" |
|
Metric unit: milliseconds Metric type: histogram | The response time in milliseconds. | configuration_name="event-display", container_name="queue-proxy", namespace_name="apiserversource1", pod_name="event-display-00001-deployment-658fd4f9cf-qcnr5", response_code="200", response_code_class="2xx", revision_name="event-display-00001", service_name="event-display" |
|
Metric unit: dimensionless Metric type: gauge |
The current number of items in the serving and waiting queue, or not reported if unlimited concurrency. | configuration_name="event-display", container_name="queue-proxy", namespace_name="apiserversource1", pod_name="event-display-00001-deployment-658fd4f9cf-qcnr5", response_code="200", response_code_class="2xx", revision_name="event-display-00001", service_name="event-display" |
7.2.2. Knative service with custom application metrics
You can extend the set of metrics exported by a Knative service. The exact implementation depends on your application and the language used.
The following listing implements a sample Go application that exports the count of processed events custom metric.
package main

import (
  "fmt"
  "log"
  "net/http"
  "os"

  "github.com/prometheus/client_golang/prometheus" 1
  "github.com/prometheus/client_golang/prometheus/promauto"
  "github.com/prometheus/client_golang/prometheus/promhttp"
)

var (
  opsProcessed = promauto.NewCounter(prometheus.CounterOpts{ 2
     Name: "myapp_processed_ops_total",
     Help: "The total number of processed events",
  })
)


func handler(w http.ResponseWriter, r *http.Request) {
  log.Print("helloworld: received a request")
  target := os.Getenv("TARGET")
  if target == "" {
     target = "World"
  }
  fmt.Fprintf(w, "Hello %s!\n", target)
  opsProcessed.Inc() 3
}

func main() {
  log.Print("helloworld: starting server...")

  port := os.Getenv("PORT")
  if port == "" {
     port = "8080"
  }

  http.HandleFunc("/", handler)

  // Separate server for metrics requests
  go func() { 4
     mux := http.NewServeMux()
     server := &http.Server{
        Addr: fmt.Sprintf(":%s", "9095"),
        Handler: mux,
     }
     mux.Handle("/metrics", promhttp.Handler())
     log.Printf("prometheus: listening on port %s", 9095)
     log.Fatal(server.ListenAndServe())
  }()

   // Use same port as normal requests for metrics
  //http.Handle("/metrics", promhttp.Handler()) 5
  log.Printf("helloworld: listening on port %s", port)
  log.Fatal(http.ListenAndServe(fmt.Sprintf(":%s", port), nil))
}
7.2.3. Configuration for scraping custom metrics
Custom metrics scraping is performed by an instance of Prometheus purposed for user workload monitoring. After you enable user workload monitoring and create the application, you need a configuration that defines how the monitoring stack will scrape the metrics.
The following sample configuration defines the ksvc for your application and configures the service monitor. The exact configuration depends on your application and how it exports the metrics.
apiVersion: serving.knative.dev/v1 1
kind: Service
metadata:
  name: helloworld-go
spec:
  template:
    metadata:
      labels:
        app: helloworld-go
      annotations:
    spec:
      containers:
      - image: docker.io/skonto/helloworld-go:metrics
        resources:
          requests:
            cpu: "200m"
        env:
        - name: TARGET
          value: "Go Sample v1"
---
apiVersion: monitoring.coreos.com/v1 2
kind: ServiceMonitor
metadata:
  labels:
  name: helloworld-go-sm
spec:
  endpoints:
  - port: queue-proxy-metrics
    scheme: http
  - port: app-metrics
    scheme: http
  namespaceSelector: {}
  selector:
    matchLabels:
       name:  helloworld-go-sm
---
apiVersion: v1 3
kind: Service
metadata:
  labels:
    name:  helloworld-go-sm
  name:  helloworld-go-sm
spec:
  ports:
  - name: queue-proxy-metrics
    port: 9091
    protocol: TCP
    targetPort: 9091
  - name: app-metrics
    port: 9095
    protocol: TCP
    targetPort: 9095
  selector:
    serving.knative.dev/service: helloworld-go
  type: ClusterIP
7.2.4. Examining metrics of a service
After you have configured the application to export the metrics and the monitoring stack to scrape them, you can examine the metrics in the web console.
Prerequisites
- You have logged in to the OpenShift Container Platform web console.
- You have installed the OpenShift Serverless Operator and Knative Serving.
Procedure
Optional: Run requests against your application that you will be able to see in the metrics:
$ hello_route=$(oc get ksvc helloworld-go -n ns1 -o jsonpath='{.status.url}') && \
    curl $hello_route
Example output
Hello Go Sample v1!
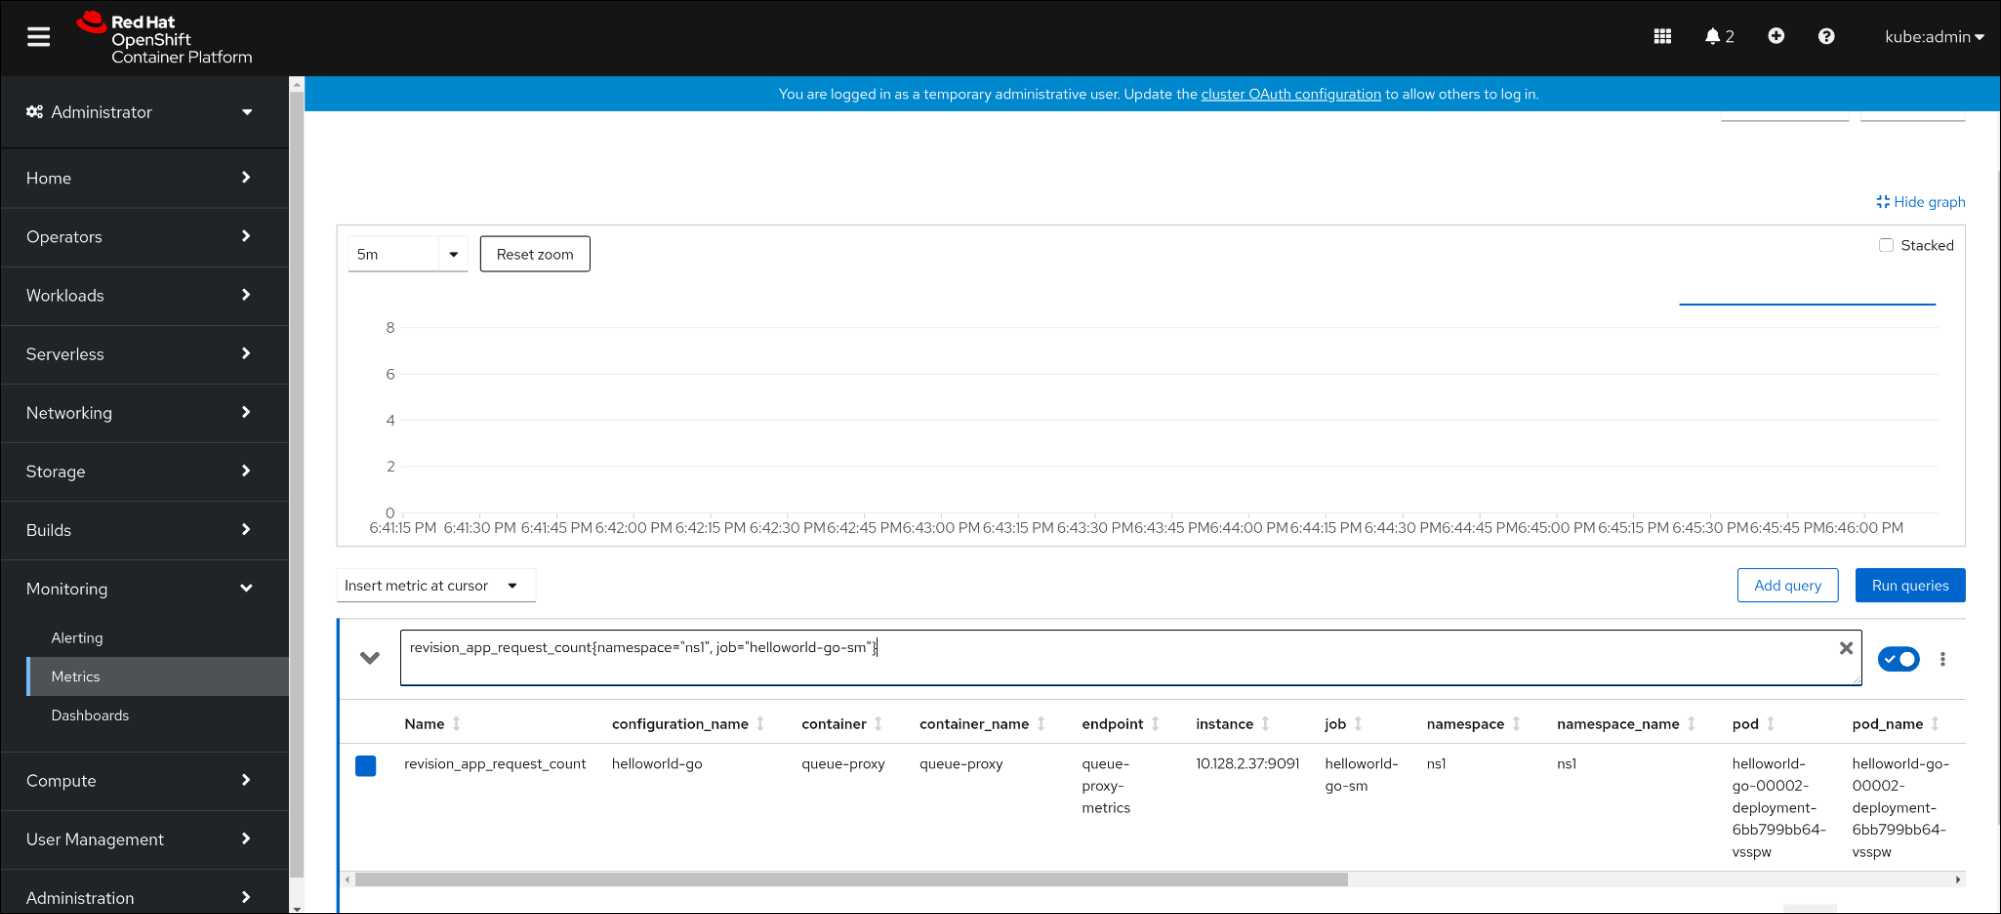
- In the web console, navigate to the Monitoring → Metrics interface.
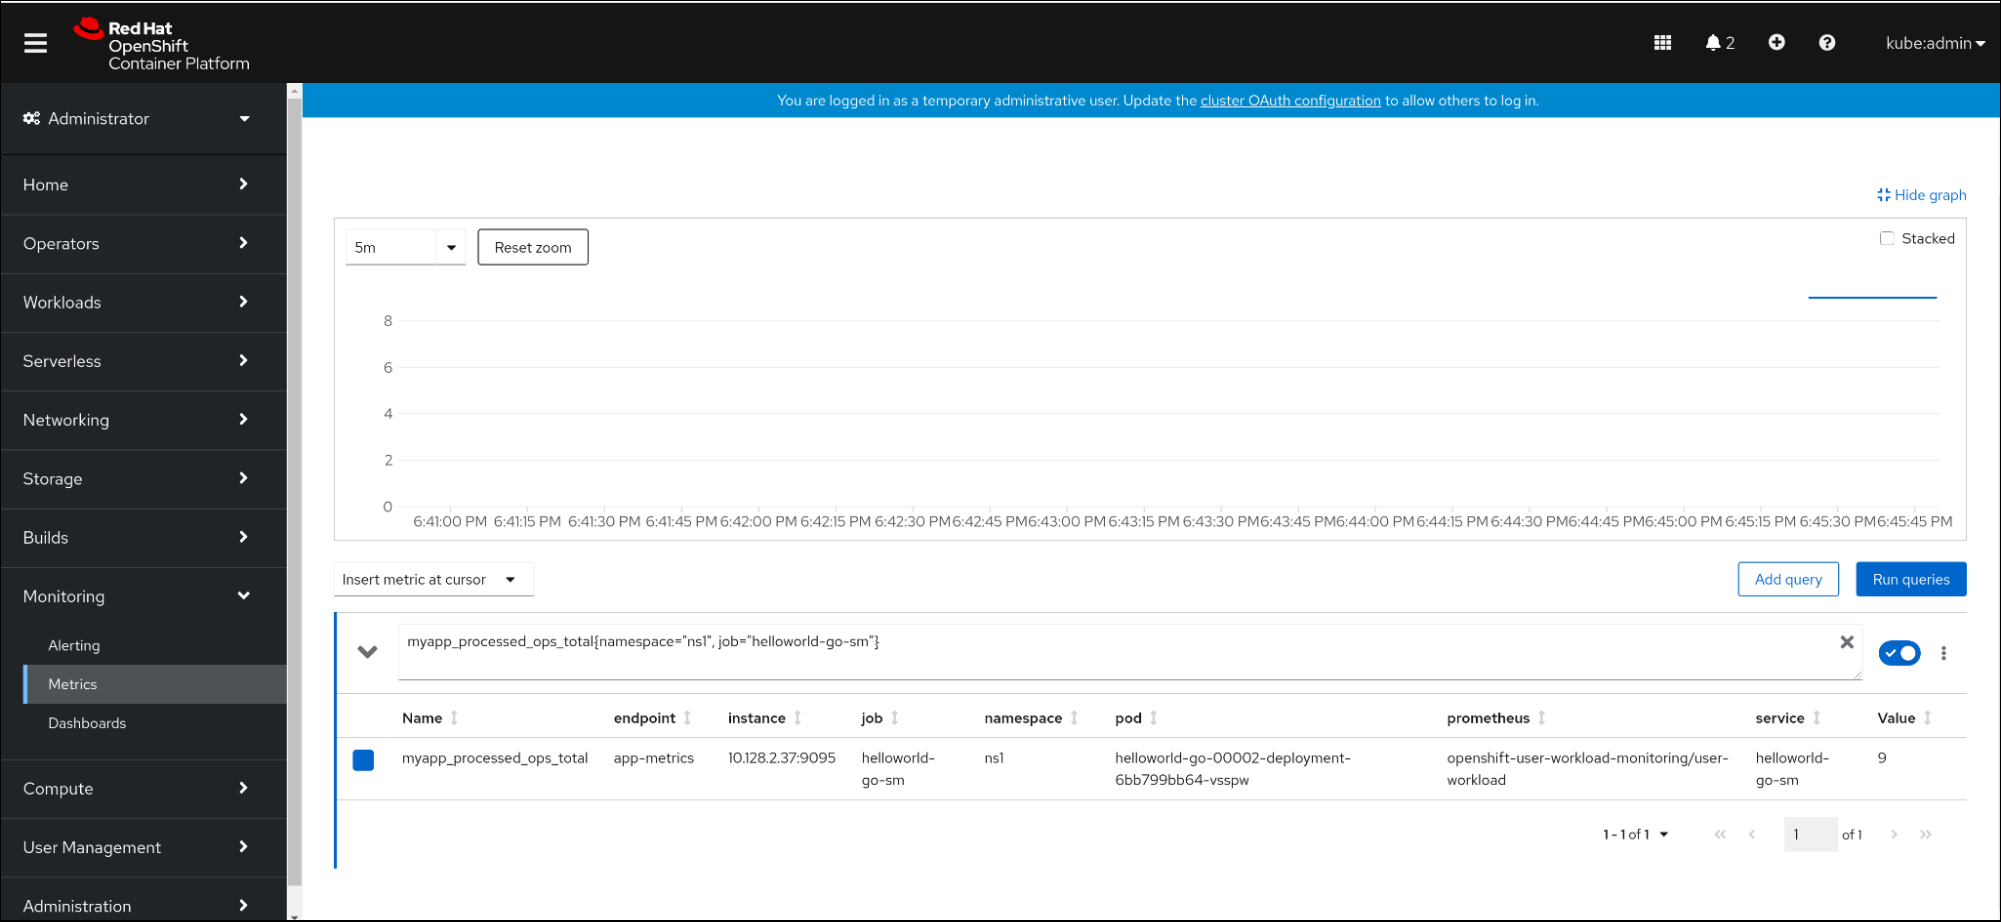
In the input field, enter the query for the metric you want to observe, for example:
revision_app_request_count{namespace="ns1", job="helloworld-go-sm"}Another example:
myapp_processed_ops_total{namespace="ns1", job="helloworld-go-sm"}Observe the visualized metrics:
7.2.4.1. Queue proxy metrics
Each Knative service has a proxy container that proxies the connections to the application container. A number of metrics are reported for the queue proxy performance.
You can use the following metrics to measure if requests are queued at the proxy side and the actual delay in serving requests at the application side.
| Metric name | Description | Type | Tags | Unit |
|---|---|---|---|---|
|
|
The number of requests that are routed to | Counter |
| Integer (no units) |
|
| The response time of revision requests. | Histogram |
| Milliseconds |
|
|
The number of requests that are routed to the | Counter |
| Integer (no units) |
|
| The response time of revision app requests. | Histogram |
| Milliseconds |
|
|
The current number of items in the | Gauge |
| Integer (no units) |
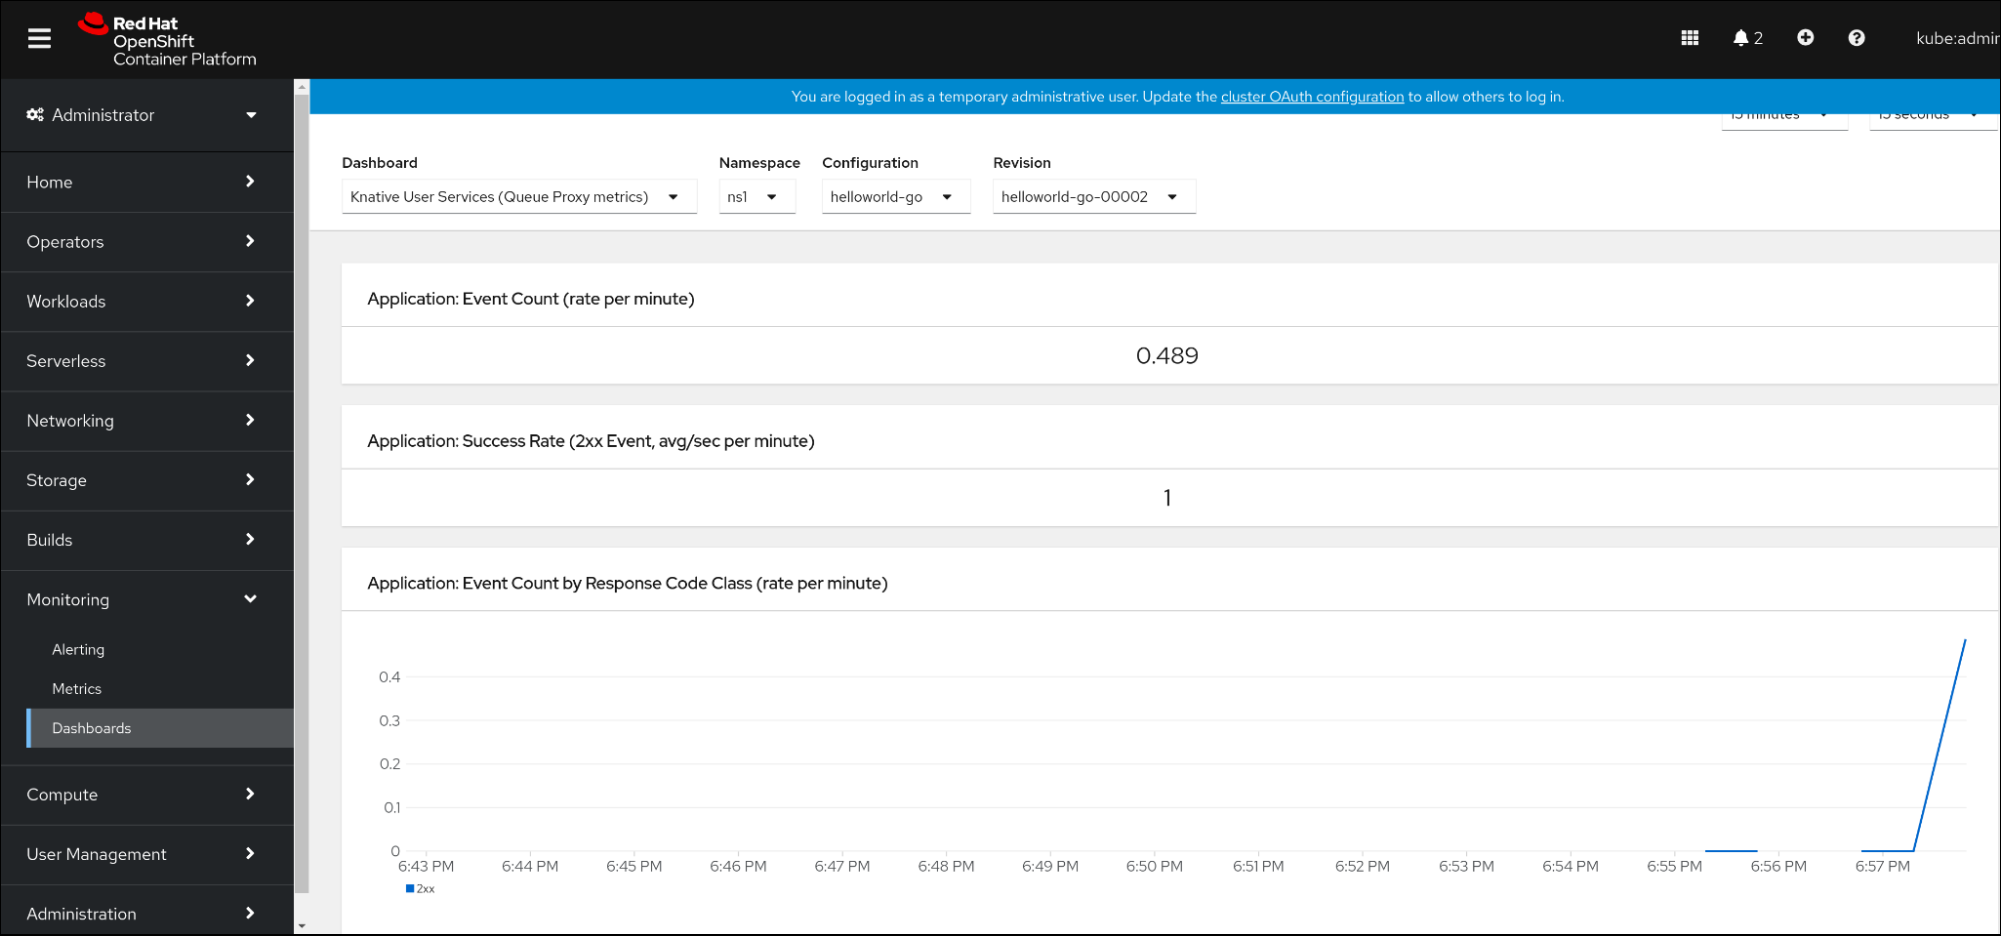
7.2.5. Examining metrics of a service in the dashboard
You can examine the metrics using a dedicated dashboard that aggregates queue proxy metrics by namespace.
Prerequisites
- You have logged in to the OpenShift Container Platform web console.
- You have installed the OpenShift Serverless Operator and Knative Serving.
Procedure
- In the web console, navigate to the Monitoring → Metrics interface.
-
Select the
Knative User Services (Queue Proxy metrics)dashboard. - Select the Namespace, Configuration, and Revision that correspond to your application.
Observe the visualized metrics: