
Monitoring
Configuring and using the monitoring stack in OpenShift Container Platform
Abstract
Chapter 1. Monitoring overview
1.1. About OpenShift Container Platform monitoring
OpenShift Container Platform includes a preconfigured, preinstalled, and self-updating monitoring stack that provides monitoring for core platform components. You also have the option to enable monitoring for user-defined projects.
A cluster administrator can configure the monitoring stack with the supported configurations. OpenShift Container Platform delivers monitoring best practices out of the box.
A set of alerts are included by default that immediately notify cluster administrators about issues with a cluster. Default dashboards in the OpenShift Container Platform web console include visual representations of cluster metrics to help you to quickly understand the state of your cluster.
With the OpenShift Container Platform web console, you can view and manage metrics, alerts, and review monitoring dashboards. OpenShift Container Platform also provides access to third-party interfaces, such as Prometheus, Alertmanager, and Grafana.
After installing OpenShift Container Platform 4.6, cluster administrators can optionally enable monitoring for user-defined projects. By using this feature, cluster administrators, developers, and other users can specify how services and pods are monitored in their own projects. You can also expose custom application metrics for horizontal pod autoscaling. As a cluster administrator, you can find answers to common problems such as user metrics unavailability and Prometheus consuming a lot of disk space in troubleshooting monitoring issues.
1.2. Understanding the monitoring stack
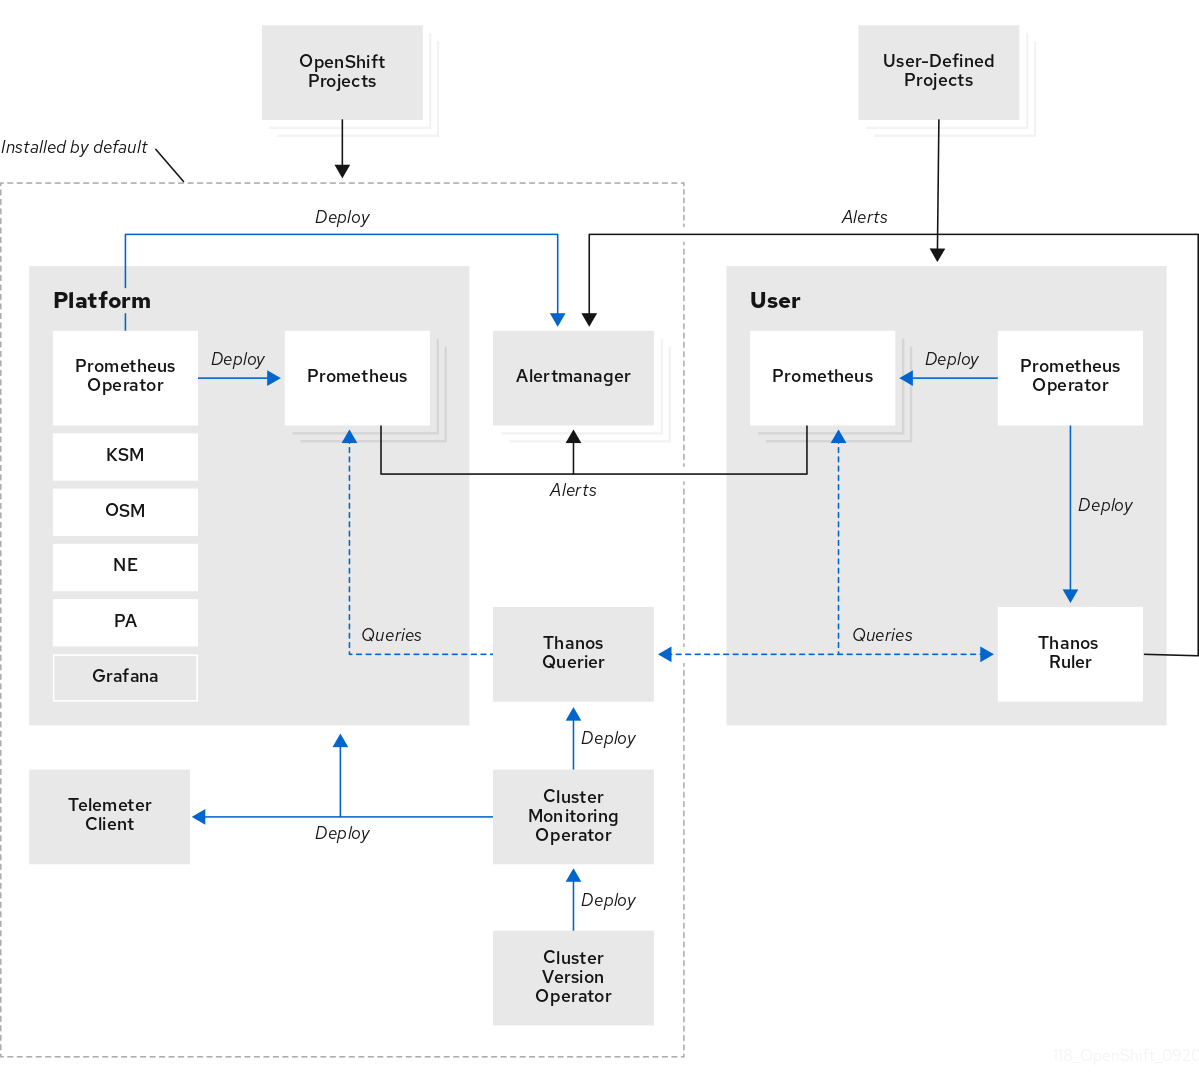
The OpenShift Container Platform monitoring stack is based on the Prometheus open source project and its wider ecosystem. The monitoring stack includes the following:
-
Default platform monitoring components. A set of platform monitoring components are installed in the
openshift-monitoringproject by default during an OpenShift Container Platform installation. This provides monitoring for core OpenShift Container Platform components including Kubernetes services. The default monitoring stack also enables remote health monitoring for clusters. These components are illustrated in the Installed by default section in the following diagram. -
Components for monitoring user-defined projects. After optionally enabling monitoring for user-defined projects, additional monitoring components are installed in the
openshift-user-workload-monitoringproject. This provides monitoring for user-defined projects. These components are illustrated in the User section in the following diagram.
1.2.1. Default monitoring components
By default, the OpenShift Container Platform 4.6 monitoring stack includes these components:
Table 1.1. Default monitoring stack components
| Component | Description |
|---|---|
| Cluster Monitoring Operator | The Cluster Monitoring Operator (CMO) is a central component of the monitoring stack. It deploys and manages Prometheus instances, the Thanos Querier, the Telemeter Client, and metrics targets and ensures that they are up to date. The CMO is deployed by the Cluster Version Operator (CVO). |
| Prometheus Operator |
The Prometheus Operator (PO) in the |
| Prometheus | Prometheus is the monitoring system on which the OpenShift Container Platform monitoring stack is based. Prometheus is a time-series database and a rule evaluation engine for metrics. Prometheus sends alerts to Alertmanager for processing. |
| Prometheus Adapter |
The Prometheus Adapter (PA in the preceding diagram) translates Kubernetes node and pod queries for use in Prometheus. The resource metrics that are translated include CPU and memory utilization metrics. The Prometheus Adapter exposes the cluster resource metrics API for horizontal pod autoscaling. The Prometheus Adapter is also used by the |
| Alertmanager | The Alertmanager service handles alerts received from Prometheus. Alertmanager is also responsible for sending the alerts to external notification systems. |
|
|
The |
|
|
The |
|
|
The |
| Thanos Querier | The Thanos Querier aggregates and optionally deduplicates core OpenShift Container Platform metrics and metrics for user-defined projects under a single, multi-tenant interface. |
| Grafana | The Grafana analytics platform provides dashboards for analyzing and visualizing the metrics. The Grafana instance that is provided with the monitoring stack, along with its dashboards, is read-only. |
| Telemeter Client | The Telemeter Client sends a subsection of the data from platform Prometheus instances to Red Hat to facilitate Remote Health Monitoring for clusters. |
All of the components in the monitoring stack are monitored by the stack and are automatically updated when OpenShift Container Platform is updated.
1.2.2. Default monitoring targets
In addition to the components of the stack itself, the default monitoring stack monitors:
- CoreDNS
- Elasticsearch (if Logging is installed)
- etcd
- Fluentd (if Logging is installed)
- HAProxy
- Image registry
- Kubelets
- Kubernetes apiserver
- Kubernetes controller manager
- Kubernetes scheduler
- Metering (if Metering is installed)
- OpenShift apiserver
- OpenShift controller manager
- Operator Lifecycle Manager (OLM)
Each OpenShift Container Platform component is responsible for its monitoring configuration. For problems with the monitoring of an OpenShift Container Platform component, open a Jira issue against that component, not against the general monitoring component.
Other OpenShift Container Platform framework components might be exposing metrics as well. For details, see their respective documentation.
1.2.3. Components for monitoring user-defined projects
OpenShift Container Platform 4.6 includes an optional enhancement to the monitoring stack that enables you to monitor services and pods in user-defined projects. This feature includes the following components:
Table 1.2. Components for monitoring user-defined projects
| Component | Description |
|---|---|
| Prometheus Operator |
The Prometheus Operator (PO) in the |
| Prometheus | Prometheus is the monitoring system through which monitoring is provided for user-defined projects. Prometheus sends alerts to Alertmanager for processing. |
| Thanos Ruler | The Thanos Ruler is a rule evaluation engine for Prometheus that is deployed as a separate process. In OpenShift Container Platform 4.6, Thanos Ruler provides rule and alerting evaluation for the monitoring of user-defined projects. |
The components in the preceding table are deployed after monitoring is enabled for user-defined projects.
All of the components in the monitoring stack are monitored by the stack and are automatically updated when OpenShift Container Platform is updated.
1.2.4. Monitoring targets for user-defined projects
When monitoring is enabled for user-defined projects, you can monitor:
- Metrics provided through service endpoints in user-defined projects.
- Pods running in user-defined projects.
1.3. Additional resources
1.4. Next steps
Chapter 2. Configuring the monitoring stack
The OpenShift Container Platform 4 installation program provides only a low number of configuration options before installation. Configuring most OpenShift Container Platform framework components, including the cluster monitoring stack, happens post-installation.
This section explains what configuration is supported, shows how to configure the monitoring stack, and demonstrates several common configuration scenarios.
2.1. Prerequisites
- The monitoring stack imposes additional resource requirements. Consult the computing resources recommendations in Scaling the Cluster Monitoring Operator and verify that you have sufficient resources.
2.2. Maintenance and support for monitoring
The supported way of configuring OpenShift Container Platform Monitoring is by configuring it using the options described in this document. Do not use other configurations, as they are unsupported. Configuration paradigms might change across Prometheus releases, and such cases can only be handled gracefully if all configuration possibilities are controlled. If you use configurations other than those described in this section, your changes will disappear because the cluster-monitoring-operator reconciles any differences. The Operator resets everything to the defined state by default and by design.
2.2.1. Support considerations for monitoring
The following modifications are explicitly not supported:
-
Creating additional
ServiceMonitor,PodMonitor, andPrometheusRuleobjects in theopenshift-*andkube-*projects. Modifying any resources or objects deployed in the
openshift-monitoringoropenshift-user-workload-monitoringprojects. The resources created by the OpenShift Container Platform monitoring stack are not meant to be used by any other resources, as there are no guarantees about their backward compatibility.NoteThe Alertmanager configuration is deployed as a secret resource in the
openshift-monitoringproject. To configure additional routes for Alertmanager, you need to decode, modify, and then encode that secret. This procedure is a supported exception to the preceding statement.- Modifying resources of the stack. The OpenShift Container Platform monitoring stack ensures its resources are always in the state it expects them to be. If they are modified, the stack will reset them.
-
Deploying user-defined workloads to
openshift-*, andkube-*projects. These projects are reserved for Red Hat provided components and they should not be used for user-defined workloads. - Modifying the monitoring stack Grafana instance.
- Installing custom Prometheus instances on OpenShift Container Platform. A custom instance is a Prometheus custom resource (CR) managed by the Prometheus Operator.
-
Enabling symptom based monitoring by using the
Probecustom resource definition (CRD) in Prometheus Operator.
Backward compatibility for metrics, recording rules, or alerting rules is not guaranteed.
2.2.2. Support policy for monitoring Operators
Monitoring Operators ensure that OpenShift Container Platform monitoring resources function as designed and tested. If Cluster Version Operator (CVO) control of an Operator is overridden, the Operator does not respond to configuration changes, reconcile the intended state of cluster objects, or receive updates.
While overriding CVO control for an Operator can be helpful during debugging, this is unsupported and the cluster administrator assumes full control of the individual component configurations and upgrades.
Overriding the Cluster Version Operator
The spec.overrides parameter can be added to the configuration for the CVO to allow administrators to provide a list of overrides to the behavior of the CVO for a component. Setting the spec.overrides[].unmanaged parameter to true for a component blocks cluster upgrades and alerts the administrator after a CVO override has been set:
Disabling ownership via cluster version overrides prevents upgrades. Please remove overrides before continuing.
Setting a CVO override puts the entire cluster in an unsupported state and prevents the monitoring stack from being reconciled to its intended state. This impacts the reliability features built into Operators and prevents updates from being received. Reported issues must be reproduced after removing any overrides for support to proceed.
2.3. Preparing to configure the monitoring stack
You can configure the monitoring stack by creating and updating monitoring config maps.
2.3.1. Creating a cluster monitoring config map
To configure core OpenShift Container Platform monitoring components, you must create the cluster-monitoring-config ConfigMap object in the openshift-monitoring project.
When you save your changes to the cluster-monitoring-config ConfigMap object, some or all of the pods in the openshift-monitoring project might be redeployed. It can sometimes take a while for these components to redeploy.
Prerequisites
-
You have access to the cluster as a user with the
cluster-adminrole. -
You have installed the OpenShift CLI (
oc).
Procedure
Check whether the
cluster-monitoring-configConfigMapobject exists:$ oc -n openshift-monitoring get configmap cluster-monitoring-config
If the
ConfigMapobject does not exist:Create the following YAML manifest. In this example the file is called
cluster-monitoring-config.yaml:apiVersion: v1 kind: ConfigMap metadata: name: cluster-monitoring-config namespace: openshift-monitoring data: config.yaml: |
Apply the configuration to create the
ConfigMapobject:$ oc apply -f cluster-monitoring-config.yaml
2.3.2. Creating a user-defined workload monitoring config map
To configure the components that monitor user-defined projects, you must create the user-workload-monitoring-config ConfigMap object in the openshift-user-workload-monitoring project.
When you save your changes to the user-workload-monitoring-config ConfigMap object, some or all of the pods in the openshift-user-workload-monitoring project might be redeployed. It can sometimes take a while for these components to redeploy. You can create and configure the config map before you first enable monitoring for user-defined projects, to prevent having to redeploy the pods often.
Prerequisites
-
You have access to the cluster as a user with the
cluster-adminrole. -
You have installed the OpenShift CLI (
oc).
Procedure
Check whether the
user-workload-monitoring-configConfigMapobject exists:$ oc -n openshift-user-workload-monitoring get configmap user-workload-monitoring-config
If the
user-workload-monitoring-configConfigMapobject does not exist:Create the following YAML manifest. In this example the file is called
user-workload-monitoring-config.yaml:apiVersion: v1 kind: ConfigMap metadata: name: user-workload-monitoring-config namespace: openshift-user-workload-monitoring data: config.yaml: |
Apply the configuration to create the
ConfigMapobject:$ oc apply -f user-workload-monitoring-config.yaml
NoteConfigurations applied to the
user-workload-monitoring-configConfigMapobject are not activated unless a cluster administrator has enabled monitoring for user-defined projects.
Additional resources
2.4. Configuring the monitoring stack
In OpenShift Container Platform 4.6, you can configure the monitoring stack using the cluster-monitoring-config or user-workload-monitoring-config ConfigMap objects. Config maps configure the Cluster Monitoring Operator (CMO), which in turn configures the components of the stack.
Prerequisites
If you are configuring core OpenShift Container Platform monitoring components:
-
You have access to the cluster as a user with the
cluster-adminrole. -
You have created the
cluster-monitoring-configConfigMapobject.
-
You have access to the cluster as a user with the
If you are configuring components that monitor user-defined projects:
-
You have access to the cluster as a user with the
cluster-adminrole, or as a user with theuser-workload-monitoring-config-editrole in theopenshift-user-workload-monitoringproject. -
You have created the
user-workload-monitoring-configConfigMapobject.
-
You have access to the cluster as a user with the
-
You have installed the OpenShift CLI (
oc).
Procedure
Edit the
ConfigMapobject.To configure core OpenShift Container Platform monitoring components:
Edit the
cluster-monitoring-configConfigMapobject in theopenshift-monitoringproject:$ oc -n openshift-monitoring edit configmap cluster-monitoring-config
Add your configuration under
data/config.yamlas a key-value pair<component_name>: <component_configuration>:apiVersion: v1 kind: ConfigMap metadata: name: cluster-monitoring-config namespace: openshift-monitoring data: config.yaml: | <component>: <configuration_for_the_component>Substitute
<component>and<configuration_for_the_component>accordingly.The following example
ConfigMapobject configures a persistent volume claim (PVC) for Prometheus. This relates to the Prometheus instance that monitors core OpenShift Container Platform components only:apiVersion: v1 kind: ConfigMap metadata: name: cluster-monitoring-config namespace: openshift-monitoring data: config.yaml: | prometheusK8s: 1 volumeClaimTemplate: spec: storageClassName: fast volumeMode: Filesystem resources: requests: storage: 40Gi- 1
- Defines the Prometheus component and the subsequent lines define its configuration.
To configure components that monitor user-defined projects:
Edit the
user-workload-monitoring-configConfigMapobject in theopenshift-user-workload-monitoringproject:$ oc -n openshift-user-workload-monitoring edit configmap user-workload-monitoring-config
Add your configuration under
data/config.yamlas a key-value pair<component_name>: <component_configuration>:apiVersion: v1 kind: ConfigMap metadata: name: user-workload-monitoring-config namespace: openshift-user-workload-monitoring data: config.yaml: | <component>: <configuration_for_the_component>Substitute
<component>and<configuration_for_the_component>accordingly.The following example
ConfigMapobject configures a data retention period and minimum container resource requests for Prometheus. This relates to the Prometheus instance that monitors user-defined projects only:apiVersion: v1 kind: ConfigMap metadata: name: user-workload-monitoring-config namespace: openshift-user-workload-monitoring data: config.yaml: | prometheus: 1 retention: 24h 2 resources: requests: cpu: 200m 3 memory: 2Gi 4- 1
- Defines the Prometheus component and the subsequent lines define its configuration.
- 2
- Configures a twenty-four hour data retention period for the Prometheus instance that monitors user-defined projects.
- 3
- Defines a minimum resource request of 200 millicores for the Prometheus container.
- 4
- Defines a minimum pod resource request of 2 GiB of memory for the Prometheus container.
NoteThe Prometheus config map component is called
prometheusK8sin thecluster-monitoring-configConfigMapobject andprometheusin theuser-workload-monitoring-configConfigMapobject.
Save the file to apply the changes to the
ConfigMapobject. The pods affected by the new configuration are restarted automatically.NoteConfigurations applied to the
user-workload-monitoring-configConfigMapobject are not activated unless a cluster administrator has enabled monitoring for user-defined projects.WarningWhen changes are saved to a monitoring config map, the pods and other resources in the related project might be redeployed. The running monitoring processes in that project might also be restarted.
Additional resources
- See Preparing to configure the monitoring stack for steps to create monitoring config maps
- Enabling monitoring for user-defined projects
2.5. Configurable monitoring components
This table shows the monitoring components you can configure and the keys used to specify the components in the cluster-monitoring-config and user-workload-monitoring-config ConfigMap objects:
Table 2.1. Configurable monitoring components
| Component | cluster-monitoring-config config map key | user-workload-monitoring-config config map key |
|---|---|---|
| Prometheus Operator |
|
|
| Prometheus |
|
|
| Alertmanager |
| |
| kube-state-metrics |
| |
| openshift-state-metrics |
| |
| Grafana |
| |
| Telemeter Client |
| |
| Prometheus Adapter |
| |
| Thanos Querier |
| |
| Thanos Ruler |
|
The Prometheus key is called prometheusK8s in the cluster-monitoring-config ConfigMap object and prometheus in the user-workload-monitoring-config ConfigMap object.
2.6. Moving monitoring components to different nodes
You can move any of the monitoring stack components to specific nodes.
Prerequisites
If you are configuring core OpenShift Container Platform monitoring components:
-
You have access to the cluster as a user with the
cluster-adminrole. -
You have created the
cluster-monitoring-configConfigMapobject.
-
You have access to the cluster as a user with the
If you are configuring components that monitor user-defined projects:
-
You have access to the cluster as a user with the
cluster-adminrole, or as a user with theuser-workload-monitoring-config-editrole in theopenshift-user-workload-monitoringproject. -
You have created the
user-workload-monitoring-configConfigMapobject.
-
You have access to the cluster as a user with the
-
You have installed the OpenShift CLI (
oc).
Procedure
Edit the
ConfigMapobject:To move a component that monitors core OpenShift Container Platform projects:
Edit the
cluster-monitoring-configConfigMapobject in theopenshift-monitoringproject:$ oc -n openshift-monitoring edit configmap cluster-monitoring-config
Specify the
nodeSelectorconstraint for the component underdata/config.yaml:apiVersion: v1 kind: ConfigMap metadata: name: cluster-monitoring-config namespace: openshift-monitoring data: config.yaml: | <component>: nodeSelector: <node_key>: <node_value> <node_key>: <node_value> <...>Substitute
<component>accordingly and substitute<node_key>: <node_value>with the map of key-value pairs that specifies a group of destination nodes. Often, only a single key-value pair is used.The component can only run on nodes that have each of the specified key-value pairs as labels. The nodes can have additional labels as well.
ImportantMany of the monitoring components are deployed by using multiple pods across different nodes in the cluster to maintain high availability. When moving monitoring components to labeled nodes, ensure that enough matching nodes are available to maintain resilience for the component. If only one label is specified, ensure that enough nodes contain that label to distribute all of the pods for the component across separate nodes. Alternatively, you can specify multiple labels each relating to individual nodes.
NoteIf monitoring components remain in a
Pendingstate after configuring thenodeSelectorconstraint, check the pod logs for errors relating to taints and tolerations.For example, to move monitoring components for core OpenShift Container Platform projects to specific nodes that are labeled
nodename: controlplane1,nodename: worker1,nodename: worker2, andnodename: worker2, use:apiVersion: v1 kind: ConfigMap metadata: name: cluster-monitoring-config namespace: openshift-monitoring data: config.yaml: | prometheusOperator: nodeSelector: nodename: controlplane1 prometheusK8s: nodeSelector: nodename: worker1 nodename: worker2 alertmanagerMain: nodeSelector: nodename: worker1 nodename: worker2 kubeStateMetrics: nodeSelector: nodename: worker1 grafana: nodeSelector: nodename: worker1 telemeterClient: nodeSelector: nodename: worker1 k8sPrometheusAdapter: nodeSelector: nodename: worker1 nodename: worker2 openshiftStateMetrics: nodeSelector: nodename: worker1 thanosQuerier: nodeSelector: nodename: worker1 nodename: worker2
To move a component that monitors user-defined projects:
Edit the
user-workload-monitoring-configConfigMapobject in theopenshift-user-workload-monitoringproject:$ oc -n openshift-user-workload-monitoring edit configmap user-workload-monitoring-config
Specify the
nodeSelectorconstraint for the component underdata/config.yaml:apiVersion: v1 kind: ConfigMap metadata: name: user-workload-monitoring-config namespace: openshift-user-workload-monitoring data: config.yaml: | <component>: nodeSelector: <node_key>: <node_value> <node_key>: <node_value> <...>Substitute
<component>accordingly and substitute<node_key>: <node_value>with the map of key-value pairs that specifies the destination nodes. Often, only a single key-value pair is used.The component can only run on nodes that have each of the specified key-value pairs as labels. The nodes can have additional labels as well.
ImportantMany of the monitoring components are deployed by using multiple pods across different nodes in the cluster to maintain high availability. When moving monitoring components to labeled nodes, ensure that enough matching nodes are available to maintain resilience for the component. If only one label is specified, ensure that enough nodes contain that label to distribute all of the pods for the component across separate nodes. Alternatively, you can specify multiple labels each relating to individual nodes.
NoteIf monitoring components remain in a
Pendingstate after configuring thenodeSelectorconstraint, check the pod logs for errors relating to taints and tolerations.For example, to move monitoring components for user-defined projects to specific worker nodes labeled
nodename: worker1,nodename: worker2, andnodename: worker2, use:apiVersion: v1 kind: ConfigMap metadata: name: user-workload-monitoring-config namespace: openshift-user-workload-monitoring data: config.yaml: | prometheusOperator: nodeSelector: nodename: worker1 prometheus: nodeSelector: nodename: worker1 nodename: worker2 thanosRuler: nodeSelector: nodename: worker1 nodename: worker2
Save the file to apply the changes. The components affected by the new configuration are moved to the new nodes automatically.
NoteConfigurations applied to the
user-workload-monitoring-configConfigMapobject are not activated unless a cluster administrator has enabled monitoring for user-defined projects.WarningWhen changes are saved to a monitoring config map, the pods and other resources in the related project might be redeployed. The running monitoring processes in that project might also be restarted.
Additional resources
- See Preparing to configure the monitoring stack for steps to create monitoring config maps
- Enabling monitoring for user-defined projects
- Understanding how to update labels on nodes
- Placing pods on specific nodes using node selectors
-
See the Kubernetes documentation for details on the
nodeSelectorconstraint
2.7. Assigning tolerations to monitoring components
You can assign tolerations to any of the monitoring stack components to enable moving them to tainted nodes.
Prerequisites
If you are configuring core OpenShift Container Platform monitoring components:
-
You have access to the cluster as a user with the
cluster-adminrole. -
You have created the
cluster-monitoring-configConfigMapobject.
-
You have access to the cluster as a user with the
If you are configuring components that monitor user-defined projects:
-
You have access to the cluster as a user with the
cluster-adminrole, or as a user with theuser-workload-monitoring-config-editrole in theopenshift-user-workload-monitoringproject. -
You have created the
user-workload-monitoring-configConfigMapobject.
-
You have access to the cluster as a user with the
-
You have installed the OpenShift CLI (
oc).
Procedure
Edit the
ConfigMapobject:To assign tolerations to a component that monitors core OpenShift Container Platform projects:
Edit the
cluster-monitoring-configConfigMapobject in theopenshift-monitoringproject:$ oc -n openshift-monitoring edit configmap cluster-monitoring-config
Specify
tolerationsfor the component:apiVersion: v1 kind: ConfigMap metadata: name: cluster-monitoring-config namespace: openshift-monitoring data: config.yaml: | <component>: tolerations: <toleration_specification>Substitute
<component>and<toleration_specification>accordingly.For example,
oc adm taint nodes node1 key1=value1:NoScheduleadds a taint tonode1with the keykey1and the valuevalue1. This prevents monitoring components from deploying pods onnode1unless a toleration is configured for that taint. The following example configures thealertmanagerMaincomponent to tolerate the example taint:apiVersion: v1 kind: ConfigMap metadata: name: cluster-monitoring-config namespace: openshift-monitoring data: config.yaml: | alertmanagerMain: tolerations: - key: "key1" operator: "Equal" value: "value1" effect: "NoSchedule"
To assign tolerations to a component that monitors user-defined projects:
Edit the
user-workload-monitoring-configConfigMapobject in theopenshift-user-workload-monitoringproject:$ oc -n openshift-user-workload-monitoring edit configmap user-workload-monitoring-config
Specify
tolerationsfor the component:apiVersion: v1 kind: ConfigMap metadata: name: user-workload-monitoring-config namespace: openshift-user-workload-monitoring data: config.yaml: | <component>: tolerations: <toleration_specification>Substitute
<component>and<toleration_specification>accordingly.For example,
oc adm taint nodes node1 key1=value1:NoScheduleadds a taint tonode1with the keykey1and the valuevalue1. This prevents monitoring components from deploying pods onnode1unless a toleration is configured for that taint. The following example configures thethanosRulercomponent to tolerate the example taint:apiVersion: v1 kind: ConfigMap metadata: name: user-workload-monitoring-config namespace: openshift-user-workload-monitoring data: config.yaml: | thanosRuler: tolerations: - key: "key1" operator: "Equal" value: "value1" effect: "NoSchedule"
Save the file to apply the changes. The new component placement configuration is applied automatically.
NoteConfigurations applied to the
user-workload-monitoring-configConfigMapobject are not activated unless a cluster administrator has enabled monitoring for user-defined projects.WarningWhen changes are saved to a monitoring config map, the pods and other resources in the related project might be redeployed. The running monitoring processes in that project might also be restarted.
Additional resources
- See Preparing to configure the monitoring stack for steps to create monitoring config maps
- Enabling monitoring for user-defined projects
- See the OpenShift Container Platform documentation on taints and tolerations
- See the Kubernetes documentation on taints and tolerations
2.8. Configuring persistent storage
Running cluster monitoring with persistent storage means that your metrics are stored to a persistent volume (PV) and can survive a pod being restarted or recreated. This is ideal if you require your metrics or alerting data to be guarded from data loss. For production environments, it is highly recommended to configure persistent storage. Because of the high IO demands, it is advantageous to use local storage.
2.8.1. Persistent storage prerequisites
- Dedicate sufficient local persistent storage to ensure that the disk does not become full. How much storage you need depends on the number of pods. For information on system requirements for persistent storage, see Prometheus database storage requirements.
- Make sure you have a persistent volume (PV) ready to be claimed by the persistent volume claim (PVC), one PV for each replica. Because Prometheus has two replicas and Alertmanager has three replicas, you need five PVs to support the entire monitoring stack. The PVs should be available from the Local Storage Operator. This does not apply if you enable dynamically provisioned storage.
- Use the block type of storage.
Configure local persistent storage.
NoteIf you use a local volume for persistent storage, do not use a raw block volume, which is described with
volumeMode: blockin theLocalVolumeobject. Prometheus cannot use raw block volumes.
2.8.2. Configuring a local persistent volume claim
For monitoring components to use a persistent volume (PV), you must configure a persistent volume claim (PVC).
Prerequisites
If you are configuring core OpenShift Container Platform monitoring components:
-
You have access to the cluster as a user with the
cluster-adminrole. -
You have created the
cluster-monitoring-configConfigMapobject.
-
You have access to the cluster as a user with the
If you are configuring components that monitor user-defined projects:
-
You have access to the cluster as a user with the
cluster-adminrole, or as a user with theuser-workload-monitoring-config-editrole in theopenshift-user-workload-monitoringproject. -
You have created the
user-workload-monitoring-configConfigMapobject.
-
You have access to the cluster as a user with the
-
You have installed the OpenShift CLI (
oc).
Procedure
Edit the
ConfigMapobject:To configure a PVC for a component that monitors core OpenShift Container Platform projects:
Edit the
cluster-monitoring-configConfigMapobject in theopenshift-monitoringproject:$ oc -n openshift-monitoring edit configmap cluster-monitoring-config
Add your PVC configuration for the component under
data/config.yaml:apiVersion: v1 kind: ConfigMap metadata: name: cluster-monitoring-config namespace: openshift-monitoring data: config.yaml: | <component>: volumeClaimTemplate: spec: storageClassName: <storage_class> resources: requests: storage: <amount_of_storage>See the Kubernetes documentation on PersistentVolumeClaims for information on how to specify
volumeClaimTemplate.The following example configures a PVC that claims local persistent storage for the Prometheus instance that monitors core OpenShift Container Platform components:
apiVersion: v1 kind: ConfigMap metadata: name: cluster-monitoring-config namespace: openshift-monitoring data: config.yaml: | prometheusK8s: volumeClaimTemplate: spec: storageClassName: local-storage resources: requests: storage: 40GiIn the above example, the storage class created by the Local Storage Operator is called
local-storage.The following example configures a PVC that claims local persistent storage for Alertmanager:
apiVersion: v1 kind: ConfigMap metadata: name: cluster-monitoring-config namespace: openshift-monitoring data: config.yaml: | alertmanagerMain: volumeClaimTemplate: spec: storageClassName: local-storage resources: requests: storage: 10Gi
To configure a PVC for a component that monitors user-defined projects:
Edit the
user-workload-monitoring-configConfigMapobject in theopenshift-user-workload-monitoringproject:$ oc -n openshift-user-workload-monitoring edit configmap user-workload-monitoring-config
Add your PVC configuration for the component under
data/config.yaml:apiVersion: v1 kind: ConfigMap metadata: name: user-workload-monitoring-config namespace: openshift-user-workload-monitoring data: config.yaml: | <component>: volumeClaimTemplate: spec: storageClassName: <storage_class> resources: requests: storage: <amount_of_storage>See the Kubernetes documentation on PersistentVolumeClaims for information on how to specify
volumeClaimTemplate.The following example configures a PVC that claims local persistent storage for the Prometheus instance that monitors user-defined projects:
apiVersion: v1 kind: ConfigMap metadata: name: user-workload-monitoring-config namespace: openshift-user-workload-monitoring data: config.yaml: | prometheus: volumeClaimTemplate: spec: storageClassName: local-storage resources: requests: storage: 40GiIn the above example, the storage class created by the Local Storage Operator is called
local-storage.The following example configures a PVC that claims local persistent storage for Thanos Ruler:
apiVersion: v1 kind: ConfigMap metadata: name: user-workload-monitoring-config namespace: openshift-user-workload-monitoring data: config.yaml: | thanosRuler: volumeClaimTemplate: spec: storageClassName: local-storage resources: requests: storage: 10GiNoteStorage requirements for the
thanosRulercomponent depend on the number of rules that are evaluated and how many samples each rule generates.
Save the file to apply the changes. The pods affected by the new configuration are restarted automatically and the new storage configuration is applied.
NoteConfigurations applied to the
user-workload-monitoring-configConfigMapobject are not activated unless a cluster administrator has enabled monitoring for user-defined projects.WarningWhen changes are saved to a monitoring config map, the pods and other resources in the related project might be redeployed. The running monitoring processes in that project might also be restarted.
2.8.3. Modifying the retention time for Prometheus metrics data
By default, the OpenShift Container Platform monitoring stack configures the retention time for Prometheus data to be 15 days. You can modify the retention time to change how soon the data is deleted.
Prerequisites
If you are configuring core OpenShift Container Platform monitoring components:
-
You have access to the cluster as a user with the
cluster-adminrole. -
You have created the
cluster-monitoring-configConfigMapobject.
-
You have access to the cluster as a user with the
If you are configuring components that monitor user-defined projects:
-
You have access to the cluster as a user with the
cluster-adminrole, or as a user with theuser-workload-monitoring-config-editrole in theopenshift-user-workload-monitoringproject. -
You have created the
user-workload-monitoring-configConfigMapobject.
-
You have access to the cluster as a user with the
-
You have installed the OpenShift CLI (
oc).
Procedure
Edit the
ConfigMapobject:To modify the retention time for the Prometheus instance that monitors core OpenShift Container Platform projects:
Edit the
cluster-monitoring-configConfigMapobject in theopenshift-monitoringproject:$ oc -n openshift-monitoring edit configmap cluster-monitoring-config
Add your retention time configuration under
data/config.yaml:apiVersion: v1 kind: ConfigMap metadata: name: cluster-monitoring-config namespace: openshift-monitoring data: config.yaml: | prometheusK8s: retention: <time_specification>Substitute
<time_specification>with a number directly followed byms(milliseconds),s(seconds),m(minutes),h(hours),d(days),w(weeks), ory(years).The following example sets the retention time to 24 hours for the Prometheus instance that monitors core OpenShift Container Platform components:
apiVersion: v1
kind: ConfigMap
metadata:
  name: cluster-monitoring-config
  namespace: openshift-monitoring
data:
  config.yaml: |
    prometheusK8s:
      retention: 24h
To modify the retention time for the Prometheus instance that monitors user-defined projects:
Edit the
user-workload-monitoring-configConfigMapobject in theopenshift-user-workload-monitoringproject:$ oc -n openshift-user-workload-monitoring edit configmap user-workload-monitoring-config
Add your retention time configuration under
data/config.yaml:apiVersion: v1 kind: ConfigMap metadata: name: user-workload-monitoring-config namespace: openshift-user-workload-monitoring data: config.yaml: | prometheus: retention: <time_specification>Substitute
<time_specification>with a number directly followed byms(milliseconds),s(seconds),m(minutes),h(hours),d(days),w(weeks), ory(years).The following example sets the retention time to 24 hours for the Prometheus instance that monitors user-defined projects:
apiVersion: v1
kind: ConfigMap
metadata:
  name: user-workload-monitoring-config
  namespace: openshift-user-workload-monitoring
data:
  config.yaml: |
    prometheus:
      retention: 24h
Save the file to apply the changes. The pods affected by the new configuration are restarted automatically.
NoteConfigurations applied to the
user-workload-monitoring-configConfigMapobject are not activated unless a cluster administrator has enabled monitoring for user-defined projects.WarningWhen changes are saved to a monitoring config map, the pods and other resources in the related project might be redeployed. The running monitoring processes in that project might also be restarted.
Additional resources
- See Preparing to configure the monitoring stack for steps to create monitoring config maps
- Enabling monitoring for user-defined projects
- Understanding persistent storage
- Optimizing storage
2.9. Controlling the impact of unbound metrics attributes in user-defined projects
Developers can create labels to define attributes for metrics in the form of key-value pairs. The number of potential key-value pairs corresponds to the number of possible values for an attribute. An attribute that has an unlimited number of potential values is called an unbound attribute. For example, a customer_id attribute is unbound because it has an infinite number of possible values.
Every assigned key-value pair has a unique time series. The use of many unbound attributes in labels can result in an exponential increase in the number of time series created. This can impact Prometheus performance and can consume a lot of disk space.
Cluster administrators can use the following measures to control the impact of unbound metrics attributes in user-defined projects:
- Limit the number of samples that can be accepted per target scrape in user-defined projects
- Create alerts that fire when a scrape sample threshold is reached or when the target cannot be scraped
Limiting scrape samples can help prevent the issues caused by adding many unbound attributes to labels. Developers can also prevent the underlying cause by limiting the number of unbound attributes that they define for metrics. Using attributes that are bound to a limited set of possible values reduces the number of potential key-value pair combinations.
2.9.1. Setting a scrape sample limit for user-defined projects
You can limit the number of samples that can be accepted per target scrape in user-defined projects.
If you set a sample limit, no further sample data is ingested for that target scrape after the limit is reached.
Prerequisites
-
You have access to the cluster as a user with the
cluster-adminrole, or as a user with theuser-workload-monitoring-config-editrole in theopenshift-user-workload-monitoringproject. -
You have created the
user-workload-monitoring-configConfigMapobject. -
You have installed the OpenShift CLI (
oc).
Procedure
Edit the
user-workload-monitoring-configConfigMapobject in theopenshift-user-workload-monitoringproject:$ oc -n openshift-user-workload-monitoring edit configmap user-workload-monitoring-config
Add the
enforcedSampleLimitconfiguration todata/config.yamlto limit the number of samples that can be accepted per target scrape in user-defined projects:apiVersion: v1 kind: ConfigMap metadata: name: user-workload-monitoring-config namespace: openshift-user-workload-monitoring data: config.yaml: | prometheus: enforcedSampleLimit: 50000 1- 1
- A value is required if this parameter is specified. This
enforcedSampleLimitexample limits the number of samples that can be accepted per target scrape in user-defined projects to 50,000.
Save the file to apply the changes. The limit is applied automatically.
NoteConfigurations applied to the
user-workload-monitoring-configConfigMapobject are not activated unless a cluster administrator has enabled monitoring for user-defined projects.WarningWhen changes are saved to the
user-workload-monitoring-configConfigMapobject, the pods and other resources in theopenshift-user-workload-monitoringproject might be redeployed. The running monitoring processes in that project might also be restarted.
2.9.2. Creating scrape sample alerts
You can create alerts that notify you when:
-
The target cannot be scraped or is not available for the specified
forduration -
A scrape sample threshold is reached or is exceeded for the specified
forduration
Prerequisites
-
You have access to the cluster as a user with the
cluster-adminrole, or as a user with theuser-workload-monitoring-config-editrole in theopenshift-user-workload-monitoringproject. - You have enabled monitoring for user-defined projects.
-
You have created the
user-workload-monitoring-configConfigMapobject. -
You have limited the number of samples that can be accepted per target scrape in user-defined projects, by using
enforcedSampleLimit. -
You have installed the OpenShift CLI (
oc).
Procedure
Create a YAML file with alerts that inform you when the targets are down and when the enforced sample limit is approaching. The file in this example is called
monitoring-stack-alerts.yaml:apiVersion: monitoring.coreos.com/v1 kind: PrometheusRule metadata: labels: prometheus: k8s role: alert-rules name: monitoring-stack-alerts 1 namespace: ns1 2 spec: groups: - name: general.rules rules: - alert: TargetDown 3 annotations: message: '{{ printf "%.4g" $value }}% of the {{ $labels.job }}/{{ $labels.service }} targets in {{ $labels.namespace }} namespace are down.' 4 expr: 100 * (count(up == 0) BY (job, namespace, service) / count(up) BY (job, namespace, service)) > 10 for: 10m 5 labels: severity: warning 6 - alert: ApproachingEnforcedSamplesLimit 7 annotations: message: '{{ $labels.container }} container of the {{ $labels.pod }} pod in the {{ $labels.namespace }} namespace consumes {{ $value | humanizePercentage }} of the samples limit budget.' 8 expr: scrape_samples_scraped/50000 > 0.8 9 for: 10m 10 labels: severity: warning 11- 1
- Defines the name of the alerting rule.
- 2
- Specifies the user-defined project where the alerting rule will be deployed.
- 3
- The
TargetDownalert will fire if the target cannot be scraped or is not available for theforduration. - 4
- The message that will be output when the
TargetDownalert fires. - 5
- The conditions for the
TargetDownalert must be true for this duration before the alert is fired. - 6
- Defines the severity for the
TargetDownalert. - 7
- The
ApproachingEnforcedSamplesLimitalert will fire when the defined scrape sample threshold is reached or exceeded for the specifiedforduration. - 8
- The message that will be output when the
ApproachingEnforcedSamplesLimitalert fires. - 9
- The threshold for the
ApproachingEnforcedSamplesLimitalert. In this example the alert will fire when the number of samples per target scrape has exceeded 80% of the enforced sample limit of50000. Theforduration must also have passed before the alert will fire. The<number>in the expressionscrape_samples_scraped/<number> > <threshold>must match theenforcedSampleLimitvalue defined in theuser-workload-monitoring-configConfigMapobject. - 10
- The conditions for the
ApproachingEnforcedSamplesLimitalert must be true for this duration before the alert is fired. - 11
- Defines the severity for the
ApproachingEnforcedSamplesLimitalert.
Apply the configuration to the user-defined project:
$ oc apply -f monitoring-stack-alerts.yaml
Additional resources
- Creating a user-defined workload monitoring config map
- Enabling monitoring for user-defined projects
- See Determining why Prometheus is consuming a lot of disk space for steps to query which metrics have the highest number of scrape samples
2.10. Attaching additional labels to your time series and alerts
Using the external labels feature of Prometheus, you can attach custom labels to all time series and alerts leaving Prometheus.
Prerequisites
If you are configuring core OpenShift Container Platform monitoring components:
-
You have access to the cluster as a user with the
cluster-adminrole. -
You have created the
cluster-monitoring-configConfigMapobject.
-
You have access to the cluster as a user with the
If you are configuring components that monitor user-defined projects:
-
You have access to the cluster as a user with the
cluster-adminrole, or as a user with theuser-workload-monitoring-config-editrole in theopenshift-user-workload-monitoringproject. -
You have created the
user-workload-monitoring-configConfigMapobject.
-
You have access to the cluster as a user with the
-
You have installed the OpenShift CLI (
oc).
Procedure
Edit the
ConfigMapobject:To attach custom labels to all time series and alerts leaving the Prometheus instance that monitors core OpenShift Container Platform projects:
Edit the
cluster-monitoring-configConfigMapobject in theopenshift-monitoringproject:$ oc -n openshift-monitoring edit configmap cluster-monitoring-config
Define a map of labels you want to add for every metric under
data/config.yaml:apiVersion: v1 kind: ConfigMap metadata: name: cluster-monitoring-config namespace: openshift-monitoring data: config.yaml: | prometheusK8s: externalLabels: <key>: <value> 1- 1
- Substitute
<key>: <value>with a map of key-value pairs where<key>is a unique name for the new label and<value>is its value.
WarningDo not use
prometheusorprometheus_replicaas key names, because they are reserved and will be overwritten.For example, to add metadata about the region and environment to all time series and alerts, use:
apiVersion: v1
kind: ConfigMap
metadata:
  name: cluster-monitoring-config
  namespace: openshift-monitoring
data:
  config.yaml: |
    prometheusK8s:
      externalLabels:
        region: eu
        environment: prod
To attach custom labels to all time series and alerts leaving the Prometheus instance that monitors user-defined projects:
Edit the
user-workload-monitoring-configConfigMapobject in theopenshift-user-workload-monitoringproject:$ oc -n openshift-user-workload-monitoring edit configmap user-workload-monitoring-config
Define a map of labels you want to add for every metric under
data/config.yaml:apiVersion: v1 kind: ConfigMap metadata: name: user-workload-monitoring-config namespace: openshift-user-workload-monitoring data: config.yaml: | prometheus: externalLabels: <key>: <value> 1- 1
- Substitute
<key>: <value>with a map of key-value pairs where<key>is a unique name for the new label and<value>is its value.
WarningDo not use
prometheusorprometheus_replicaas key names, because they are reserved and will be overwritten.NoteIn the
openshift-user-workload-monitoringproject, Prometheus handles metrics and Thanos Ruler handles alerting and recording rules. SettingexternalLabelsforprometheusin theuser-workload-monitoring-configConfigMapobject will only configure external labels for metrics and not for any rules.For example, to add metadata about the region and environment to all time series and alerts related to user-defined projects, use:
apiVersion: v1
kind: ConfigMap
metadata:
  name: user-workload-monitoring-config
  namespace: openshift-user-workload-monitoring
data:
  config.yaml: |
    prometheus:
      externalLabels:
        region: eu
        environment: prod
Save the file to apply the changes. The new configuration is applied automatically.
NoteConfigurations applied to the
user-workload-monitoring-configConfigMapobject are not activated unless a cluster administrator has enabled monitoring for user-defined projects.WarningWhen changes are saved to a monitoring config map, the pods and other resources in the related project might be redeployed. The running monitoring processes in that project might also be restarted.
Additional resources
- See Preparing to configure the monitoring stack for steps to create monitoring config maps
- Enabling monitoring for user-defined projects
- See Preparing to configure the monitoring stack for steps to create monitoring config maps
2.11. Setting log levels for monitoring components
You can configure the log level for Prometheus Operator, Prometheus, and Thanos Ruler.
The following log levels can be applied to each of those components in the cluster-monitoring-config and user-workload-monitoring-config ConfigMap objects:
-
debug. Log debug, informational, warning, and error messages. -
info. Log informational, warning, and error messages. -
warn. Log warning and error messages only. -
error. Log error messages only.
The default log level is info.
Prerequisites
If you are setting a log level for Prometheus Operator or Prometheus in the
openshift-monitoringproject:-
You have access to the cluster as a user with the
cluster-adminrole. -
You have created the
cluster-monitoring-configConfigMapobject.
-
You have access to the cluster as a user with the
If you are setting a log level for Prometheus Operator, Prometheus, or Thanos Ruler in the
openshift-user-workload-monitoringproject:-
You have access to the cluster as a user with the
cluster-adminrole, or as a user with theuser-workload-monitoring-config-editrole in theopenshift-user-workload-monitoringproject. -
You have created the
user-workload-monitoring-configConfigMapobject.
-
You have access to the cluster as a user with the
-
You have installed the OpenShift CLI (
oc).
Procedure
Edit the
ConfigMapobject:To set a log level for a component in the
openshift-monitoringproject:Edit the
cluster-monitoring-configConfigMapobject in theopenshift-monitoringproject:$ oc -n openshift-monitoring edit configmap cluster-monitoring-config
Add
logLevel: <log_level>for a component underdata/config.yaml:apiVersion: v1 kind: ConfigMap metadata: name: cluster-monitoring-config namespace: openshift-monitoring data: config.yaml: | <component>: 1 logLevel: <log_level> 2
To set a log level for a component in the
openshift-user-workload-monitoringproject:Edit the
user-workload-monitoring-configConfigMapobject in theopenshift-user-workload-monitoringproject:$ oc -n openshift-user-workload-monitoring edit configmap user-workload-monitoring-config
Add
logLevel: <log_level>for a component underdata/config.yaml:apiVersion: v1 kind: ConfigMap metadata: name: user-workload-monitoring-config namespace: openshift-user-workload-monitoring data: config.yaml: | <component>: 1 logLevel: <log_level> 2
Save the file to apply the changes. The pods for the component restarts automatically when you apply the log-level change.
NoteConfigurations applied to the
user-workload-monitoring-configConfigMapobject are not activated unless a cluster administrator has enabled monitoring for user-defined projects.WarningWhen changes are saved to a monitoring config map, the pods and other resources in the related project might be redeployed. The running monitoring processes in that project might also be restarted.
Confirm that the log-level has been applied by reviewing the deployment or pod configuration in the related project. The following example checks the log level in the
prometheus-operatordeployment in theopenshift-user-workload-monitoringproject:$ oc -n openshift-user-workload-monitoring get deploy prometheus-operator -o yaml | grep "log-level"
Example output
- --log-level=debug
Check that the pods for the component are running. The following example lists the status of pods in the
openshift-user-workload-monitoringproject:$ oc -n openshift-user-workload-monitoring get pods
NoteIf an unrecognized
loglevelvalue is included in theConfigMapobject, the pods for the component might not restart successfully.
Additional resources
- See Preparing to configure the monitoring stack for steps to create monitoring config maps
- Enabling monitoring for user-defined projects
2.12. Next steps
- Enabling monitoring for user-defined projects
- Learn about remote health reporting and, if necessary, opt out of it
Chapter 3. Enabling monitoring for user-defined projects
In OpenShift Container Platform 4.6, you can enable monitoring for user-defined projects in addition to the default platform monitoring. You can now monitor your own projects in OpenShift Container Platform without the need for an additional monitoring solution. Using this new feature centralizes monitoring for core platform components and user-defined projects.
Versions of Prometheus Operator installed using Operator Lifecycle Manager (OLM) are not compatible with user-defined monitoring. Therefore, custom Prometheus instances installed as a Prometheus custom resource (CR) managed by the OLM Prometheus Operator are not supported in OpenShift Container Platform.
3.1. Enabling monitoring for user-defined projects
Cluster administrators can enable monitoring for user-defined projects by setting the enableUserWorkload: true field in the cluster monitoring ConfigMap object.
In OpenShift Container Platform 4.6 you must remove any custom Prometheus instances before enabling monitoring for user-defined projects.
You must have access to the cluster as a user with the cluster-admin role to enable monitoring for user-defined projects in OpenShift Container Platform. Cluster administrators can then optionally grant users permission to configure the components that are responsible for monitoring user-defined projects.
Prerequisites
-
You have access to the cluster as a user with the
cluster-adminrole. -
You have installed the OpenShift CLI (
oc). -
You have created the
cluster-monitoring-configConfigMapobject. You have optionally created and configured the
user-workload-monitoring-configConfigMapobject in theopenshift-user-workload-monitoringproject. You can add configuration options to thisConfigMapobject for the components that monitor user-defined projects.NoteEvery time you save configuration changes to the
user-workload-monitoring-configConfigMapobject, the pods in theopenshift-user-workload-monitoringproject are redeployed. It can sometimes take a while for these components to redeploy. You can create and configure theConfigMapobject before you first enable monitoring for user-defined projects, to prevent having to redeploy the pods often.
Procedure
Edit the
cluster-monitoring-configConfigMapobject:$ oc -n openshift-monitoring edit configmap cluster-monitoring-config
Add
enableUserWorkload: trueunderdata/config.yaml:apiVersion: v1 kind: ConfigMap metadata: name: cluster-monitoring-config namespace: openshift-monitoring data: config.yaml: | enableUserWorkload: true 1- 1
- When set to
true, theenableUserWorkloadparameter enables monitoring for user-defined projects in a cluster.
Save the file to apply the changes. Monitoring for user-defined projects is then enabled automatically.
WarningWhen changes are saved to the
cluster-monitoring-configConfigMapobject, the pods and other resources in theopenshift-monitoringproject might be redeployed. The running monitoring processes in that project might also be restarted.Check that the
prometheus-operator,prometheus-user-workloadandthanos-ruler-user-workloadpods are running in theopenshift-user-workload-monitoringproject. It might take a short while for the pods to start:$ oc -n openshift-user-workload-monitoring get pod
Example output
NAME                                   READY   STATUS        RESTARTS   AGE
prometheus-operator-6f7b748d5b-t7nbg   2/2     Running       0          3h
prometheus-user-workload-0             4/4     Running       1          3h
prometheus-user-workload-1             4/4     Running       1          3h
thanos-ruler-user-workload-0           3/3     Running       0          3h
thanos-ruler-user-workload-1           3/3     Running       0          3h
3.2. Granting users permission to monitor user-defined projects
Cluster administrators can monitor all core OpenShift Container Platform and user-defined projects.
Cluster administrators can grant developers and other users permission to monitor their own projects. Privileges are granted by assigning one of the following monitoring roles:
-
The monitoring-rules-view role provides read access to
PrometheusRulecustom resources for a project. -
The monitoring-rules-edit role grants a user permission to create, modify, and deleting
PrometheusRulecustom resources for a project. -
The monitoring-edit role grants the same privileges as the
monitoring-rules-editrole. Additionally, it enables a user to create new scrape targets for services or pods. With this role, you can also create, modify, and deleteServiceMonitorandPodMonitorresources.
You can also grant users permission to configure the components that are responsible for monitoring user-defined projects:
-
The user-workload-monitoring-config-edit role in the
openshift-user-workload-monitoringproject enables you to edit theuser-workload-monitoring-configConfigMapobject. With this role, you can edit theConfigMapobject to configure Prometheus, Prometheus Operator and Thanos Ruler for user-defined workload monitoring.
This section provides details on how to assign these roles by using the OpenShift Container Platform web console or the CLI.
3.2.1. Granting user permissions by using the web console
You can grant users permissions to monitor their own projects, by using the OpenShift Container Platform web console.
Prerequisites
-
You have access to the cluster as a user with the
cluster-adminrole. - The user account that you are assigning the role to already exists.
Procedure
- In the Administrator perspective within the OpenShift Container Platform web console, navigate to User Management → Role Bindings → Create Binding.
- In the Binding Type section, select the "Namespace Role Binding" type.
- In the Name field, enter a name for the role binding.
In the Namespace field, select the user-defined project where you want to grant the access.
ImportantThe monitoring role will be bound to the project that you apply in the Namespace field. The permissions that you grant to a user by using this procedure will apply only to the selected project.
-
Select
monitoring-rules-view,monitoring-rules-edit, ormonitoring-editin the Role Name list. - In the Subject section, select User.
- In the Subject Name field, enter the name of the user.
- Select Create to apply the role binding.
3.2.2. Granting user permissions by using the CLI
You can grant users permissions to monitor their own projects, by using the OpenShift CLI (oc).
Prerequisites
-
You have access to the cluster as a user with the
cluster-adminrole. - The user account that you are assigning the role to already exists.
-
You have installed the OpenShift CLI (
oc).
Procedure
Assign a monitoring role to a user for a project:
$ oc policy add-role-to-user <role> <user> -n <namespace> 1- 1
- Substitute
<role>withmonitoring-rules-view,monitoring-rules-edit, ormonitoring-edit.
ImportantWhichever role you choose, you must bind it against a specific project as a cluster administrator.
As an example, substitute
<role>withmonitoring-edit,<user>withjohnsmith, and<namespace>withns1. This assigns the userjohnsmithpermission to set up metrics collection and to create alerting rules in thens1namespace.
3.3. Granting users permission to configure monitoring for user-defined projects
You can grant users permission to configure monitoring for user-defined projects.
Prerequisites
-
You have access to the cluster as a user with the
cluster-adminrole. - The user account that you are assigning the role to already exists.
-
You have installed the OpenShift CLI (
oc).
Procedure
Assign the
user-workload-monitoring-config-editrole to a user in theopenshift-user-workload-monitoringproject:$ oc -n openshift-user-workload-monitoring adm policy add-role-to-user \ user-workload-monitoring-config-edit <user> \ --role-namespace openshift-user-workload-monitoring
3.4. Accessing metrics from outside the cluster for custom applications
Learn how to query Prometheus statistics from the command line when monitoring your own services. You can access monitoring data from outside the cluster with the thanos-querier route.
Prerequisites
- You deployed your own service, following the Enabling monitoring for user-defined projects procedure.
Procedure
Extract a token to connect to Prometheus:
$ SECRET=`oc get secret -n openshift-user-workload-monitoring | grep prometheus-user-workload-token | head -n 1 | awk '{print $1 }'`$ TOKEN=`echo $(oc get secret $SECRET -n openshift-user-workload-monitoring -o json | jq -r '.data.token') | base64 -d`
Extract your route host:
$ THANOS_QUERIER_HOST=`oc get route thanos-querier -n openshift-monitoring -o json | jq -r '.spec.host'`
Query the metrics of your own services in the command line. For example:
$ NAMESPACE=ns1
$ curl -X GET -kG "https://$THANOS_QUERIER_HOST/api/v1/query?" --data-urlencode "query=up{namespace='$NAMESPACE'}" -H "Authorization: Bearer $TOKEN"The output will show you the duration that your application pods have been up.
Example output
{"status":"success","data":{"resultType":"vector","result":[{"metric":{"__name__":"up","endpoint":"web","instance":"10.129.0.46:8080","job":"prometheus-example-app","namespace":"ns1","pod":"prometheus-example-app-68d47c4fb6-jztp2","service":"prometheus-example-app"},"value":[1591881154.748,"1"]}]}}
3.5. Disabling monitoring for user-defined projects
After enabling monitoring for user-defined projects, you can disable it again by setting enableUserWorkload: false in the cluster monitoring ConfigMap object.
Alternatively, you can remove enableUserWorkload: true to disable monitoring for user-defined projects.
Procedure
Edit the
cluster-monitoring-configConfigMapobject:$ oc -n openshift-monitoring edit configmap cluster-monitoring-config
Set
enableUserWorkload:tofalseunderdata/config.yaml:apiVersion: v1 kind: ConfigMap metadata: name: cluster-monitoring-config namespace: openshift-monitoring data: config.yaml: | enableUserWorkload: false
- Save the file to apply the changes. Monitoring for user-defined projects is then disabled automatically.
Check that the
prometheus-operator,prometheus-user-workloadandthanos-ruler-user-workloadpods are terminated in theopenshift-user-workload-monitoringproject. This might take a short while:$ oc -n openshift-user-workload-monitoring get pod
Example output
No resources found in openshift-user-workload-monitoring project.
The user-workload-monitoring-config ConfigMap object in the openshift-user-workload-monitoring project is not automatically deleted when monitoring for user-defined projects is disabled. This is to preserve any custom configurations that you may have created in the ConfigMap object.
3.6. Next steps
Chapter 4. Managing metrics
4.1. Understanding metrics
In OpenShift Container Platform 4.6, cluster components are monitored by scraping metrics exposed through service endpoints. You can also configure metrics collection for user-defined projects. Metrics enable you to monitor how cluster components and your own workloads are performing.
You can define the metrics that you want to provide for your own workloads by using Prometheus client libraries at the application level.
In OpenShift Container Platform, metrics are exposed through an HTTP service endpoint under the /metrics canonical name. You can list all available metrics for a service by running a curl query against http://<endpoint>/metrics. For instance, you can expose a route to the prometheus-example-app example application and then run the following to view all of its available metrics:
$ curl http://<example_app_endpoint>/metrics
Example output
# HELP http_requests_total Count of all HTTP requests
# TYPE http_requests_total counter
http_requests_total{code="200",method="get"} 4
http_requests_total{code="404",method="get"} 2
# HELP version Version information about this binary
# TYPE version gauge
version{version="v0.1.0"} 1
Additional resources
- See the Prometheus documentation for details on Prometheus client libraries.
4.2. Setting up metrics collection for user-defined projects
You can create a ServiceMonitor resource to scrape metrics from a service endpoint in a user-defined project. This assumes that your application uses a Prometheus client library to expose metrics to the /metrics canonical name.
This section describes how to deploy a sample service in a user-defined project and then create a ServiceMonitor resource that defines how that service should be monitored.
4.2.1. Deploying a sample service
To test monitoring of a service in a user-defined project, you can deploy a sample service.
Procedure
-
Create a YAML file for the service configuration. In this example, it is called
prometheus-example-app.yaml. Add the following deployment and service configuration details to the file:
apiVersion: v1
kind: Namespace
metadata:
  name: ns1
---
apiVersion: apps/v1
kind: Deployment
metadata:
  labels:
    app: prometheus-example-app
  name: prometheus-example-app
  namespace: ns1
spec:
  replicas: 1
  selector:
    matchLabels:
      app: prometheus-example-app
  template:
    metadata:
      labels:
        app: prometheus-example-app
    spec:
      containers:
      - image: ghcr.io/rhobs/prometheus-example-app:0.3.0
        imagePullPolicy: IfNotPresent
        name: prometheus-example-app
---
apiVersion: v1
kind: Service
metadata:
  labels:
    app: prometheus-example-app
  name: prometheus-example-app
  namespace: ns1
spec:
  ports:
  - port: 8080
    protocol: TCP
    targetPort: 8080
    name: web
  selector:
    app: prometheus-example-app
  type: ClusterIP
This configuration deploys a service named
prometheus-example-appin the user-definedns1project. This service exposes the customversionmetric.Apply the configuration to the cluster:
$ oc apply -f prometheus-example-app.yaml
It takes some time to deploy the service.
You can check that the pod is running:
$ oc -n ns1 get pod
Example output
NAME                                      READY     STATUS    RESTARTS   AGE
prometheus-example-app-7857545cb7-sbgwq   1/1       Running   0          81m
4.2.2. Specifying how a service is monitored
To use the metrics exposed by your service, you must configure OpenShift Container Platform monitoring to scrape metrics from the /metrics endpoint. You can do this using a ServiceMonitor custom resource definition (CRD) that specifies how a service should be monitored, or a PodMonitor CRD that specifies how a pod should be monitored. The former requires a Service object, while the latter does not, allowing Prometheus to directly scrape metrics from the metrics endpoint exposed by a pod.
In OpenShift Container Platform 4.6, you can use the tlsConfig property for a ServiceMonitor resource to specify the TLS configuration to use when scraping metrics from an endpoint. The tlsConfig property is not yet available for PodMonitor resources. If you need to use a TLS configuration when scraping metrics, you must use ServiceMonitor resource.
This procedure shows you how to create a ServiceMonitor resource for a service in a user-defined project.
Prerequisites
-
You have access to the cluster as a user with the
cluster-adminrole or themonitoring-editrole. - You have enabled monitoring for user-defined projects.
-
For this example, you have deployed the
prometheus-example-appsample service in thens1project.
Procedure
-
Create a YAML file for the
ServiceMonitorresource configuration. In this example, the file is calledexample-app-service-monitor.yaml. Add the following
ServiceMonitorresource configuration details:apiVersion: monitoring.coreos.com/v1 kind: ServiceMonitor metadata: labels: k8s-app: prometheus-example-monitor name: prometheus-example-monitor namespace: ns1 spec: endpoints: - interval: 30s port: web scheme: http selector: matchLabels: app: prometheus-example-appThis defines a
ServiceMonitorresource that scrapes the metrics exposed by theprometheus-example-appsample service, which includes theversionmetric.
A ServiceMonitor resource in a user-defined namespace can only discover services in the same namespace. That is, the namespaceSelector field of the ServiceMonitor resource is always ignored.
Apply the configuration to the cluster:
$ oc apply -f example-app-service-monitor.yaml
It takes some time to deploy the
ServiceMonitorresource.You can check that the
ServiceMonitorresource is running:$ oc -n ns1 get servicemonitor
Example output
NAME                         AGE
prometheus-example-monitor   81m
Additional resources
-
See the Prometheus Operator API documentation for more information on
ServiceMonitorandPodMonitorresources.
Additional resources
4.3. Querying metrics
The OpenShift Container Platform monitoring dashboard enables you to run Prometheus Query Language (PromQL) queries to examine metrics visualized on a plot. This functionality provides information about the state of a cluster and any user-defined workloads that you are monitoring.
As a cluster administrator, you can query metrics for all core OpenShift Container Platform and user-defined projects.
As a developer, you must specify a project name when querying metrics. You must have the required privileges to view metrics for the selected project.
4.3.1. Querying metrics for all projects as a cluster administrator
As a cluster administrator or as a user with view permissions for all projects, you can access metrics for all default OpenShift Container Platform and user-defined projects in the Metrics UI.
Only cluster administrators have access to the third-party UIs provided with OpenShift Container Platform Monitoring.
Prerequisites
-
You have access to the cluster as a user with the
cluster-adminrole or with view permissions for all projects. -
You have installed the OpenShift CLI (
oc).
Procedure
- In the Administrator perspective within the OpenShift Container Platform web console, select Monitoring → Metrics.
- Select Insert Metric at Cursor to view a list of predefined queries.
- To create a custom query, add your Prometheus Query Language (PromQL) query to the Expression field.
- To add multiple queries, select Add Query.
-
To delete a query, select
 next to the query, then choose Delete query.
-
To disable a query from being run, select
next to the query and choose Disable query.
Select Run Queries to run the queries that you have created. The metrics from the queries are visualized on the plot. If a query is invalid, the UI shows an error message.
NoteQueries that operate on large amounts of data might time out or overload the browser when drawing time series graphs. To avoid this, select Hide graph and calibrate your query using only the metrics table. Then, after finding a feasible query, enable the plot to draw the graphs.
- Optional: The page URL now contains the queries you ran. To use this set of queries again in the future, save this URL.
Additional resources
- See the Prometheus query documentation for more information about creating PromQL queries.
4.3.2. Querying metrics for user-defined projects as a developer
You can access metrics for a user-defined project as a developer or as a user with view permissions for the project.
In the Developer perspective, the Metrics UI includes some predefined CPU, memory, bandwidth, and network packet queries for the selected project. You can also run custom Prometheus Query Language (PromQL) queries for CPU, memory, bandwidth, network packet and application metrics for the project.
Developers can only use the Developer perspective and not the Administrator perspective. As a developer, you can only query metrics for one project at a time. Developers cannot access the third-party UIs provided with OpenShift Container Platform monitoring that are for core platform components. Instead, use the Metrics UI for your user-defined project.
Prerequisites
- You have access to the cluster as a developer or as a user with view permissions for the project that you are viewing metrics for.
- You have enabled monitoring for user-defined projects.
- You have deployed a service in a user-defined project.
-
You have created a
ServiceMonitorcustom resource definition (CRD) for the service to define how the service is monitored.
Procedure
- From the Developer perspective in the OpenShift Container Platform web console, select Monitoring → Metrics.
- Select the project that you want to view metrics for in the Project: list.
Choose a query from the Select Query list, or run a custom PromQL query by selecting Show PromQL.
NoteIn the Developer perspective, you can only run one query at a time.
Additional resources
- See the Prometheus query documentation for more information about creating PromQL queries.
Additional resources
- See the Querying metrics for user-defined projects as a developer for details on accessing non-cluster metrics as a developer or a privileged user
4.3.3. Exploring the visualized metrics
After running the queries, the metrics are displayed on an interactive plot. The X-axis in the plot represents time and the Y-axis represents metrics values. Each metric is shown as a colored line on the graph. You can manipulate the plot interactively and explore the metrics.
Procedure
In the Administrator perspective:
Initially, all metrics from all enabled queries are shown on the plot. You can select which metrics are shown.
NoteBy default, the query table shows an expanded view that lists every metric and its current value. You can select ˅ to minimize the expanded view for a query.
-
To hide all metrics from a query, click
for the query and click Hide all series.
- To hide a specific metric, go to the query table and click the colored square near the metric name.
-
To hide all metrics from a query, click
To zoom into the plot and change the time range, do one of the following:
- Visually select the time range by clicking and dragging on the plot horizontally.
- Use the menu in the left upper corner to select the time range.
- To reset the time range, select Reset Zoom.
- To display outputs for all queries at a specific point in time, hold the mouse cursor on the plot at that point. The query outputs will appear in a pop-up box.
- To hide the plot, select Hide Graph.
In the Developer perspective:
To zoom into the plot and change the time range, do one of the following:
- Visually select the time range by clicking and dragging on the plot horizontally.
- Use the menu in the left upper corner to select the time range.
- To reset the time range, select Reset Zoom.
- To display outputs for all queries at a specific point in time, hold the mouse cursor on the plot at that point. The query outputs will appear in a pop-up box.
Additional resources
- See the Querying metrics section on using the PromQL interface
4.4. Next steps
Chapter 5. Managing alerts
In OpenShift Container Platform 4.6, the Alerting UI enables you to manage alerts, silences, and alerting rules.
- Alerting rules. Alerting rules contain a set of conditions that outline a particular state within a cluster. Alerts are triggered when those conditions are true. An alerting rule can be assigned a severity that defines how the alerts are routed.
- Alerts. An alert is fired when the conditions defined in an alerting rule are true. Alerts provide a notification that a set of circumstances are apparent within an OpenShift Container Platform cluster.
- Silences. A silence can be applied to an alert to prevent notifications from being sent when the conditions for an alert are true. You can mute an alert after the initial notification, while you work on resolving the underlying issue.
The alerts, silences, and alerting rules that are available in the Alerting UI relate to the projects that you have access to. For example, if you are logged in with cluster-administrator privileges, all alerts, silences, and alerting rules are accessible.
5.1. Accessing the Alerting UI in the Administrator and Developer perspectives
The Alerting UI is accessible through the Administrator perspective and the Developer perspective in the OpenShift Container Platform web console.
- In the Administrator perspective, select Monitoring → Alerting. The three main pages in the Alerting UI in this perspective are the Alerts, Silences, and Alerting Rules pages.
- In the Developer perspective, select Monitoring → <project_name> → Alerts. In this perspective, alerts, silences, and alerting rules are all managed from the Alerts page. The results shown in the Alerts page are specific to the selected project.
In the Developer perspective, you can select from core OpenShift Container Platform and user-defined projects that you have access to in the Project: list. However, alerts, silences, and alerting rules relating to core OpenShift Container Platform projects are not displayed if you do not have cluster-admin privileges.
5.2. Searching and filtering alerts, silences, and alerting rules
You can filter the alerts, silences, and alerting rules that are displayed in the Alerting UI. This section provides a description of each of the available filtering options.
Understanding alert filters
In the Administrator perspective, the Alerts page in the Alerting UI provides details about alerts relating to default OpenShift Container Platform and user-defined projects. The page includes a summary of severity, state, and source for each alert. The time at which an alert went into its current state is also shown.
You can filter by alert state, severity, and source. By default, only Platform alerts that are Firing are displayed. The following describes each alert filtering option:
Alert State filters:
-
Firing. The alert is firing because the alert condition is true and the optional
forduration has passed. The alert will continue to fire as long as the condition remains true. - Pending. The alert is active but is waiting for the duration that is specified in the alerting rule before it fires.
- Silenced. The alert is now silenced for a defined time period. Silences temporarily mute alerts based on a set of label selectors that you define. Notifications will not be sent for alerts that match all the listed values or regular expressions.
-
Firing. The alert is firing because the alert condition is true and the optional
Severity filters:
- Critical. The condition that triggered the alert could have a critical impact. The alert requires immediate attention when fired and is typically paged to an individual or to a critical response team.
- Warning. The alert provides a warning notification about something that might require attention in order to prevent a problem from occurring. Warnings are typically routed to a ticketing system for non-immediate review.
- Info. The alert is provided for informational purposes only.
- None. The alert has no defined severity.
- You can also create custom severity definitions for alerts relating to user-defined projects.
Source filters:
- Platform. Platform-level alerts relate only to default OpenShift Container Platform projects. These projects provide core OpenShift Container Platform functionality.
- User. User alerts relate to user-defined projects. These alerts are user-created and are customizable. User-defined workload monitoring can be enabled post-installation to provide observability into your own workloads.
Understanding silence filters
In the Administrator perspective, the Silences page in the Alerting UI provides details about silences applied to alerts in default OpenShift Container Platform and user-defined projects. The page includes a summary of the state of each silence and the time at which a silence ends.
You can filter by silence state. By default, only Active and Pending silences are displayed. The following describes each silence state filter option:
Silence State filters:
- Active. The silence is active and the alert will be muted until the silence is expired.
- Pending. The silence has been scheduled and it is not yet active.
- Expired. The silence has expired and notifications will be sent if the conditions for an alert are true.
Understanding alerting rule filters
In the Administrator perspective, the Alerting Rules page in the Alerting UI provides details about alerting rules relating to default OpenShift Container Platform and user-defined projects. The page includes a summary of the state, severity, and source for each alerting rule.
You can filter alerting rules by alert state, severity, and source. By default, only Platform alerting rules are displayed. The following describes each alerting rule filtering option:
Alert State filters:
-
Firing. The alert is firing because the alert condition is true and the optional
forduration has passed. The alert will continue to fire as long as the condition remains true. - Pending. The alert is active but is waiting for the duration that is specified in the alerting rule before it fires.
- Silenced. The alert is now silenced for a defined time period. Silences temporarily mute alerts based on a set of label selectors that you define. Notifications will not be sent for alerts that match all the listed values or regular expressions.
- Not Firing. The alert is not firing.
-
Firing. The alert is firing because the alert condition is true and the optional
Severity filters:
- Critical. The conditions defined in the alerting rule could have a critical impact. When true, these conditions require immediate attention. Alerts relating to the rule are typically paged to an individual or to a critical response team.
- Warning. The conditions defined in the alerting rule might require attention in order to prevent a problem from occurring. Alerts relating to the rule are typically routed to a ticketing system for non-immediate review.
- Info. The alerting rule provides informational alerts only.
- None. The alerting rule has no defined severity.
- You can also create custom severity definitions for alerting rules relating to user-defined projects.
Source filters:
- Platform. Platform-level alerting rules relate only to default OpenShift Container Platform projects. These projects provide core OpenShift Container Platform functionality.
- User. User-defined workload alerting rules relate to user-defined projects. These alerting rules are user-created and are customizable. User-defined workload monitoring can be enabled post-installation to provide observability into your own workloads.
Searching and filtering alerts, silences, and alerting rules in the Developer perspective
In the Developer perspective, the Alerts page in the Alerting UI provides a combined view of alerts and silences relating to the selected project. A link to the governing alerting rule is provided for each displayed alert.
In this view, you can filter by alert state and severity. By default, all alerts in the selected project are displayed if you have permission to access the project. These filters are the same as those described for the Administrator perspective.
5.3. Getting information about alerts, silences, and alerting rules
The Alerting UI provides detailed information about alerts and their governing alerting rules and silences.
Prerequisites
- You have access to the cluster as a developer or as a user with view permissions for the project that you are viewing metrics for.
Procedure
To obtain information about alerts in the Administrator perspective:
- Open the OpenShift Container Platform web console and navigate to the Monitoring → Alerting → Alerts page.
- Optional: Search for alerts by name using the Name field in the search list.
- Optional: Filter alerts by state, severity, and source by selecting filters in the Filter list.
- Optional: Sort the alerts by clicking one or more of the Name, Severity, State, and Source column headers.
Select the name of an alert to navigate to its Alert Details page. The page includes a graph that illustrates alert time series data. It also provides information about the alert, including:
- A description of the alert
- Messages associated with the alerts
- Labels attached to the alert
- A link to its governing alerting rule
- Silences for the alert, if any exist
To obtain information about silences in the Administrator perspective:
- Navigate to the Monitoring → Alerting → Silences page.
- Optional: Filter the silences by name using the Search by name field.
- Optional: Filter silences by state by selecting filters in the Filter list. By default, Active and Pending filters are applied.
- Optional: Sort the silences by clicking one or more of the Name, Firing Alerts, and State column headers.
Select the name of a silence to navigate to its Silence Details page. The page includes the following details:
- Alert specification
- Start time
- End time
- Silence state
- Number and list of firing alerts
To obtain information about alerting rules in the Administrator perspective:
- Navigate to the Monitoring → Alerting → Alerting Rules page.
- Optional: Filter alerting rules by state, severity, and source by selecting filters in the Filter list.
- Optional: Sort the alerting rules by clicking one or more of the Name, Severity, Alert State, and Source column headers.
Select the name of an alerting rule to navigate to its Alerting Rule Details page. The page provides the following details about the alerting rule:
- Alerting rule name, severity, and description
- The expression that defines the condition for firing the alert
- The time for which the condition should be true for an alert to fire
- A graph for each alert governed by the alerting rule, showing the value with which the alert is firing
- A table of all alerts governed by the alerting rule
To obtain information about alerts, silences, and alerting rules in the Developer perspective:
- Navigate to the Monitoring → <project_name> → Alerts page.
View details for an alert, silence, or an alerting rule:
- Alert Details can be viewed by selecting > to the left of an alert name and then selecting the alert in the list.
Silence Details can be viewed by selecting a silence in the Silenced By section of the Alert Details page. The Silence Details page includes the following information:
- Alert specification
- Start time
- End time
- Silence state
- Number and list of firing alerts
-
Alerting Rule Details can be viewed by selecting View Alerting Rule in the
menu on the right of an alert in the Alerts page.
Only alerts, silences, and alerting rules relating to the selected project are displayed in the Developer perspective.
5.4. Managing alerting rules
OpenShift Container Platform monitoring ships with a set of default alerting rules. As a cluster administrator, you can view the default alerting rules.
In OpenShift Container Platform 4.6, you can create, view, edit, and remove alerting rules in user-defined projects.
Alerting rule considerations
- The default alerting rules are used specifically for the OpenShift Container Platform cluster.
- Some alerting rules intentionally have identical names. They send alerts about the same event with different thresholds, different severity, or both.
- Inhibition rules prevent notifications for lower severity alerts that are firing when a higher severity alert is also firing.
5.4.1. Optimizing alerting for user-defined projects
You can optimize alerting for your own projects by considering the following recommendations when creating alerting rules:
- Minimize the number of alerting rules that you create for your project. Create alerting rules that notify you of conditions that impact you. It is more difficult to notice relevant alerts if you generate many alerts for conditions that do not impact you.
- Create alerting rules for symptoms instead of causes. Create alerting rules that notify you of conditions regardless of the underlying cause. The cause can then be investigated. You will need many more alerting rules if each relates only to a specific cause. Some causes are then likely to be missed.
- Plan before you write your alerting rules. Determine what symptoms are important to you and what actions you want to take if they occur. Then build an alerting rule for each symptom.
- Provide clear alert messaging. State the symptom and recommended actions in the alert message.
- Include severity levels in your alerting rules. The severity of an alert depends on how you need to react if the reported symptom occurs. For example, a critical alert should be triggered if a symptom requires immediate attention by an individual or a critical response team.
Optimize alert routing. Deploy an alerting rule directly on the Prometheus instance in the
openshift-user-workload-monitoringproject if the rule does not query default OpenShift Container Platform metrics. This reduces latency for alerting rules and minimizes the load on monitoring components.WarningDefault OpenShift Container Platform metrics for user-defined projects provide information about CPU and memory usage, bandwidth statistics, and packet rate information. Those metrics cannot be included in an alerting rule if you route the rule directly to the Prometheus instance in the
openshift-user-workload-monitoringproject. Alerting rule optimization should be used only if you have read the documentation and have a comprehensive understanding of the monitoring architecture.
Additional resources
- See the Prometheus alerting documentation for further guidelines on optimizing alerts
- See Monitoring overview for details about OpenShift Container Platform 4.6 monitoring architecture
5.4.2. Creating alerting rules for user-defined projects
You can create alerting rules for user-defined projects. Those alerting rules will fire alerts based on the values of chosen metrics.
Prerequisites
- You have enabled monitoring for user-defined projects.
-
You are logged in as a user that has the
monitoring-rules-editrole for the project where you want to create an alerting rule. -
You have installed the OpenShift CLI (
oc).
Procedure
-
Create a YAML file for alerting rules. In this example, it is called
example-app-alerting-rule.yaml. Add an alerting rule configuration to the YAML file. For example:
NoteWhen you create an alerting rule, a project label is enforced on it if a rule with the same name exists in another project.
apiVersion: monitoring.coreos.com/v1
kind: PrometheusRule
metadata:
  name: example-alert
  namespace: ns1
spec:
  groups:
  - name: example
    rules:
    - alert: VersionAlert
      expr: version{job="prometheus-example-app"} == 0
This configuration creates an alerting rule named
example-alert. The alerting rule fires an alert when theversionmetric exposed by the sample service becomes0.ImportantA user-defined alerting rule can include metrics for its own project and cluster metrics. You cannot include metrics for another user-defined project.
For example, an alerting rule for the user-defined project
ns1can have metrics fromns1and cluster metrics, such as the CPU and memory metrics. However, the rule cannot include metrics fromns2.Additionally, you cannot create alerting rules for the
openshift-*core OpenShift projects. OpenShift Container Platform monitoring by default provides a set of alerting rules for these projects.Apply the configuration file to the cluster:
$ oc apply -f example-app-alerting-rule.yaml
It takes some time to create the alerting rule.
5.4.3. Reducing latency for alerting rules that do not query platform metrics
If an alerting rule for a user-defined project does not query default cluster metrics, you can deploy the rule directly on the Prometheus instance in the openshift-user-workload-monitoring project. This reduces latency for alerting rules by bypassing Thanos Ruler when it is not required. This also helps to minimize the overall load on monitoring components.
Default OpenShift Container Platform metrics for user-defined projects provide information about CPU and memory usage, bandwidth statistics, and packet rate information. Those metrics cannot be included in an alerting rule if you deploy the rule directly to the Prometheus instance in the openshift-user-workload-monitoring project. The procedure outlined in this section should only be used if you have read the documentation and have a comprehensive understanding of the monitoring architecture.
Prerequisites
- You have enabled monitoring for user-defined projects.
-
You are logged in as a user that has the
monitoring-rules-editrole for the project where you want to create an alerting rule. -
You have installed the OpenShift CLI (
oc).
Procedure
-
Create a YAML file for alerting rules. In this example, it is called
example-app-alerting-rule.yaml. Add an alerting rule configuration to the YAML file that includes a label with the key
openshift.io/prometheus-rule-evaluation-scopeand valueleaf-prometheus. For example:apiVersion: monitoring.coreos.com/v1 kind: PrometheusRule metadata: name: example-alert namespace: ns1 labels: openshift.io/prometheus-rule-evaluation-scope: leaf-prometheus spec: groups: - name: example rules: - alert: VersionAlert expr: version{job="prometheus-example-app"} == 0
If that label is present, the alerting rule is deployed on the Prometheus instance in the openshift-user-workload-monitoring project. If the label is not present, the alerting rule is deployed to Thanos Ruler.
Apply the configuration file to the cluster:
$ oc apply -f example-app-alerting-rule.yaml
It takes some time to create the alerting rule.
- See Monitoring overview for details about OpenShift Container Platform 4.6 monitoring architecture.
5.4.4. Accessing alerting rules for user-defined projects
To list alerting rules for a user-defined project, you must have been assigned the monitoring-rules-view role for the project.
Prerequisites
- You have enabled monitoring for user-defined projects.
-
You are logged in as a user that has the
monitoring-rules-viewrole for your project. -
You have installed the OpenShift CLI (
oc).
Procedure
You can list alerting rules in
<project>:$ oc -n <project> get prometheusrule
To list the configuration of an alerting rule, run the following:
$ oc -n <project> get prometheusrule <rule> -o yaml
5.4.5. Listing alerting rules for all projects in a single view
As a cluster administrator, you can list alerting rules for core OpenShift Container Platform and user-defined projects together in a single view.
Prerequisites
-
You have access to the cluster as a user with the
cluster-adminrole. -
You have installed the OpenShift CLI (
oc).
Procedure
- In the Administrator perspective, navigate to Monitoring → Alerting → Alerting Rules.
Select the Platform and User sources in the Filter drop-down menu.
NoteThe Platform source is selected by default.
5.4.6. Removing alerting rules for user-defined projects
You can remove alerting rules for user-defined projects.
Prerequisites
- You have enabled monitoring for user-defined projects.
-
You are logged in as a user that has the
monitoring-rules-editrole for the project where you want to create an alerting rule. -
You have installed the OpenShift CLI (
oc).
Procedure
To remove rule
<foo>in<namespace>, run the following:$ oc -n <namespace> delete prometheusrule <foo>
Additional resources
- See the Alertmanager documentation
5.5. Managing silences
You can create a silence to stop receiving notifications about an alert when it is firing. It might be useful to silence an alert after being first notified, while you resolve the underlying issue.
When creating a silence, you must specify whether it becomes active immediately or at a later time. You must also set a duration period after which the silence expires.
You can view, edit, and expire existing silences.
5.5.1. Silencing alerts
You can either silence a specific alert or silence alerts that match a specification that you define.
Prerequisites
-
You have access to the cluster as a developer or as a user with
editpermissions for the project that you are viewing metrics for.
Procedure
To silence a specific alert:
In the Administrator perspective:
- Navigate to the Monitoring → Alerting → Alerts page of the OpenShift Container Platform web console.
-
For the alert that you want to silence, select the
in the right-hand column and select Silence Alert. The Silence Alert form will appear with a pre-populated specification for the chosen alert.
- Optional: Modify the silence.
- You must add a comment before creating the silence.
- To create the silence, select Silence.
In the Developer perspective:
- Navigate to the Monitoring → <project_name> → Alerts page in the OpenShift Container Platform web console.
- Expand the details for an alert by selecting > to the left of the alert name. Select the name of the alert in the expanded view to open the Alert Details page for the alert.
- Select Silence Alert. The Silence Alert form will appear with a prepopulated specification for the chosen alert.
- Optional: Modify the silence.
- You must add a comment before creating the silence.
- To create the silence, select Silence.
To silence a set of alerts by creating an alert specification in the Administrator perspective:
- Navigate to the Monitoring → Alerting → Silences page in the OpenShift Container Platform web console.
- Select Create Silence.
- Set the schedule, duration, and label details for an alert in the Create Silence form. You must also add a comment for the silence.
- To create silences for alerts that match the label sectors that you entered in the previous step, select Silence.
5.5.2. Editing silences
You can edit a silence, which will expire the existing silence and create a new one with the changed configuration.
Procedure
To edit a silence in the Administrator perspective:
- Navigate to the Monitoring → Alerting → Silences page.
For the silence you want to modify, select the
in the last column and choose Edit silence.
Alternatively, you can select Actions → Edit Silence in the Silence Details page for a silence.
- In the Edit Silence page, enter your changes and select Silence. This will expire the existing silence and create one with the chosen configuration.
To edit a silence in the Developer perspective:
- Navigate to the Monitoring → <project_name> → Alerts page.
- Expand the details for an alert by selecting > to the left of the alert name. Select the name of the alert in the expanded view to open the Alert Details page for the alert.
- Select the name of a silence in the Silenced By section in that page to navigate to the Silence Details page for the silence.
- Select the name of a silence to navigate to its Silence Details page.
- Select Actions → Edit Silence in the Silence Details page for a silence.
- In the Edit Silence page, enter your changes and select Silence. This will expire the existing silence and create one with the chosen configuration.
5.5.3. Expiring silences
You can expire a silence. Expiring a silence deactivates it forever.
Procedure
To expire a silence in the Administrator perspective:
- Navigate to the Monitoring → Alerting → Silences page.
For the silence you want to modify, select the
in the last column and choose Expire silence.
Alternatively, you can select Actions → Expire Silence in the Silence Details page for a silence.
To expire a silence in the Developer perspective:
- Navigate to the Monitoring → <project_name> → Alerts page.
- Expand the details for an alert by selecting > to the left of the alert name. Select the name of the alert in the expanded view to open the Alert Details page for the alert.
- Select the name of a silence in the Silenced By section in that page to navigate to the Silence Details page for the silence.
- Select the name of a silence to navigate to its Silence Details page.
- Select Actions → Expire Silence in the Silence Details page for a silence.
5.6. Sending notifications to external systems
In OpenShift Container Platform 4.6, firing alerts can be viewed in the Alerting UI. Alerts are not configured by default to be sent to any notification systems. You can configure OpenShift Container Platform to send alerts to the following receiver types:
- PagerDuty
- Webhook
- Slack
Routing alerts to receivers enables you to send timely notifications to the appropriate teams when failures occur. For example, critical alerts require immediate attention and are typically paged to an individual or a critical response team. Alerts that provide non-critical warning notifications might instead be routed to a ticketing system for non-immediate review.
Checking that alerting is operational by using the watchdog alert
OpenShift Container Platform monitoring includes a watchdog alert that fires continuously. Alertmanager repeatedly sends watchdog alert notifications to configured notification providers. The provider is usually configured to notify an administrator when it stops receiving the watchdog alert. This mechanism helps you quickly identify any communication issues between Alertmanager and the notification provider.
5.6.1. Configuring alert receivers
You can configure alert receivers to ensure that you learn about important issues with your cluster.
Prerequisites
-
You have access to the cluster as a user with the
cluster-adminrole.
Procedure
In the Administrator perspective, navigate to Administration → Cluster Settings → Global Configuration → Alertmanager.
NoteAlternatively, you can navigate to the same page through the notification drawer. Select the bell icon at the top right of the OpenShift Container Platform web console and choose Configure in the AlertmanagerReceiverNotConfigured alert.
- Select Create Receiver in the Receivers section of the page.
- In the Create Receiver form, add a Receiver Name and choose a Receiver Type from the list.
Edit the receiver configuration:
For PagerDuty receivers:
- Choose an integration type and add a PagerDuty integration key.
- Add the URL of your PagerDuty installation.
- Select Show advanced configuration if you want to edit the client and incident details or the severity specification.
For webhook receivers:
- Add the endpoint to send HTTP POST requests to.
- Select Show advanced configuration if you want to edit the default option to send resolved alerts to the receiver.
For email receivers:
- Add the email address to send notifications to.
- Add SMTP configuration details, including the address to send notifications from, the smarthost and port number used for sending emails, the hostname of the SMTP server, and authentication details.
- Choose whether TLS is required.
- Select Show advanced configuration if you want to edit the default option not to send resolved alerts to the receiver or edit the body of email notifications configuration.
For Slack receivers:
- Add the URL of the Slack webhook.
- Add the Slack channel or user name to send notifications to.
- Select Show advanced configuration if you want to edit the default option not to send resolved alerts to the receiver or edit the icon and username configuration. You can also choose whether to find and link channel names and usernames.
By default, firing alerts with labels that match all of the selectors will be sent to the receiver. If you want label values for firing alerts to be matched exactly before they are sent to the receiver:
- Add routing label names and values in the Routing Labels section of the form.
- Select Regular Expression if want to use a regular expression.
- Select Add Label to add further routing labels.
- Select Create to create the receiver.
5.7. Applying a custom Alertmanager configuration
You can overwrite the default Alertmanager configuration by editing the alertmanager-main secret inside the openshift-monitoring project.
Prerequisites
-
You have access to the cluster as a user with the
cluster-adminrole.
Procedure
To change the Alertmanager configuration from the CLI:
Print the currently active Alertmanager configuration into file
alertmanager.yaml:$ oc -n openshift-monitoring get secret alertmanager-main --template='{{ index .data "alertmanager.yaml" }}' | base64 --decode > alertmanager.yamlEdit the configuration in
alertmanager.yaml:global: resolve_timeout: 5m route: group_wait: 30s group_interval: 5m repeat_interval: 12h receiver: default routes: - match: alertname: Watchdog repeat_interval: 5m receiver: watchdog - match: service: <your_service> 1 routes: - match: <your_matching_rules> 2 receiver: <receiver> 3 receivers: - name: default - name: watchdog - name: <receiver> # <receiver_configuration>The following Alertmanager configuration example configures PagerDuty as an alert receiver:
global:
  resolve_timeout: 5m
route:
  group_wait: 30s
  group_interval: 5m
  repeat_interval: 12h
  receiver: default
  routes:
  - match:
      alertname: Watchdog
    repeat_interval: 5m
    receiver: watchdog
  - match: service: example-app routes: - match: severity: critical receiver: team-frontend-page
receivers:
- name: default
- name: watchdog
- name: team-frontend-page pagerduty_configs: - service_key: "your-key"
With this configuration, alerts of
criticalseverity that are fired by theexample-appservice are sent using theteam-frontend-pagereceiver. Typically these types of alerts would be paged to an individual or a critical response team.Apply the new configuration in the file:
$ oc -n openshift-monitoring create secret generic alertmanager-main --from-file=alertmanager.yaml --dry-run=client -o=yaml | oc -n openshift-monitoring replace secret --filename=-
To change the Alertmanager configuration from the OpenShift Container Platform web console:
- Navigate to the Administration → Cluster Settings → Global Configuration → Alertmanager → YAML page of the web console.
- Modify the YAML configuration file.
- Select Save.
Additional resources
- See the PagerDuty official site for more information on PagerDuty
-
See the PagerDuty Prometheus Integration Guide to learn how to retrieve the
service_key - See Alertmanager configuration for configuring alerting through different alert receivers
5.8. Next steps
Chapter 6. Reviewing monitoring dashboards
OpenShift Container Platform 4.6 provides a comprehensive set of monitoring dashboards that help you understand the state of cluster components and user-defined workloads.
In the Administrator perspective you can access dashboards for core OpenShift Container Platform components, including:
- etcd
- Kubernetes compute resources
- Kubernetes network resources
- Prometheus
- USE method dashboards relating to cluster and node performance
Figure 6.1. Example dashboard in the Administrator perspective

In the Developer perspective you can access dashboards that provide the following statistics for a selected project:
- CPU usage
- Memory usage
- Bandwidth information
- Packet rate information
Figure 6.2. Example dashboard in the Developer perspective
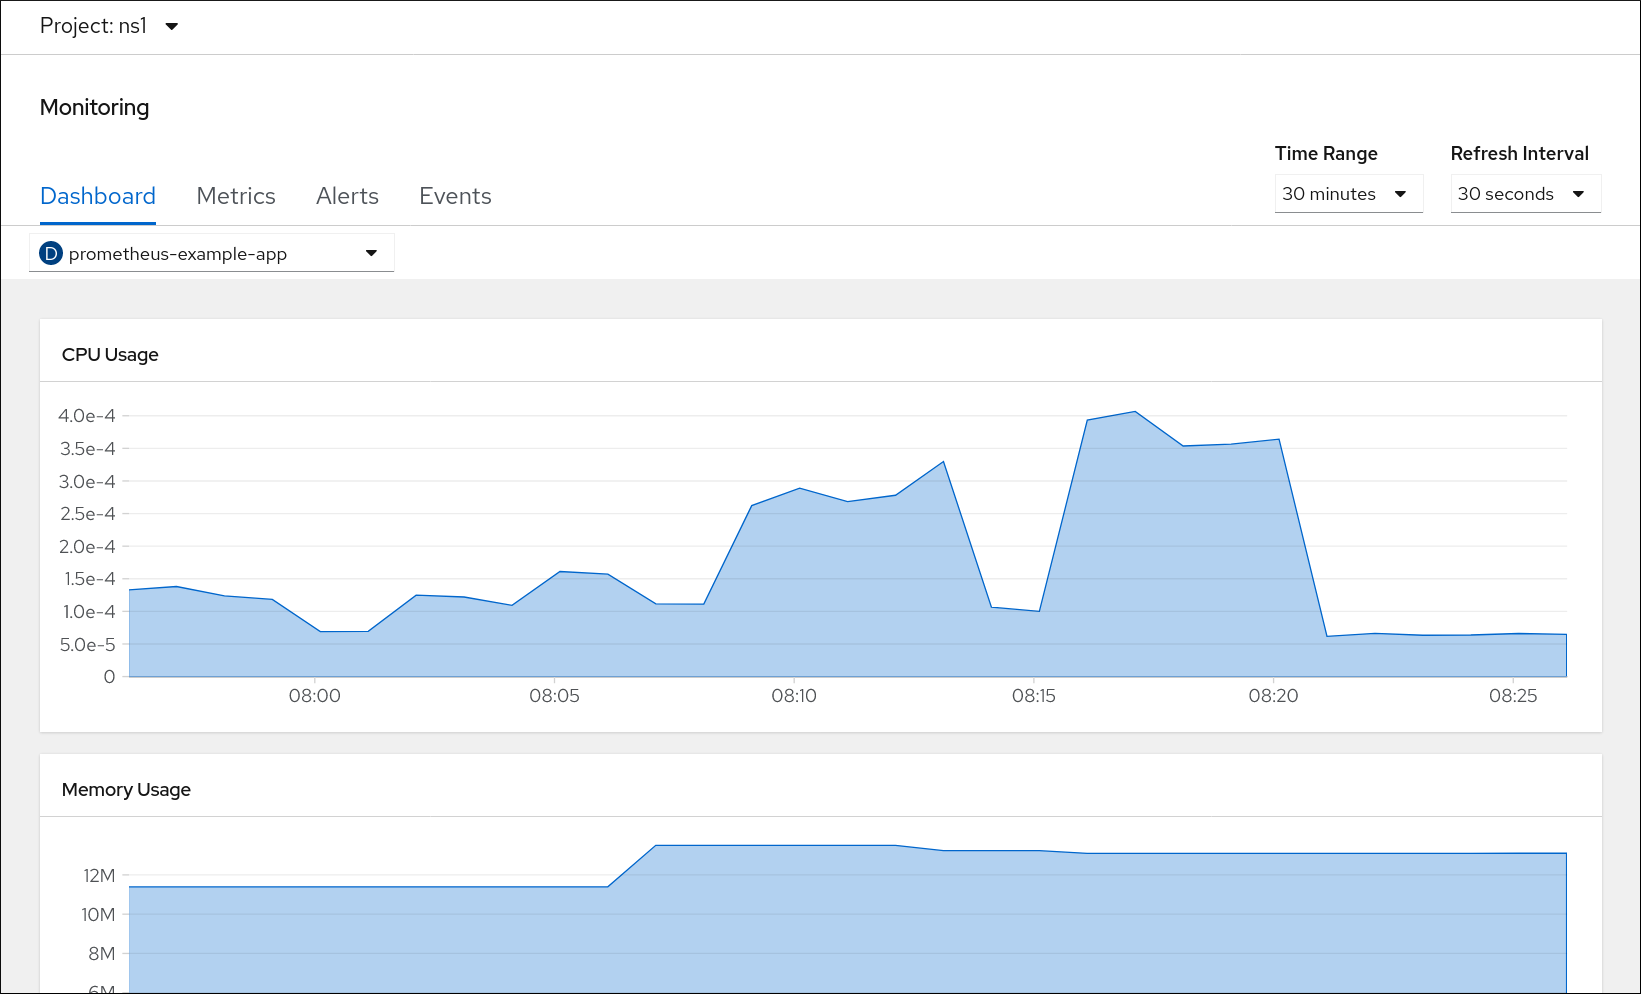
In the Developer perspective, you can view dashboards for only one project at a time.
6.1. Reviewing monitoring dashboards as a cluster administrator
In the Administrator perspective, you can view dashboards relating to core OpenShift Container Platform cluster components.
Prerequisites
-
You have access to the cluster as a user with the
cluster-adminrole.
Procedure
- In the Administrator perspective in the OpenShift Container Platform web console, navigate to Monitoring → Dashboards.
- Choose a dashboard in the Dashboard list. Some dashboards, such as etcd and Prometheus dashboards, produce additional sub-menus when selected.
- Optional: Select a time range for the graphs in the Time Range list.
- Optional: Select a Refresh Interval.
- Hover over each of the graphs within a dashboard to display detailed information about specific items.
6.2. Reviewing monitoring dashboards as a developer
In the Developer perspective, you can view dashboards relating to a selected project. You must have access to monitor a project to view dashboard information for it.
Prerequisites
- You have access to the cluster as a developer or as a user with view permissions for the project that you are viewing the dashboard for.
Procedure
- In the Developer perspective in the OpenShift Container Platform web console, navigate to Monitoring → Dashboard.
- Choose a project in the Project: list.
- Choose a workload in the All Workloads list.
- Optional: Select a time range for the graphs in the Time Range list.
- Optional: Select a Refresh Interval.
- Hover over each of the graphs within a dashboard to display detailed information about specific items.
Additional resources
6.3. Next steps
Chapter 7. Accessing third-party UIs
Integrated Metrics, Alerting, and Dashboard UIs are provided in the OpenShift Container Platform web console. See the following for details on using these integrated UIs:
OpenShift Container Platform also provides access to the Prometheus, Alertmanager, and Grafana third-party interfaces.
Default access to the third-party monitoring interfaces might be removed in future OpenShift Container Platform releases. Following this, you will need to use port-forwarding to access them.
The Grafana instance that is provided with the OpenShift Container Platform monitoring stack, along with its dashboards, is read-only.
The Grafana dashboard includes Kubernetes and cluster-monitoring metrics only. Additional platform components are included in Monitoring → Dashboards in the OpenShift Container Platform web console.
7.1. Accessing third-party monitoring UIs by using the web console
You can access the Alertmanager, Grafana, Prometheus, and Thanos Querier web UIs through the OpenShift Container Platform web console.
Prerequisites
-
You have access to the cluster as a user with the
cluster-adminrole.
Procedure
In the Administrator perspective, navigate to Networking → Routes.
NoteAccess to the third-party Alertmanager, Grafana, Prometheus, and Thanos Querier UIs is not available from the Developer perspective. Instead, use the Metrics UI link in the Developer perspective, which includes some predefined CPU, memory, bandwidth, and network packet queries for the selected project.
-
Select the
openshift-monitoringproject in the Project list. Access a third-party monitoring UI:
-
Select the URL in the
alertmanager-mainrow to open the login page for the Alertmanager UI. -
Select the URL in the
grafanarow to open the login page for the Grafana UI. -
Select the URL in the
prometheus-k8srow to open the login page for the Prometheus UI. -
Select the URL in the
thanos-querierrow to open the login page for the Thanos Querier UI.
-
Select the URL in the
- Choose Log in with OpenShift to log in using your OpenShift Container Platform credentials.
7.2. Accessing third-party monitoring UIs by using the CLI
You can obtain URLs for the Prometheus, Alertmanager, and Grafana web UIs by using the OpenShift CLI (oc) tool.
Prerequisites
-
You have access to the cluster as a user with the
cluster-adminrole. -
You have installed the OpenShift CLI (
oc).
Procedure
Run the following to list routes for the
openshift-monitoringproject:$ oc -n openshift-monitoring get routes
Example output
NAME                HOST/PORT                                                     ...
alertmanager-main   alertmanager-main-openshift-monitoring.apps._url_.openshift.com ...
grafana             grafana-openshift-monitoring.apps._url_.openshift.com           ...
prometheus-k8s      prometheus-k8s-openshift-monitoring.apps._url_.openshift.com    ...
thanos-querier      thanos-querier-openshift-monitoring.apps._url_.openshift.com    ...
-
Navigate to a
HOST/PORTroute by using a web browser. - Select Log in with OpenShift to log in using your OpenShift credentials.
The monitoring routes are managed by the Cluster Monitoring Operator and they cannot be modified by the user.
7.3. Next steps
Chapter 8. Exposing custom application metrics for autoscaling
You can export custom application metrics for the horizontal pod autoscaler.
Prometheus Adapter is a Technology Preview feature only. Technology Preview features are not supported with Red Hat production service level agreements (SLAs) and might not be functionally complete. Red Hat does not recommend using them in production. These features provide early access to upcoming product features, enabling customers to test functionality and provide feedback during the development process.
For more information about the support scope of Red Hat Technology Preview features, see https://access.redhat.com/support/offerings/techpreview/.
8.1. Exposing custom application metrics for horizontal pod autoscaling
You can use the prometheus-adapter resource to expose custom application metrics for the horizontal pod autoscaler.
Prerequisites
-
You have a custom Prometheus instance installed as a Prometheus pod managed by a deployment or
StatefulSetobject but not by a Prometheus custom resource (CR). You have installed the custom Prometheus instance in a user-defined
custom-prometheusproject.ImportantCustom Prometheus instances and the Prometheus Operator installed through Operator Lifecycle Manager (OLM) are not compatible with user-defined monitoring if it is enabled. Therefore, custom Prometheus instances that are installed as a Prometheus custom resource (CR) managed by the OLM Prometheus Operator are not supported in OpenShift Container Platform.
-
You have deployed an application and a service in a user-defined project. In this example, it is presumed that the application and its service monitor were installed in a user-defined
custom-prometheusproject. -
You have installed the OpenShift CLI (
oc).
Procedure
-
Create a YAML file for your configuration. In this example, the file is called
deploy.yaml. Add configuration details for creating the service account, roles, and role bindings for
prometheus-adapter:kind: ServiceAccount apiVersion: v1 metadata: name: custom-metrics-apiserver namespace: custom-prometheus --- apiVersion: rbac.authorization.k8s.io/v1 kind: ClusterRole metadata: name: custom-metrics-server-resources rules: - apiGroups: - custom.metrics.k8s.io resources: ["*"] verbs: ["*"] --- apiVersion: rbac.authorization.k8s.io/v1 kind: ClusterRole metadata: name: custom-metrics-resource-reader rules: - apiGroups: - "" resources: - namespaces - pods - services verbs: - get - list --- apiVersion: rbac.authorization.k8s.io/v1 kind: ClusterRoleBinding metadata: name: custom-metrics:system:auth-delegator roleRef: apiGroup: rbac.authorization.k8s.io kind: ClusterRole name: system:auth-delegator subjects: - kind: ServiceAccount name: custom-metrics-apiserver namespace: custom-prometheus --- apiVersion: rbac.authorization.k8s.io/v1 kind: RoleBinding metadata: name: custom-metrics-auth-reader namespace: kube-system roleRef: apiGroup: rbac.authorization.k8s.io kind: Role name: extension-apiserver-authentication-reader subjects: - kind: ServiceAccount name: custom-metrics-apiserver namespace: custom-prometheus --- apiVersion: rbac.authorization.k8s.io/v1 kind: ClusterRoleBinding metadata: name: custom-metrics-resource-reader roleRef: apiGroup: rbac.authorization.k8s.io kind: ClusterRole name: custom-metrics-resource-reader subjects: - kind: ServiceAccount name: custom-metrics-apiserver namespace: custom-prometheus --- apiVersion: rbac.authorization.k8s.io/v1 kind: ClusterRoleBinding metadata: name: hpa-controller-custom-metrics roleRef: apiGroup: rbac.authorization.k8s.io kind: ClusterRole name: custom-metrics-server-resources subjects: - kind: ServiceAccount name: horizontal-pod-autoscaler namespace: kube-system ---
Add configuration details for the custom metrics for
prometheus-adapter:apiVersion: v1 kind: ConfigMap metadata: name: adapter-config namespace: custom-prometheus data: config.yaml: | rules: - seriesQuery: 'http_requests_total{namespace!="",pod!=""}' 1 resources: overrides: namespace: {resource: "namespace"} pod: {resource: "pod"} service: {resource: "service"} name: matches: "^(.*)_total" as: "${1}_per_second" 2 metricsQuery: 'sum(rate(<<.Series>>{<<.LabelMatchers>>}[2m])) by (<<.GroupBy>>)' ---Add configuration details for registering
prometheus-adapteras an API service:apiVersion: v1 kind: Service metadata: annotations: service.beta.openshift.io/serving-cert-secret-name: prometheus-adapter-tls labels: name: prometheus-adapter name: prometheus-adapter namespace: custom-prometheus spec: ports: - name: https port: 443 targetPort: 6443 selector: app: prometheus-adapter type: ClusterIP --- apiVersion: apiregistration.k8s.io/v1beta1 kind: APIService metadata: name: v1beta1.custom.metrics.k8s.io spec: service: name: prometheus-adapter namespace: custom-prometheus group: custom.metrics.k8s.io version: v1beta1 insecureSkipTLSVerify: true groupPriorityMinimum: 100 versionPriority: 100 ---List the Prometheus Adapter image:
$ oc get -n openshift-monitoring deploy/prometheus-adapter -o jsonpath="{..image}"Add configuration details for deploying
prometheus-adapter:apiVersion: apps/v1 kind: Deployment metadata: labels: app: prometheus-adapter name: prometheus-adapter namespace: custom-prometheus spec: replicas: 1 selector: matchLabels: app: prometheus-adapter template: metadata: labels: app: prometheus-adapter name: prometheus-adapter spec: serviceAccountName: custom-metrics-apiserver containers: - name: prometheus-adapter image: quay.io/openshift-release-dev/ocp-v4.0-art-dev@sha256:a46915a206cd7d97f240687c618dd59e8848fcc3a0f51e281f3384153a12c3e0 1 args: - --secure-port=6443 - --tls-cert-file=/var/run/serving-cert/tls.crt - --tls-private-key-file=/var/run/serving-cert/tls.key - --logtostderr=true - --prometheus-url=http://prometheus-operated.default.svc:9090/ - --metrics-relist-interval=1m - --v=4 - --config=/etc/adapter/config.yaml ports: - containerPort: 6443 volumeMounts: - mountPath: /var/run/serving-cert name: volume-serving-cert readOnly: true - mountPath: /etc/adapter/ name: config readOnly: true - mountPath: /tmp name: tmp-vol volumes: - name: volume-serving-cert secret: secretName: prometheus-adapter-tls - name: config configMap: name: adapter-config - name: tmp-vol emptyDir: {}- 1
- Specifies the Prometheus Adapter image found in the previous step.
Apply the configuration to the cluster:
$ oc apply -f deploy.yaml
Example output
serviceaccount/custom-metrics-apiserver created
clusterrole.rbac.authorization.k8s.io/custom-metrics-server-resources created
clusterrole.rbac.authorization.k8s.io/custom-metrics-resource-reader created
clusterrolebinding.rbac.authorization.k8s.io/custom-metrics:system:auth-delegator created
rolebinding.rbac.authorization.k8s.io/custom-metrics-auth-reader created
clusterrolebinding.rbac.authorization.k8s.io/custom-metrics-resource-reader created
clusterrolebinding.rbac.authorization.k8s.io/hpa-controller-custom-metrics created
configmap/adapter-config created
service/prometheus-adapter created
apiservice.apiregistration.k8s.io/v1.custom.metrics.k8s.io created
deployment.apps/prometheus-adapter created
Verify that the
prometheus-adapterpod in your user-defined project is in aRunningstate. In this example the project iscustom-prometheus:$ oc -n custom-prometheus get pods prometheus-adapter-<string>
- The metrics for the application are now exposed and they can be used to configure horizontal pod autoscaling.
Additional resources
8.2. Next steps
Chapter 9. Troubleshooting monitoring issues
9.2. Determining why Prometheus is consuming a lot of disk space
Developers can create labels to define attributes for metrics in the form of key-value pairs. The number of potential key-value pairs corresponds to the number of possible values for an attribute. An attribute that has an unlimited number of potential values is called an unbound attribute. For example, a customer_id attribute is unbound because it has an infinite number of possible values.
Every assigned key-value pair has a unique time series. The use of many unbound attributes in labels can result in an exponential increase in the number of time series created. This can impact Prometheus performance and can consume a lot of disk space.
You can use the following measures when Prometheus consumes a lot of disk:
- Check the number of scrape samples that are being collected.
- Check the time series database (TSDB) status in the Prometheus UI for more information on which labels are creating the most time series. This requires cluster administrator privileges.
Reduce the number of unique time series that are created by reducing the number of unbound attributes that are assigned to user-defined metrics.
NoteUsing attributes that are bound to a limited set of possible values reduces the number of potential key-value pair combinations.
- Enforce limits on the number of samples that can be scraped across user-defined projects. This requires cluster administrator privileges.
Prerequisites
-
You have access to the cluster as a user with the
cluster-adminrole. -
You have installed the OpenShift CLI (
oc).
Procedure
- In the Administrator perspective, navigate to Monitoring → Metrics.
Run the following Prometheus Query Language (PromQL) query in the Expression field. This returns the ten metrics that have the highest number of scrape samples:
topk(10,count by (job)({__name__=~".+"}))Investigate the number of unbound label values assigned to metrics with higher than expected scrape sample counts.
- If the metrics relate to a user-defined project, review the metrics key-value pairs assigned to your workload. These are implemented through Prometheus client libraries at the application level. Try to limit the number of unbound attributes referenced in your labels.
- If the metrics relate to a core OpenShift Container Platform project, create a Red Hat support case on the Red Hat Customer Portal.
Check the TSDB status in the Prometheus UI.
- In the Administrator perspective, navigate to Networking → Routes.
-
Select the
openshift-monitoringproject in the Project list. -
Select the URL in the
prometheus-k8srow to open the login page for the Prometheus UI. - Choose Log in with OpenShift to log in using your OpenShift Container Platform credentials.
- In the Prometheus UI, navigate to Status → TSDB Status.
Additional resources
- See Setting a scrape sample limit for user-defined projects for details on how to set a scrape sample limit and create related alerting rules
- Submitting a support case