
Scalability and performance
Scaling your OpenShift Container Platform cluster and tuning performance in production environments
Abstract
Chapter 1. Recommended practices for installing large clusters
Apply the following practices when installing large clusters or scaling clusters to larger node counts.
1.1. Recommended practices for installing large scale clusters
When installing large clusters or scaling the cluster to larger node counts, set the cluster network cidr accordingly in your install-config.yaml file before you install the cluster:
networking:
  clusterNetwork:
  - cidr: 10.128.0.0/14
    hostPrefix: 23
  machineCIDR: 10.0.0.0/16
  networkType: OpenShiftSDN
  serviceNetwork:
  - 172.30.0.0/16
The default cluster network cidr 10.128.0.0/14 cannot be used if the cluster size is more than 500 nodes. It must be set to 10.128.0.0/12 or 10.128.0.0/10 to get to larger node counts beyond 500 nodes.
Chapter 2. Recommended host practices
This topic provides recommended host practices for OpenShift Container Platform.
2.1. Recommended node host practices
The OpenShift Container Platform node configuration file contains important options. For example, two parameters control the maximum number of pods that can be scheduled to a node: podsPerCore and maxPods.
When both options are in use, the lower of the two values limits the number of pods on a node. Exceeding these values can result in:
- Increased CPU utilization.
- Slow pod scheduling.
- Potential out-of-memory scenarios, depending on the amount of memory in the node.
- Exhausting the pool of IP addresses.
- Resource overcommitting, leading to poor user application performance.
In Kubernetes, a pod that is holding a single container actually uses two containers. The second container is used to set up networking prior to the actual container starting. Therefore, a system running 10 pods will actually have 20 containers running.
podsPerCore sets the number of pods the node can run based on the number of processor cores on the node. For example, if podsPerCore is set to 10 on a node with 4 processor cores, the maximum number of pods allowed on the node will be 40.
kubeletConfig:
  podsPerCore: 10
Setting podsPerCore to 0 disables this limit. The default is 0. podsPerCore cannot exceed maxPods.
maxPods sets the number of pods the node can run to a fixed value, regardless of the properties of the node.
 kubeletConfig:
    maxPods: 250
2.2. Creating a KubeletConfig CRD to edit kubelet parameters
The kubelet configuration is currently serialized as an Ignition configuration, so it can be directly edited. However, there is also a new kubelet-config-controller added to the Machine Config Controller (MCC). This allows you to create a KubeletConfig custom resource (CR) to edit the kubelet parameters.
Procedure
Run:
$ oc get machineconfig
This provides a list of the available machine configuration objects you can select. By default, the two kubelet-related configs are
01-master-kubeletand01-worker-kubelet.To check the current value of max pods per node, run:
# oc describe node <node-ip> | grep Allocatable -A6
Look for
value: pods: <value>.For example:
# oc describe node ip-172-31-128-158.us-east-2.compute.internal | grep Allocatable -A6
Example output
Allocatable:
 attachable-volumes-aws-ebs:  25
 cpu:                         3500m
 hugepages-1Gi:               0
 hugepages-2Mi:               0
 memory:                      15341844Ki
 pods:                        250
To set the max pods per node on the worker nodes, create a custom resource file that contains the kubelet configuration. For example,
change-maxPods-cr.yaml:apiVersion: machineconfiguration.openshift.io/v1 kind: KubeletConfig metadata: name: set-max-pods spec: machineConfigPoolSelector: matchLabels: custom-kubelet: large-pods kubeletConfig: maxPods: 500The rate at which the kubelet talks to the API server depends on queries per second (QPS) and burst values. The default values,
50forkubeAPIQPSand100forkubeAPIBurst, are good enough if there are limited pods running on each node. Updating the kubelet QPS and burst rates is recommended if there are enough CPU and memory resources on the node:apiVersion: machineconfiguration.openshift.io/v1 kind: KubeletConfig metadata: name: set-max-pods spec: machineConfigPoolSelector: matchLabels: custom-kubelet: large-pods kubeletConfig: maxPods: <pod_count> kubeAPIBurst: <burst_rate> kubeAPIQPS: <QPS>Run:
$ oc label machineconfigpool worker custom-kubelet=large-pods
Run:
$ oc create -f change-maxPods-cr.yaml
Run:
$ oc get kubeletconfig
This should return
set-max-pods.Depending on the number of worker nodes in the cluster, wait for the worker nodes to be rebooted one by one. For a cluster with 3 worker nodes, this could take about 10 to 15 minutes.
Check for
maxPodschanging for the worker nodes:$ oc describe node
Verify the change by running:
$ oc get kubeletconfigs set-max-pods -o yaml
This should show a status of
Trueandtype:Success
Procedure
By default, only one machine is allowed to be unavailable when applying the kubelet-related configuration to the available worker nodes. For a large cluster, it can take a long time for the configuration change to be reflected. At any time, you can adjust the number of machines that are updating to speed up the process.
Run:
$ oc edit machineconfigpool worker
Set
maxUnavailableto the desired value.spec: maxUnavailable: <node_count>
ImportantWhen setting the value, consider the number of worker nodes that can be unavailable without affecting the applications running on the cluster.
2.3. Control plane node sizing
The control plane node resource requirements depend on the number of nodes in the cluster. The following control plane node size recommendations are based on the results of control plane density focused testing. The control plane tests create the following objects across the cluster in each of the namespaces depending on the node counts:
- 12 image streams
- 3 build configurations
- 6 builds
- 1 deployment with 2 pod replicas mounting two secrets each
- 2 deployments with 1 pod replica mounting two secrets
- 3 services pointing to the previous deployments
- 3 routes pointing to the previous deployments
- 10 secrets, 2 of which are mounted by the previous deployments
- 10 config maps, 2 of which are mounted by the previous deployments
| Number of worker nodes | Cluster load (namespaces) | CPU cores | Memory (GB) |
|---|---|---|---|
| 25 | 500 | 4 | 16 |
| 100 | 1000 | 8 | 32 |
| 250 | 4000 | 16 | 96 |
On a cluster with three masters or control plane nodes, the CPU and memory usage will spike up when one of the nodes is stopped, rebooted or fails because the remaining two nodes must handle the load in order to be highly available. This is also expected during upgrades because the masters are cordoned, drained, and rebooted serially to apply the operating system updates, as well as the control plane Operators update. To avoid cascading failures on large and dense clusters, keep the overall resource usage on the master nodes to at most half of all available capacity to handle the resource usage spikes. Increase the CPU and memory on the master nodes accordingly.
The node sizing varies depending on the number of nodes and object counts in the cluster. It also depends on whether the objects are actively being created on the cluster. During object creation, the control plane is more active in terms of resource usage compared to when the objects are in the running phase.
If you used an installer-provisioned infrastructure installation method, you cannot modify the control plane node size in a running OpenShift Container Platform 4.5 cluster. Instead, you must estimate your total node count and use the suggested control plane node size during installation.
The recommendations are based on the data points captured on OpenShift Container Platform clusters with OpenShiftSDN as the network plug-in.
In OpenShift Container Platform 4.5, half of a CPU core (500 millicore) is now reserved by the system by default compared to OpenShift Container Platform 3.11 and previous versions. The sizes are determined taking that into consideration.
2.4. Recommended etcd practices
For large and dense clusters, etcd can suffer from poor performance if the keyspace grows excessively large and exceeds the space quota. Periodic maintenance of etcd, including defragmentation, must be performed to free up space in the data store. It is highly recommended that you monitor Prometheus for etcd metrics and defragment it when required before etcd raises a cluster-wide alarm that puts the cluster into a maintenance mode, which only accepts key reads and deletes. Some of the key metrics to monitor are etcd_server_quota_backend_bytes which is the current quota limit, etcd_mvcc_db_total_size_in_use_in_bytes which indicates the actual database usage after a history compaction, and etcd_debugging_mvcc_db_total_size_in_bytes which shows the database size including free space waiting for defragmentation. Instructions on defragging etcd can be found in the Defragmenting etcd data section.
Etcd writes data to disk, so its performance strongly depends on disk performance. Etcd persists proposals on disk. Slow disks and disk activity from other processes might cause long fsync latencies, causing etcd to miss heartbeats, inability to commit new proposals to the disk on time, which can cause request timeouts and temporary leader loss. It is highly recommended to run etcd on machines backed by SSD/NVMe disks with low latency and high throughput.
Some of the key metrics to monitor on a deployed OpenShift Container Platform cluster are p99 of etcd disk write ahead log duration and the number of etcd leader changes. Use Prometheus to track these metrics. etcd_disk_wal_fsync_duration_seconds_bucket reports the etcd disk fsync duration, etcd_server_leader_changes_seen_total reports the leader changes. To rule out a slow disk and confirm that the disk is reasonably fast, 99th percentile of the etcd_disk_wal_fsync_duration_seconds_bucket should be less than 10ms.
Fio, a I/O benchmarking tool can be used to validate the hardware for etcd before or after creating the OpenShift cluster. Run fio and analyze the results:
Assuming container runtimes like podman or docker are installed on the machine under test and the path etcd writes the data exists - /var/lib/etcd, run:
Procedure
Run the following if using podman:
$ sudo podman run --volume /var/lib/etcd:/var/lib/etcd:Z quay.io/openshift-scale/etcd-perf
Alternatively, run the following if using docker:
$ sudo docker run --volume /var/lib/etcd:/var/lib/etcd:Z quay.io/openshift-scale/etcd-perf
The output reports whether the disk is fast enough to host etcd by comparing the 99th percentile of the fsync metric captured from the run to see if it is less than 10ms.
Etcd replicates the requests among all the members, so its performance strongly depends on network input/output (IO) latency. High network latencies result in etcd heartbeats taking longer than the election timeout, which leads to leader elections that are disruptive to the cluster. A key metric to monitor on a deployed OpenShift Container Platform cluster is the 99th percentile of etcd network peer latency on each etcd cluster member. Use Prometheus to track the metric. histogram_quantile(0.99, rate(etcd_network_peer_round_trip_time_seconds_bucket[2m])) reports the round trip time for etcd to finish replicating the client requests between the members; it should be less than 50 ms.
2.5. Defragmenting etcd data
Manual defragmentation must be performed periodically to reclaim disk space after etcd history compaction and other events cause disk fragmentation.
History compaction is performed automatically every five minutes and leaves gaps in the back-end database. This fragmented space is available for use by etcd, but is not available to the host file system. You must defragment etcd to make this space available to the host file system.
Because etcd writes data to disk, its performance strongly depends on disk performance. Consider defragmenting etcd every month, twice a month, or as needed for your cluster. You can also monitor the etcd_db_total_size_in_bytes metric to determine whether defragmentation is necessary.
Defragmenting etcd is a blocking action. The etcd member will not response until defragmentation is complete. For this reason, wait at least one minute between defragmentation actions on each of the pods to allow the cluster to recover.
Follow this procedure to defragment etcd data on each etcd member.
Prerequisites
-
You have access to the cluster as a user with the
cluster-adminrole.
Procedure
Determine which etcd member is the leader, because the leader should be defragmented last.
Get the list of etcd pods:
$ oc get pods -n openshift-etcd -o wide | grep etcd
Example output
etcd-ip-10-0-159-225.example.redhat.com                3/3     Running     0          175m   10.0.159.225   ip-10-0-159-225.example.redhat.com   <none>           <none>
etcd-ip-10-0-191-37.example.redhat.com                 3/3     Running     0          173m   10.0.191.37    ip-10-0-191-37.example.redhat.com    <none>           <none>
etcd-ip-10-0-199-170.example.redhat.com                3/3     Running     0          176m   10.0.199.170   ip-10-0-199-170.example.redhat.com   <none>           <none>
Choose a pod and run the following command to determine which etcd member is the leader:
$ oc rsh -n openshift-etcd etcd-ip-10-0-159-225.us-west-1.compute.internal etcdctl endpoint status --cluster -w table
Example output
Defaulting container name to etcdctl.
Use 'oc describe pod/etcd-ip-10-0-159-225.example.redhat.com -n openshift-etcd' to see all of the containers in this pod.
+---------------------------+------------------+---------+---------+-----------+------------+-----------+------------+--------------------+--------+
|         ENDPOINT          |        ID        | VERSION | DB SIZE | IS LEADER | IS LEARNER | RAFT TERM | RAFT INDEX | RAFT APPLIED INDEX | ERRORS |
+---------------------------+------------------+---------+---------+-----------+------------+-----------+------------+--------------------+--------+
|  https://10.0.191.37:2379 | 251cd44483d811c3 |   3.4.9 |  104 MB |     false |      false |         7 |      91624 |              91624 |        |
| https://10.0.159.225:2379 | 264c7c58ecbdabee |   3.4.9 |  104 MB |     false |      false |         7 |      91624 |              91624 |        |
| https://10.0.199.170:2379 | 9ac311f93915cc79 |   3.4.9 |  104 MB |      true |      false |         7 |      91624 |              91624 |        |
+---------------------------+------------------+---------+---------+-----------+------------+-----------+------------+--------------------+--------+
Based on the
IS LEADERcolumn of this output, thehttps://10.0.199.170:2379endpoint is the leader. Matching this endpoint with the output of the previous step, the pod name of the leader isetcd-ip-10-0-199-170.example.redhat.com.
Defragment an etcd member.
Connect to the running etcd container, passing in the name of a pod that is not the leader:
$ oc rsh -n openshift-etcd etcd-ip-10-0-159-225.example.redhat.com
Unset the
ETCDCTL_ENDPOINTSenvironment variable:sh-4.4# unset ETCDCTL_ENDPOINTS
Defragment the etcd member:
sh-4.4# etcdctl --command-timeout=30s --endpoints=https://localhost:2379 defrag
Example output
Finished defragmenting etcd member[https://localhost:2379]
If a timeout error occurs, increase the value for
--command-timeoutuntil the command succeeds.Verify that the database size was reduced:
sh-4.4# etcdctl endpoint status -w table --cluster
Example output
+---------------------------+------------------+---------+---------+-----------+------------+-----------+------------+--------------------+--------+
|         ENDPOINT          |        ID        | VERSION | DB SIZE | IS LEADER | IS LEARNER | RAFT TERM | RAFT INDEX | RAFT APPLIED INDEX | ERRORS |
+---------------------------+------------------+---------+---------+-----------+------------+-----------+------------+--------------------+--------+
|  https://10.0.191.37:2379 | 251cd44483d811c3 |   3.4.9 |  104 MB |     false |      false |         7 |      91624 |              91624 |        |
| https://10.0.159.225:2379 | 264c7c58ecbdabee |   3.4.9 |   41 MB |     false |      false |         7 |      91624 |              91624 |        | 1
| https://10.0.199.170:2379 | 9ac311f93915cc79 |   3.4.9 |  104 MB |      true |      false |         7 |      91624 |              91624 |        |
+---------------------------+------------------+---------+---------+-----------+------------+-----------+------------+--------------------+--------+
This example shows that the database size for this etcd member is now 41 MB as opposed to the starting size of 104 MB.
Repeat these steps to connect to each of the other etcd members and defragment them. Always defragment the leader last.
Wait at least one minute between defragmentation actions to allow the etcd pod to recover. Until the etcd pod recovers, the etcd member will not respond.
If any
NOSPACEalarms were triggered due to the space quota being exceeded, clear them.Check if there are any
NOSPACEalarms:sh-4.4# etcdctl alarm list
Example output
memberID:12345678912345678912 alarm:NOSPACE
Clear the alarms:
sh-4.4# etcdctl alarm disarm
2.6. OpenShift Container Platform infrastructure components
The following infrastructure workloads do not incur OpenShift Container Platform worker subscriptions:
- Kubernetes and OpenShift Container Platform control plane services that run on masters
- The default router
- The integrated container image registry
- The cluster metrics collection, or monitoring service, including components for monitoring user-defined projects
- Cluster aggregated logging
- Service brokers
- Red Hat Quay
- Red Hat OpenShift Container Storage
- Red Hat Advanced Cluster Manager
Any node that runs any other container, pod, or component is a worker node that your subscription must cover.
2.7. Moving the monitoring solution
By default, the Prometheus Cluster Monitoring stack, which contains Prometheus, Grafana, and AlertManager, is deployed to provide cluster monitoring. It is managed by the Cluster Monitoring Operator. To move its components to different machines, you create and apply a custom config map.
Procedure
Save the following
ConfigMapdefinition as thecluster-monitoring-configmap.yamlfile:apiVersion: v1 kind: ConfigMap metadata: name: cluster-monitoring-config namespace: openshift-monitoring data: config.yaml: |+ alertmanagerMain: nodeSelector: node-role.kubernetes.io/infra: "" prometheusK8s: nodeSelector: node-role.kubernetes.io/infra: "" prometheusOperator: nodeSelector: node-role.kubernetes.io/infra: "" grafana: nodeSelector: node-role.kubernetes.io/infra: "" k8sPrometheusAdapter: nodeSelector: node-role.kubernetes.io/infra: "" kubeStateMetrics: nodeSelector: node-role.kubernetes.io/infra: "" telemeterClient: nodeSelector: node-role.kubernetes.io/infra: "" openshiftStateMetrics: nodeSelector: node-role.kubernetes.io/infra: "" thanosQuerier: nodeSelector: node-role.kubernetes.io/infra: ""Running this config map forces the components of the monitoring stack to redeploy to infrastructure nodes.
Apply the new config map:
$ oc create -f cluster-monitoring-configmap.yaml
Watch the monitoring pods move to the new machines:
$ watch 'oc get pod -n openshift-monitoring -o wide'
If a component has not moved to the
infranode, delete the pod with this component:$ oc delete pod -n openshift-monitoring <pod>
The component from the deleted pod is re-created on the
infranode.
2.8. Moving the default registry
You configure the registry Operator to deploy its pods to different nodes.
Prerequisites
- Configure additional machine sets in your OpenShift Container Platform cluster.
Procedure
View the
config/instanceobject:$ oc get configs.imageregistry.operator.openshift.io/cluster -o yaml
Example output
apiVersion: imageregistry.operator.openshift.io/v1
kind: Config
metadata:
  creationTimestamp: 2019-02-05T13:52:05Z
  finalizers:
  - imageregistry.operator.openshift.io/finalizer
  generation: 1
  name: cluster
  resourceVersion: "56174"
  selfLink: /apis/imageregistry.operator.openshift.io/v1/configs/cluster
  uid: 36fd3724-294d-11e9-a524-12ffeee2931b
spec:
  httpSecret: d9a012ccd117b1e6616ceccb2c3bb66a5fed1b5e481623
  logging: 2
  managementState: Managed
  proxy: {}
  replicas: 1
  requests:
    read: {}
    write: {}
  storage:
    s3:
      bucket: image-registry-us-east-1-c92e88cad85b48ec8b312344dff03c82-392c
      region: us-east-1
status:
...
Edit the
config/instanceobject:$ oc edit configs.imageregistry.operator.openshift.io/cluster
Add the following lines of text the
specsection of the object:nodeSelector: node-role.kubernetes.io/infra: ""Verify the registry pod has been moved to the infrastructure node.
Run the following command to identify the node where the registry pod is located:
$ oc get pods -o wide -n openshift-image-registry
Confirm the node has the label you specified:
$ oc describe node <node_name>
Review the command output and confirm that
node-role.kubernetes.io/infrais in theLABELSlist.
2.9. Moving the router
You can deploy the router pod to a different machine set. By default, the pod is deployed to a worker node.
Prerequisites
- Configure additional machine sets in your OpenShift Container Platform cluster.
Procedure
View the
IngressControllercustom resource for the router Operator:$ oc get ingresscontroller default -n openshift-ingress-operator -o yaml
The command output resembles the following text:
apiVersion: operator.openshift.io/v1
kind: IngressController
metadata:
  creationTimestamp: 2019-04-18T12:35:39Z
  finalizers:
  - ingresscontroller.operator.openshift.io/finalizer-ingresscontroller
  generation: 1
  name: default
  namespace: openshift-ingress-operator
  resourceVersion: "11341"
  selfLink: /apis/operator.openshift.io/v1/namespaces/openshift-ingress-operator/ingresscontrollers/default
  uid: 79509e05-61d6-11e9-bc55-02ce4781844a
spec: {}
status:
  availableReplicas: 2
  conditions:
  - lastTransitionTime: 2019-04-18T12:36:15Z
    status: "True"
    type: Available
  domain: apps.<cluster>.example.com
  endpointPublishingStrategy:
    type: LoadBalancerService
  selector: ingresscontroller.operator.openshift.io/deployment-ingresscontroller=default
Edit the
ingresscontrollerresource and change thenodeSelectorto use theinfralabel:$ oc edit ingresscontroller default -n openshift-ingress-operator
Add the
nodeSelectorstanza that references theinfralabel to thespecsection, as shown:spec: nodePlacement: nodeSelector: matchLabels: node-role.kubernetes.io/infra: ""Confirm that the router pod is running on the
infranode.View the list of router pods and note the node name of the running pod:
$ oc get pod -n openshift-ingress -o wide
Example output
NAME                              READY     STATUS        RESTARTS   AGE       IP           NODE                           NOMINATED NODE   READINESS GATES
router-default-86798b4b5d-bdlvd   1/1      Running       0          28s       10.130.2.4   ip-10-0-217-226.ec2.internal   <none>           <none>
router-default-955d875f4-255g8    0/1      Terminating   0          19h       10.129.2.4   ip-10-0-148-172.ec2.internal   <none>           <none>
In this example, the running pod is on the
ip-10-0-217-226.ec2.internalnode.View the node status of the running pod:
$ oc get node <node_name> 1Example output
NAME                          STATUS  ROLES         AGE   VERSION
ip-10-0-217-226.ec2.internal  Ready   infra,worker  17h   v1.18.3
Because the role list includes
infra, the pod is running on the correct node.
2.10. Infrastructure node sizing
The infrastructure node resource requirements depend on the cluster age, nodes, and objects in the cluster, as these factors can lead to an increase in the number of metrics or time series in Prometheus. The following infrastructure node size recommendations are based on the results of cluster maximums and control plane density focused testing.
| Number of worker nodes | CPU cores | Memory (GB) |
|---|---|---|
| 25 | 4 | 32 |
| 100 | 8 | 64 |
| 250 | 32 | 192 |
| 500 | 32 | 192 |
These sizing recommendations are based on scale tests, which create a large number of objects across the cluster. These tests include reaching some of the cluster maximums. In the case of 250 and 500 node counts on a OpenShift Container Platform 4.5 cluster, these maximums are 10000 namespaces with 61000 pods, 10000 deployments, 181000 secrets, 400 config maps, and so on. Prometheus is a highly memory intensive application; the resource usage depends on various factors including the number of nodes, objects, the Prometheus metrics scraping interval, metrics or time series, and the age of the cluster. The disk size also depends on the retention period. You must take these factors into consideration and size them accordingly.
The sizing recommendations are applicable only for the infrastructure components which gets installed during the cluster install - Prometheus, Router and Registry. Logging is a day two operation and the recommendations do not take it into account.
In OpenShift Container Platform 4.5, half of a CPU core (500 millicore) is now reserved by the system by default compared to OpenShift Container Platform 3.11 and previous versions. This influences the stated sizing recommendations.
2.11. Additional resources
Chapter 3. Recommended cluster scaling practices
The guidance in this section is only relevant for installations with cloud provider integration.
Apply the following best practices to scale the number of worker machines in your OpenShift Container Platform cluster. You scale the worker machines by increasing or decreasing the number of replicas that are defined in the worker machine set.
3.1. Recommended practices for scaling the cluster
When scaling up the cluster to higher node counts:
- Spread nodes across all of the available zones for higher availability.
- Scale up by no more than 25 to 50 machines at once.
- Consider creating new machine sets in each available zone with alternative instance types of similar size to help mitigate any periodic provider capacity constraints. For example, on AWS, use m5.large and m5d.large.
Cloud providers might implement a quota for API services. Therefore, gradually scale the cluster.
The controller might not be able to create the machines if the replicas in the machine sets are set to higher numbers all at one time. The number of requests the cloud platform, which OpenShift Container Platform is deployed on top of, is able to handle impacts the process. The controller will start to query more while trying to create, check, and update the machines with the status. The cloud platform on which OpenShift Container Platform is deployed has API request limits and excessive queries might lead to machine creation failures due to cloud platform limitations.
Enable machine health checks when scaling to large node counts. In case of failures, the health checks monitor the condition and automatically repair unhealthy machines.
When scaling large and dense clusters to lower node counts, it might take large amounts of time as the process involves draining or evicting the objects running on the nodes being terminated in parallel. Also, the client might start to throttle the requests if there are too many objects to evict. The default client QPS and burst rates are currently set to 5 and 10 respectively and they cannot be modified in OpenShift Container Platform.
3.2. Modifying a machine set
To make changes to a machine set, edit the MachineSet YAML. Then, remove all machines associated with the machine set by deleting each machine or scaling down the machine set to 0 replicas. Then, scale the replicas back to the desired number. Changes you make to a machine set do not affect existing machines.
If you need to scale a machine set without making other changes, you do not need to delete the machines.
By default, the OpenShift Container Platform router pods are deployed on workers. Because the router is required to access some cluster resources, including the web console, do not scale the worker machine set to 0 unless you first relocate the router pods.
Prerequisites
-
Install an OpenShift Container Platform cluster and the
occommand line. -
Log in to
ocas a user withcluster-adminpermission.
Procedure
Edit the machine set:
$ oc edit machineset <machineset> -n openshift-machine-api
Scale down the machine set to
0:$ oc scale --replicas=0 machineset <machineset> -n openshift-machine-api
Or:
$ oc edit machineset <machineset> -n openshift-machine-api
Wait for the machines to be removed.
Scale up the machine set as needed:
$ oc scale --replicas=2 machineset <machineset> -n openshift-machine-api
Or:
$ oc edit machineset <machineset> -n openshift-machine-api
Wait for the machines to start. The new machines contain changes you made to the machine set.
3.3. About machine health checks
You can define conditions under which machines in a cluster are considered unhealthy by using a MachineHealthCheck resource. Machines matching the conditions are automatically remediated.
To monitor machine health, create a MachineHealthCheck custom resource (CR) that includes a label for the set of machines to monitor and a condition to check, such as staying in the NotReady status for 15 minutes or displaying a permanent condition in the node-problem-detector.
The controller that observes a MachineHealthCheck CR checks for the condition that you defined. If a machine fails the health check, the machine is automatically deleted and a new one is created to take its place. When a machine is deleted, you see a machine deleted event.
For machines with the master role, the machine health check reports the number of unhealthy nodes, but the machine is not deleted. For example:
Example output
$ oc get machinehealthcheck example -n openshift-machine-api
NAME      MAXUNHEALTHY   EXPECTEDMACHINES   CURRENTHEALTHY
example   40%            3                  1
To limit the disruptive impact of machine deletions, the controller drains and deletes only one node at a time. If there are more unhealthy machines than the maxUnhealthy threshold allows for in the targeted pool of machines, the controller stops deleting machines and you must manually intervene.
To stop the check, remove the custom resource.
3.3.1. MachineHealthChecks on Bare Metal
Machine deletion on bare metal cluster triggers reprovisioning of a bare metal host. Usually bare metal reprovisioning is a lengthy process, during which the cluster is missing compute resources and applications might be interrupted. To change the default remediation process from machine deletion to host power-cycle, annotate the MachineHealthCheck resource with the machine.openshift.io/remediation-strategy: external-baremetal annotation.
After you set the annotation, unhealthy machines are power-cycled by using BMC credentials.
3.3.2. Limitations when deploying machine health checks
There are limitations to consider before deploying a machine health check:
- Only machines owned by a machine set are remediated by a machine health check.
- Control plane machines are not currently supported and are not remediated if they are unhealthy.
- If the node for a machine is removed from the cluster, a machine health check considers the machine to be unhealthy and remediates it immediately.
-
If the corresponding node for a machine does not join the cluster after the
nodeStartupTimeout, the machine is remediated. -
A machine is remediated immediately if the
Machineresource phase isFailed.
3.4. Sample MachineHealthCheck resource
The MachineHealthCheck resource resembles one of the following YAML files:
MachineHealthCheck for bare metal
apiVersion: machine.openshift.io/v1beta1
kind: MachineHealthCheck
metadata:
  name: example 1
  namespace: openshift-machine-api
  annotations:
    machine.openshift.io/remediation-strategy: external-baremetal 2
spec:
  selector:
    matchLabels:
      machine.openshift.io/cluster-api-machine-role: <role> 3
      machine.openshift.io/cluster-api-machine-type: <role> 4
      machine.openshift.io/cluster-api-machineset: <cluster_name>-<label>-<zone> 5
  unhealthyConditions:
  - type:    "Ready"
    timeout: "300s" 6
    status: "False"
  - type:    "Ready"
    timeout: "300s" 7
    status: "Unknown"
  maxUnhealthy: "40%" 8
  nodeStartupTimeout: "10m" 9
- 1
- Specify the name of the machine health check to deploy.
- 2
- For bare metal clusters, you must include the
machine.openshift.io/remediation-strategy: external-baremetalannotation in theannotationssection to enable power-cycle remediation. With this remediation strategy, unhealthy hosts are rebooted instead of removed from the cluster. - 3 4
- Specify a label for the machine pool that you want to check.
- 5
- Specify the machine set to track in
<cluster_name>-<label>-<zone>format. For example,prod-node-us-east-1a. - 6 7
- Specify the timeout duration for a node condition. If a condition is met for the duration of the timeout, the machine will be remediated. Long timeouts can result in long periods of downtime for a workload on an unhealthy machine.
- 8
- Specify the amount of unhealthy machines allowed in the targeted pool. This can be set as a percentage or an integer.
- 9
- Specify the timeout duration that a machine health check must wait for a node to join the cluster before a machine is determined to be unhealthy.
The matchLabels are examples only; you must map your machine groups based on your specific needs.
MachineHealthCheck for all other installation types
apiVersion: machine.openshift.io/v1beta1
kind: MachineHealthCheck
metadata:
  name: example 1
  namespace: openshift-machine-api
spec:
  selector:
    matchLabels:
      machine.openshift.io/cluster-api-machine-role: <role> 2
      machine.openshift.io/cluster-api-machine-type: <role> 3
      machine.openshift.io/cluster-api-machineset: <cluster_name>-<label>-<zone> 4
  unhealthyConditions:
  - type:    "Ready"
    timeout: "300s" 5
    status: "False"
  - type:    "Ready"
    timeout: "300s" 6
    status: "Unknown"
  maxUnhealthy: "40%" 7
  nodeStartupTimeout: "10m" 8
- 1
- Specify the name of the machine health check to deploy.
- 2 3
- Specify a label for the machine pool that you want to check.
- 4
- Specify the machine set to track in
<cluster_name>-<label>-<zone>format. For example,prod-node-us-east-1a. - 5 6
- Specify the timeout duration for a node condition. If a condition is met for the duration of the timeout, the machine will be remediated. Long timeouts can result in long periods of downtime for a workload on an unhealthy machine.
- 7
- Specify the amount of unhealthy machines allowed in the targeted pool. This can be set as a percentage or an integer.
- 8
- Specify the timeout duration that a machine health check must wait for a node to join the cluster before a machine is determined to be unhealthy.
The matchLabels are examples only; you must map your machine groups based on your specific needs.
3.4.1. Short-circuiting machine health check remediation
Short circuiting ensures that machine health checks remediate machines only when the cluster is healthy. Short-circuiting is configured through the maxUnhealthy field in the MachineHealthCheck resource.
If the user defines a value for the maxUnhealthy field, before remediating any machines, the MachineHealthCheck compares the value of maxUnhealthy with the number of machines within its target pool that it has determined to be unhealthy. Remediation is not performed if the number of unhealthy machines exceeds the maxUnhealthy limit.
If maxUnhealthy is not set, the value defaults to 100% and the machines are remediated regardless of the state of the cluster.
The maxUnhealthy field can be set as either an integer or percentage. There are different remediation implementations depending on the maxUnhealthy value.
3.4.1.1. Setting maxUnhealthy by using an absolute value
If maxUnhealthy is set to 2:
- Remediation will be performed if 2 or fewer nodes are unhealthy
- Remediation will not be performed if 3 or more nodes are unhealthy
These values are independent of how many machines are being checked by the machine health check.
3.4.1.2. Setting maxUnhealthy by using percentages
If maxUnhealthy is set to 40% and there are 25 machines being checked:
- Remediation will be performed if 10 or fewer nodes are unhealthy
- Remediation will not be performed if 11 or more nodes are unhealthy
If maxUnhealthy is set to 40% and there are 6 machines being checked:
- Remediation will be performed if 2 or fewer nodes are unhealthy
- Remediation will not be performed if 3 or more nodes are unhealthy
The allowed number of machines is rounded down when the percentage of maxUnhealthy machines that are checked is not a whole number.
3.5. Creating a MachineHealthCheck resource
You can create a MachineHealthCheck resource for all MachineSets in your cluster. You should not create a MachineHealthCheck resource that targets control plane machines.
Prerequisites
-
Install the
occommand line interface.
Procedure
-
Create a
healthcheck.ymlfile that contains the definition of your machine health check. Apply the
healthcheck.ymlfile to your cluster:$ oc apply -f healthcheck.yml
Chapter 4. Using the Node Tuning Operator
Learn about the Node Tuning Operator and how you can use it to manage node-level tuning by orchestrating the tuned daemon.
4.1. About the Node Tuning Operator
The Node Tuning Operator helps you manage node-level tuning by orchestrating the Tuned daemon. The majority of high-performance applications require some level of kernel tuning. The Node Tuning Operator provides a unified management interface to users of node-level sysctls and more flexibility to add custom tuning specified by user needs.
The Operator manages the containerized Tuned daemon for OpenShift Container Platform as a Kubernetes daemon set. It ensures the custom tuning specification is passed to all containerized Tuned daemons running in the cluster in the format that the daemons understand. The daemons run on all nodes in the cluster, one per node.
Node-level settings applied by the containerized Tuned daemon are rolled back on an event that triggers a profile change or when the containerized Tuned daemon is terminated gracefully by receiving and handling a termination signal.
The Node Tuning Operator is part of a standard OpenShift Container Platform installation in version 4.1 and later.
4.2. Accessing an example Node Tuning Operator specification
Use this process to access an example Node Tuning Operator specification.
Procedure
Run:
$ oc get Tuned/default -o yaml -n openshift-cluster-node-tuning-operator
The default CR is meant for delivering standard node-level tuning for the OpenShift Container Platform platform and it can only be modified to set the Operator Management state. Any other custom changes to the default CR will be overwritten by the Operator. For custom tuning, create your own Tuned CRs. Newly created CRs will be combined with the default CR and custom tuning applied to OpenShift Container Platform nodes based on node or pod labels and profile priorities.
While in certain situations the support for pod labels can be a convenient way of automatically delivering required tuning, this practice is discouraged and strongly advised against, especially in large-scale clusters. The default Tuned CR ships without pod label matching. If a custom profile is created with pod label matching, then the functionality will be enabled at that time. The pod label functionality might be deprecated in future versions of the Node Tuning Operator.
4.3. Default profiles set on a cluster
The following are the default profiles set on a cluster.
apiVersion: tuned.openshift.io/v1
kind: Tuned
metadata:
  name: default
  namespace: openshift-cluster-node-tuning-operator
spec:
  profile:
  - name: "openshift"
    data: |
      [main]
      summary=Optimize systems running OpenShift (parent profile)
      include=${f:virt_check:virtual-guest:throughput-performance}

      [selinux]
      avc_cache_threshold=8192

      [net]
      nf_conntrack_hashsize=131072

      [sysctl]
      net.ipv4.ip_forward=1
      kernel.pid_max=>4194304
      net.netfilter.nf_conntrack_max=1048576
      net.ipv4.conf.all.arp_announce=2
      net.ipv4.neigh.default.gc_thresh1=8192
      net.ipv4.neigh.default.gc_thresh2=32768
      net.ipv4.neigh.default.gc_thresh3=65536
      net.ipv6.neigh.default.gc_thresh1=8192
      net.ipv6.neigh.default.gc_thresh2=32768
      net.ipv6.neigh.default.gc_thresh3=65536
      vm.max_map_count=262144

      [sysfs]
      /sys/module/nvme_core/parameters/io_timeout=4294967295
      /sys/module/nvme_core/parameters/max_retries=10

  - name: "openshift-control-plane"
    data: |
      [main]
      summary=Optimize systems running OpenShift control plane
      include=openshift

      [sysctl]
      # ktune sysctl settings, maximizing i/o throughput
      #
      # Minimal preemption granularity for CPU-bound tasks:
      # (default: 1 msec#  (1 + ilog(ncpus)), units: nanoseconds)
      kernel.sched_min_granularity_ns=10000000
      # The total time the scheduler will consider a migrated process
      # "cache hot" and thus less likely to be re-migrated
      # (system default is 500000, i.e. 0.5 ms)
      kernel.sched_migration_cost_ns=5000000
      # SCHED_OTHER wake-up granularity.
      #
      # Preemption granularity when tasks wake up.  Lower the value to
      # improve wake-up latency and throughput for latency critical tasks.
      kernel.sched_wakeup_granularity_ns=4000000

  - name: "openshift-node"
    data: |
      [main]
      summary=Optimize systems running OpenShift nodes
      include=openshift

      [sysctl]
      net.ipv4.tcp_fastopen=3
      fs.inotify.max_user_watches=65536
      fs.inotify.max_user_instances=8192

  recommend:
  - profile: "openshift-control-plane"
    priority: 30
    match:
    - label: "node-role.kubernetes.io/master"
    - label: "node-role.kubernetes.io/infra"

  - profile: "openshift-node"
    priority: 40
4.4. Verifying that the Tuned profiles are applied
Use this procedure to check which Tuned profiles are applied on every node.
Procedure
Check which Tuned pods are running on each node:
$ oc get pods -n openshift-cluster-node-tuning-operator -o wide
Example output
NAME                                            READY   STATUS    RESTARTS   AGE    IP             NODE                                         NOMINATED NODE   READINESS GATES
cluster-node-tuning-operator-599489d4f7-k4hw4   1/1     Running   0          6d2h   10.129.0.76    ip-10-0-145-113.eu-west-3.compute.internal   <none>           <none>
tuned-2jkzp                                     1/1     Running   1          6d3h   10.0.145.113   ip-10-0-145-113.eu-west-3.compute.internal   <none>           <none>
tuned-g9mkx                                     1/1     Running   1          6d3h   10.0.147.108   ip-10-0-147-108.eu-west-3.compute.internal   <none>           <none>
tuned-kbxsh                                     1/1     Running   1          6d3h   10.0.132.143   ip-10-0-132-143.eu-west-3.compute.internal   <none>           <none>
tuned-kn9x6                                     1/1     Running   1          6d3h   10.0.163.177   ip-10-0-163-177.eu-west-3.compute.internal   <none>           <none>
tuned-vvxwx                                     1/1     Running   1          6d3h   10.0.131.87    ip-10-0-131-87.eu-west-3.compute.internal    <none>           <none>
tuned-zqrwq                                     1/1     Running   1          6d3h   10.0.161.51    ip-10-0-161-51.eu-west-3.compute.internal    <none>           <none>
Extract the profile applied from each pod and match them against the previous list:
$ for p in `oc get pods -n openshift-cluster-node-tuning-operator -l openshift-app=tuned -o=jsonpath='{range .items[*]}{.metadata.name} {end}'`; do printf "\n*** $p ***\n" ; oc logs pod/$p -n openshift-cluster-node-tuning-operator | grep applied; doneExample output
*** tuned-2jkzp ***
2020-07-10 13:53:35,368 INFO     tuned.daemon.daemon: static tuning from profile 'openshift-control-plane' applied

*** tuned-g9mkx ***
2020-07-10 14:07:17,089 INFO     tuned.daemon.daemon: static tuning from profile 'openshift-node' applied
2020-07-10 15:56:29,005 INFO     tuned.daemon.daemon: static tuning from profile 'openshift-node-es' applied
2020-07-10 16:00:19,006 INFO     tuned.daemon.daemon: static tuning from profile 'openshift-node' applied
2020-07-10 16:00:48,989 INFO     tuned.daemon.daemon: static tuning from profile 'openshift-node-es' applied

*** tuned-kbxsh ***
2020-07-10 13:53:30,565 INFO     tuned.daemon.daemon: static tuning from profile 'openshift-node' applied
2020-07-10 15:56:30,199 INFO     tuned.daemon.daemon: static tuning from profile 'openshift-node-es' applied

*** tuned-kn9x6 ***
2020-07-10 14:10:57,123 INFO     tuned.daemon.daemon: static tuning from profile 'openshift-node' applied
2020-07-10 15:56:28,757 INFO     tuned.daemon.daemon: static tuning from profile 'openshift-node-es' applied

*** tuned-vvxwx ***
2020-07-10 14:11:44,932 INFO     tuned.daemon.daemon: static tuning from profile 'openshift-control-plane' applied

*** tuned-zqrwq ***
2020-07-10 14:07:40,246 INFO     tuned.daemon.daemon: static tuning from profile 'openshift-control-plane' applied
4.5. Custom tuning specification
The custom resource (CR) for the Operator has two major sections. The first section, profile:, is a list of Tuned profiles and their names. The second, recommend:, defines the profile selection logic.
Multiple custom tuning specifications can co-exist as multiple CRs in the Operator’s namespace. The existence of new CRs or the deletion of old CRs is detected by the Operator. All existing custom tuning specifications are merged and appropriate objects for the containerized Tuned daemons are updated.
Profile data
The profile: section lists Tuned profiles and their names.
profile:
- name: tuned_profile_1
  data: |
    # Tuned profile specification
    [main]
    summary=Description of tuned_profile_1 profile

    [sysctl]
    net.ipv4.ip_forward=1
    # ... other sysctl's or other Tuned daemon plug-ins supported by the containerized Tuned

# ...

- name: tuned_profile_n
  data: |
    # Tuned profile specification
    [main]
    summary=Description of tuned_profile_n profile

    # tuned_profile_n profile settings
Recommended profiles
The profile: selection logic is defined by the recommend: section of the CR. The recommend: section is a list of items to recommend the profiles based on a selection criteria.
recommend:
<recommend-item-1>
# ...
<recommend-item-n>
The individual items of the list:
- machineConfigLabels: 1
    <mcLabels> 2
  match: 3
  <match> 4
  priority: <priority> 5
  profile: <tuned_profile_name> 6
- 1
- Optional.
- 2
- A dictionary of key/value
MachineConfiglabels. The keys must be unique. - 3
- If omitted, profile match is assumed unless a profile with a higher priority matches first or
machineConfigLabelsis set. - 4
- An optional list.
- 5
- Profile ordering priority. Lower numbers mean higher priority (
0is the highest priority). - 6
- A Tuned profile to apply on a match. For example
tuned_profile_1.
<match> is an optional list recursively defined as follows:
- label: <label_name> 1
  value: <label_value> 2
  type: <label_type> 3
  <match> 4
If <match> is not omitted, all nested <match> sections must also evaluate to true. Otherwise, false is assumed and the profile with the respective <match> section will not be applied or recommended. Therefore, the nesting (child <match> sections) works as logical AND operator. Conversely, if any item of the <match> list matches, the entire <match> list evaluates to true. Therefore, the list acts as logical OR operator.
If machineConfigLabels is defined, machine config pool based matching is turned on for the given recommend: list item. <mcLabels> specifies the labels for a machine config. The machine config is created automatically to apply host settings, such as kernel boot parameters, for the profile <tuned_profile_name>. This involves finding all machine config pools with machine config selector matching <mcLabels> and setting the profile <tuned_profile_name> on all nodes that match the machine config pools' node selectors.
The list items match and machineConfigLabels are connected by the logical OR operator. The match item is evaluated first in a short-circuit manner. Therefore, if it evaluates to true, the machineConfigLabels item is not considered.
When using machine config pool based matching, it is advised to group nodes with the same hardware configuration into the same machine config pool. Not following this practice might result in Tuned operands calculating conflicting kernel parameters for two or more nodes sharing the same machine config pool.
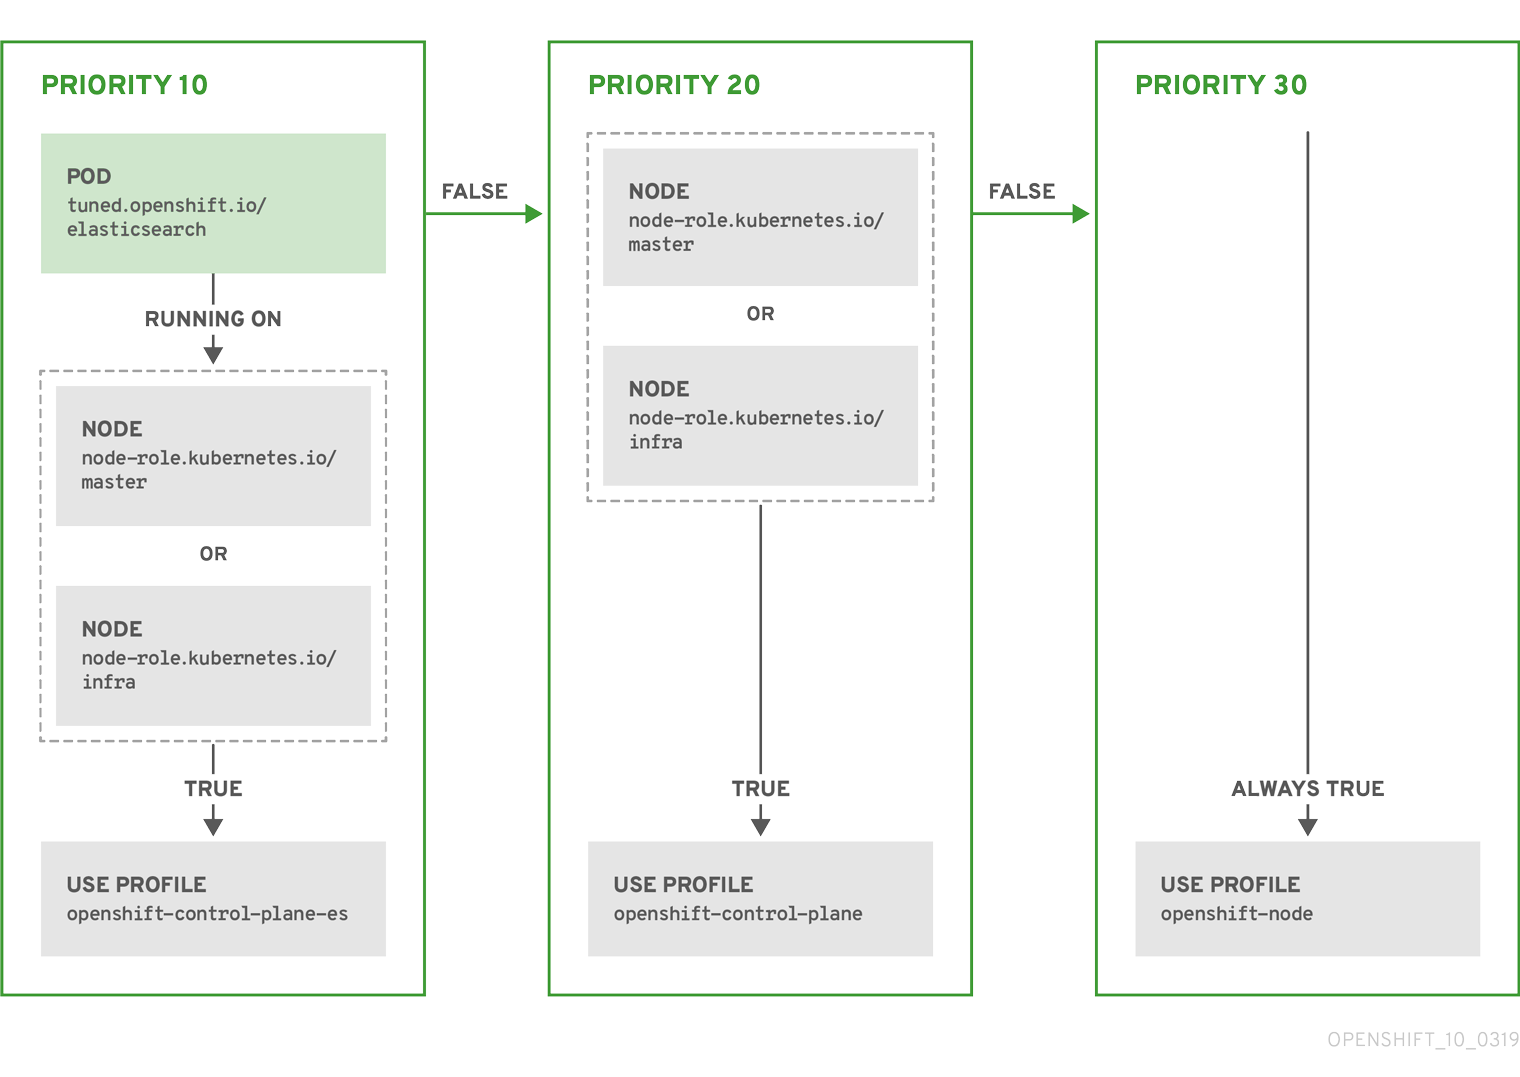
Example: node or pod label based matching
- match:
  - label: tuned.openshift.io/elasticsearch
    match:
    - label: node-role.kubernetes.io/master
    - label: node-role.kubernetes.io/infra
    type: pod
  priority: 10
  profile: openshift-control-plane-es
- match:
  - label: node-role.kubernetes.io/master
  - label: node-role.kubernetes.io/infra
  priority: 20
  profile: openshift-control-plane
- priority: 30
  profile: openshift-node
The CR above is translated for the containerized Tuned daemon into its recommend.conf file based on the profile priorities. The profile with the highest priority (10) is openshift-control-plane-es and, therefore, it is considered first. The containerized Tuned daemon running on a given node looks to see if there is a pod running on the same node with the tuned.openshift.io/elasticsearch label set. If not, the entire <match> section evaluates as false. If there is such a pod with the label, in order for the <match> section to evaluate to true, the node label also needs to be node-role.kubernetes.io/master or node-role.kubernetes.io/infra.
If the labels for the profile with priority 10 matched, openshift-control-plane-es profile is applied and no other profile is considered. If the node/pod label combination did not match, the second highest priority profile (openshift-control-plane) is considered. This profile is applied if the containerized Tuned pod runs on a node with labels node-role.kubernetes.io/master or node-role.kubernetes.io/infra.
Finally, the profile openshift-node has the lowest priority of 30. It lacks the <match> section and, therefore, will always match. It acts as a profile catch-all to set openshift-node profile, if no other profile with higher priority matches on a given node.
Example: machine config pool based matching
apiVersion: tuned.openshift.io/v1
kind: Tuned
metadata:
  name: openshift-node-custom
  namespace: openshift-cluster-node-tuning-operator
spec:
  profile:
  - data: |
      [main]
      summary=Custom OpenShift node profile with an additional kernel parameter
      include=openshift-node
      [bootloader]
      cmdline_openshift_node_custom=+skew_tick=1
    name: openshift-node-custom

  recommend:
  - machineConfigLabels:
      machineconfiguration.openshift.io/role: "worker-custom"
    priority: 20
    profile: openshift-node-custom
To minimize node reboots, label the target nodes with a label the machine config pool’s node selector will match, then create the Tuned CR above and finally create the custom machine config pool itself.
4.6. Custom tuning example
The following CR applies custom node-level tuning for OpenShift Container Platform nodes with label tuned.openshift.io/ingress-node-label set to any value. As an administrator, use the following command to create a custom Tuned CR.
Custom tuning example
$ oc create -f- <<_EOF_
apiVersion: tuned.openshift.io/v1
kind: Tuned
metadata:
  name: ingress
  namespace: openshift-cluster-node-tuning-operator
spec:
  profile:
  - data: |
      [main]
      summary=A custom OpenShift ingress profile
      include=openshift-control-plane
      [sysctl]
      net.ipv4.ip_local_port_range="1024 65535"
      net.ipv4.tcp_tw_reuse=1
    name: openshift-ingress
  recommend:
  - match:
    - label: tuned.openshift.io/ingress-node-label
    priority: 10
    profile: openshift-ingress
_EOF_
Custom profile writers are strongly encouraged to include the default Tuned daemon profiles shipped within the default Tuned CR. The example above uses the default openshift-control-plane profile to accomplish this.
4.7. Supported Tuned daemon plug-ins
Excluding the [main] section, the following Tuned plug-ins are supported when using custom profiles defined in the profile: section of the Tuned CR:
- audio
- cpu
- disk
- eeepc_she
- modules
- mounts
- net
- scheduler
- scsi_host
- selinux
- sysctl
- sysfs
- usb
- video
- vm
There is some dynamic tuning functionality provided by some of these plug-ins that is not supported. The following Tuned plug-ins are currently not supported:
- bootloader
- script
- systemd
See Available Tuned Plug-ins and Getting Started with Tuned for more information.
Chapter 5. Using Cluster Loader
Cluster Loader is a tool that deploys large numbers of various objects to a cluster, which creates user-defined cluster objects. Build, configure, and run Cluster Loader to measure performance metrics of your OpenShift Container Platform deployment at various cluster states.
5.1. Installing Cluster Loader
Procedure
To pull the container image, run:
$ podman pull quay.io/openshift/origin-tests:4.5
5.2. Running Cluster Loader
Prerequisites
- The repository will prompt you to authenticate. The registry credentials allow you to access the image, which is not publicly available. Use your existing authentication credentials from installation.
Procedure
Execute Cluster Loader using the built-in test configuration, which deploys five template builds and waits for them to complete:
$ podman run -v ${LOCAL_KUBECONFIG}:/root/.kube/config:z -i \
quay.io/openshift/origin-tests:4.5 /bin/bash -c 'export KUBECONFIG=/root/.kube/config && \
openshift-tests run-test "[sig-scalability][Feature:Performance] Load cluster \
should populate the cluster [Slow][Serial] [Suite:openshift]"'
Alternatively, execute Cluster Loader with a user-defined configuration by setting the environment variable for
VIPERCONFIG:$ podman run -v ${LOCAL_KUBECONFIG}:/root/.kube/config:z \ -v ${LOCAL_CONFIG_FILE_PATH}:/root/configs/:z \ -i quay.io/openshift/origin-tests:4.5 \ /bin/bash -c 'KUBECONFIG=/root/.kube/config VIPERCONFIG=/root/configs/test.yaml \ openshift-tests run-test "[sig-scalability][Feature:Performance] Load cluster \ should populate the cluster [Slow][Serial] [Suite:openshift]"'In this example,
${LOCAL_KUBECONFIG}refers to the path to thekubeconfigon your local file system. Also, there is a directory called${LOCAL_CONFIG_FILE_PATH}, which is mounted into the container that contains a configuration file calledtest.yaml. Additionally, if thetest.yamlreferences any external template files or podspec files, they should also be mounted into the container.
5.3. Configuring Cluster Loader
The tool creates multiple namespaces (projects), which contain multiple templates or pods.
5.3.1. Example Cluster Loader configuration file
Cluster Loader’s configuration file is a basic YAML file:
provider: local 1
ClusterLoader:
  cleanup: true
  projects:
    - num: 1
      basename: clusterloader-cakephp-mysql
      tuning: default
      ifexists: reuse
      templates:
        - num: 1
          file: cakephp-mysql.json

    - num: 1
      basename: clusterloader-dancer-mysql
      tuning: default
      ifexists: reuse
      templates:
        - num: 1
          file: dancer-mysql.json

    - num: 1
      basename: clusterloader-django-postgresql
      tuning: default
      ifexists: reuse
      templates:
        - num: 1
          file: django-postgresql.json

    - num: 1
      basename: clusterloader-nodejs-mongodb
      tuning: default
      ifexists: reuse
      templates:
        - num: 1
          file: quickstarts/nodejs-mongodb.json

    - num: 1
      basename: clusterloader-rails-postgresql
      tuning: default
      templates:
        - num: 1
          file: rails-postgresql.json

  tuningsets: 2
    - name: default
      pods:
        stepping: 3
          stepsize: 5
          pause: 0 s
        rate_limit: 4
          delay: 0 ms
- 1
- Optional setting for end-to-end tests. Set to
localto avoid extra log messages. - 2
- The tuning sets allow rate limiting and stepping, the ability to create several batches of pods while pausing in between sets. Cluster Loader monitors completion of the previous step before continuing.
- 3
- Stepping will pause for
Mseconds after eachNobjects are created. - 4
- Rate limiting will wait
Mmilliseconds between the creation of objects.
This example assumes that references to any external template files or pod spec files are also mounted into the container.
If you are running Cluster Loader on Microsoft Azure, then you must set the AZURE_AUTH_LOCATION variable to a file that contains the output of terraform.azure.auto.tfvars.json, which is present in the installer directory.
5.3.2. Configuration fields
Table 5.1. Top-level Cluster Loader Fields
| Field | Description |
|---|---|
|
|
Set to |
|
|
A sub-object with one or many definition(s). Under |
|
|
A sub-object with one definition per configuration. |
|
| An optional sub-object with one definition per configuration. Adds synchronization possibilities during object creation. |
Table 5.2. Fields under projects
| Field | Description |
|---|---|
|
| An integer. One definition of the count of how many projects to create. |
|
|
A string. One definition of the base name for the project. The count of identical namespaces will be appended to |
|
| A string. One definition of what tuning set you want to apply to the objects, which you deploy inside this namespace. |
|
|
A string containing either |
|
| A list of key-value pairs. The key is the config map name and the value is a path to a file from which you create the config map. |
|
| A list of key-value pairs. The key is the secret name and the value is a path to a file from which you create the secret. |
|
| A sub-object with one or many definition(s) of pods to deploy. |
|
| A sub-object with one or many definition(s) of templates to deploy. |
Table 5.3. Fields under pods and templates
| Field | Description |
|---|---|
|
| An integer. The number of pods or templates to deploy. |
|
| A string. The docker image URL to a repository where it can be pulled. |
|
| A string. One definition of the base name for the template (or pod) that you want to create. |
|
| A string. The path to a local file, which is either a pod spec or template to be created. |
|
|
Key-value pairs. Under |
Table 5.4. Fields under tuningsets
| Field | Description |
|---|---|
|
| A string. The name of the tuning set which will match the name specified when defining a tuning in a project. |
|
|
A sub-object identifying the |
|
|
A sub-object identifying the |
Table 5.5. Fields under tuningsets pods or tuningsets templates
| Field | Description |
|---|---|
|
| A sub-object. A stepping configuration used if you want to create an object in a step creation pattern. |
|
| A sub-object. A rate-limiting tuning set configuration to limit the object creation rate. |
Table 5.6. Fields under tuningsets pods or tuningsets templates, stepping
| Field | Description |
|---|---|
|
| An integer. How many objects to create before pausing object creation. |
|
|
An integer. How many seconds to pause after creating the number of objects defined in |
|
| An integer. How many seconds to wait before failure if the object creation is not successful. |
|
| An integer. How many milliseconds (ms) to wait between creation requests. |
Table 5.7. Fields under sync
| Field | Description |
|---|---|
|
|
A sub-object with |
|
|
A boolean. Wait for pods with labels matching |
|
|
A boolean. Wait for pods with labels matching |
|
|
A list of selectors to match pods in |
|
|
A string. The synchronization timeout period to wait for pods in |
5.4. Known issues
- Cluster Loader fails when called without configuration. (BZ#1761925)
If the
IDENTIFIERparameter is not defined in user templates, template creation fails witherror: unknown parameter name "IDENTIFIER". If you deploy templates, add this parameter to your template to avoid this error:{ "name": "IDENTIFIER", "description": "Number to append to the name of resources", "value": "1" }If you deploy pods, adding the parameter is unnecessary.
Chapter 6. Using CPU Manager
CPU Manager manages groups of CPUs and constrains workloads to specific CPUs.
CPU Manager is useful for workloads that have some of these attributes:
- Require as much CPU time as possible.
- Are sensitive to processor cache misses.
- Are low-latency network applications.
- Coordinate with other processes and benefit from sharing a single processor cache.
6.1. Setting up CPU Manager
Procedure
Optional: Label a node:
# oc label node perf-node.example.com cpumanager=true
Edit the
MachineConfigPoolof the nodes where CPU Manager should be enabled. In this example, all workers have CPU Manager enabled:# oc edit machineconfigpool worker
Add a label to the worker machine config pool:
metadata:
  creationTimestamp: 2020-xx-xxx
  generation: 3
  labels:
    custom-kubelet: cpumanager-enabled
Create a
KubeletConfig,cpumanager-kubeletconfig.yaml, custom resource (CR). Refer to the label created in the previous step to have the correct nodes updated with the new kubelet config. See themachineConfigPoolSelectorsection:apiVersion: machineconfiguration.openshift.io/v1 kind: KubeletConfig metadata: name: cpumanager-enabled spec: machineConfigPoolSelector: matchLabels: custom-kubelet: cpumanager-enabled kubeletConfig: cpuManagerPolicy: static 1 cpuManagerReconcilePeriod: 5s 2- 1
- Specify a policy:
-
none. This policy explicitly enables the existing default CPU affinity scheme, providing no affinity beyond what the scheduler does automatically. -
static. This policy allows pods with certain resource characteristics to be granted increased CPU affinity and exclusivity on the node.
-
- 2
- Optional. Specify the CPU Manager reconcile frequency. The default is
5s.
Create the dynamic kubelet config:
# oc create -f cpumanager-kubeletconfig.yaml
This adds the CPU Manager feature to the kubelet config and, if needed, the Machine Config Operator (MCO) reboots the node. To enable CPU Manager, a reboot is not needed.
Check for the merged kubelet config:
# oc get machineconfig 99-worker-XXXXXX-XXXXX-XXXX-XXXXX-kubelet -o json | grep ownerReference -A7
Example output
       "ownerReferences": [
            {
                "apiVersion": "machineconfiguration.openshift.io/v1",
                "kind": "KubeletConfig",
                "name": "cpumanager-enabled",
                "uid": "7ed5616d-6b72-11e9-aae1-021e1ce18878"
            }
        ]
Check the worker for the updated
kubelet.conf:# oc debug node/perf-node.example.com sh-4.2# cat /host/etc/kubernetes/kubelet.conf | grep cpuManager
Example output
cpuManagerPolicy: static        1
cpuManagerReconcilePeriod: 5s   2
Create a pod that requests a core or multiple cores. Both limits and requests must have their CPU value set to a whole integer. That is the number of cores that will be dedicated to this pod:
# cat cpumanager-pod.yaml
Example output
apiVersion: v1
kind: Pod
metadata:
  generateName: cpumanager-
spec:
  containers:
  - name: cpumanager
    image: gcr.io/google_containers/pause-amd64:3.0
    resources:
      requests:
        cpu: 1
        memory: "1G"
      limits:
        cpu: 1
        memory: "1G"
  nodeSelector:
    cpumanager: "true"
Create the pod:
# oc create -f cpumanager-pod.yaml
Verify that the pod is scheduled to the node that you labeled:
# oc describe pod cpumanager
Example output
Name:               cpumanager-6cqz7
Namespace:          default
Priority:           0
PriorityClassName:  <none>
Node:  perf-node.example.com/xxx.xx.xx.xxx
...
 Limits:
      cpu:     1
      memory:  1G
    Requests:
      cpu:        1
      memory:     1G
...
QoS Class:       Guaranteed
Node-Selectors:  cpumanager=true
Verify that the
cgroupsare set up correctly. Get the process ID (PID) of thepauseprocess:# ├─init.scope │ └─1 /usr/lib/systemd/systemd --switched-root --system --deserialize 17 └─kubepods.slice ├─kubepods-pod69c01f8e_6b74_11e9_ac0f_0a2b62178a22.slice │ ├─crio-b5437308f1a574c542bdf08563b865c0345c8f8c0b0a655612c.scope │ └─32706 /pause
Pods of quality of service (QoS) tier
Guaranteedare placed within thekubepods.slice. Pods of other QoS tiers end up in childcgroupsofkubepods:# cd /sys/fs/cgroup/cpuset/kubepods.slice/kubepods-pod69c01f8e_6b74_11e9_ac0f_0a2b62178a22.slice/crio-b5437308f1ad1a7db0574c542bdf08563b865c0345c86e9585f8c0b0a655612c.scope # for i in `ls cpuset.cpus tasks` ; do echo -n "$i "; cat $i ; done
Example output
cpuset.cpus 1
tasks 32706
Check the allowed CPU list for the task:
# grep ^Cpus_allowed_list /proc/32706/status
Example output
Cpus_allowed_list: 1
Verify that another pod (in this case, the pod in the
burstableQoS tier) on the system cannot run on the core allocated for theGuaranteedpod:# cat /sys/fs/cgroup/cpuset/kubepods.slice/kubepods-besteffort.slice/kubepods-besteffort-podc494a073_6b77_11e9_98c0_06bba5c387ea.slice/crio-c56982f57b75a2420947f0afc6cafe7534c5734efc34157525fa9abbf99e3849.scope/cpuset.cpus 0 # oc describe node perf-node.example.com
Example output
...
Capacity:
 attachable-volumes-aws-ebs:  39
 cpu:                         2
 ephemeral-storage:           124768236Ki
 hugepages-1Gi:               0
 hugepages-2Mi:               0
 memory:                      8162900Ki
 pods:                        250
Allocatable:
 attachable-volumes-aws-ebs:  39
 cpu:                         1500m
 ephemeral-storage:           124768236Ki
 hugepages-1Gi:               0
 hugepages-2Mi:               0
 memory:                      7548500Ki
 pods:                        250
-------                               ----                           ------------  ----------  ---------------  -------------  ---
  default                                 cpumanager-6cqz7               1 (66%)       1 (66%)     1G (12%)         1G (12%)       29m

Allocated resources:
  (Total limits may be over 100 percent, i.e., overcommitted.)
  Resource                    Requests          Limits
  --------                    --------          ------
  cpu                         1440m (96%)       1 (66%)
This VM has two CPU cores. The
system-reservedsetting reserves 500 millicores, meaning that half of one core is subtracted from the total capacity of the node to arrive at theNode Allocatableamount. You can see thatAllocatable CPUis 1500 millicores. This means you can run one of the CPU Manager pods since each will take one whole core. A whole core is equivalent to 1000 millicores. If you try to schedule a second pod, the system will accept the pod, but it will never be scheduled:NAME READY STATUS RESTARTS AGE cpumanager-6cqz7 1/1 Running 0 33m cpumanager-7qc2t 0/1 Pending 0 11s
Chapter 7. Using Topology Manager
Topology Manager collects hints from the CPU Manager, Device Manager, and other Hint Providers to align pod resources, such as CPU, SR-IOV VFs, and other device resources, for all Quality of Service (QoS) classes on the same non-uniform memory access (NUMA) node.
Topology Manager uses topology information from collected hints to decide if a pod can be accepted or rejected on a node, based on the configured Topology Manager policy and Pod resources requested.
Topology Manager is useful for workloads that use hardware accelerators to support latency-critical execution and high throughput parallel computation.
To use Topology Manager you must use the CPU Manager with the static policy. For more information on CPU Manager, see Using CPU Manager.
7.1. Topology Manager policies
Topology Manager aligns Pod resources of all Quality of Service (QoS) classes by collecting topology hints from Hint Providers, such as CPU Manager and Device Manager, and using the collected hints to align the Pod resources.
To align CPU resources with other requested resources in a Pod spec, the CPU Manager must be enabled with the static CPU Manager policy.
Topology Manager supports four allocation policies, which you assign in the cpumanager-enabled custom resource (CR):
nonepolicy- This is the default policy and does not perform any topology alignment.
best-effortpolicy-
For each container in a pod with the
best-efforttopology management policy, kubelet calls each Hint Provider to discover their resource availability. Using this information, the Topology Manager stores the preferred NUMA Node affinity for that container. If the affinity is not preferred, Topology Manager stores this and admits the pod to the node. restrictedpolicy-
For each container in a pod with the
restrictedtopology management policy, kubelet calls each Hint Provider to discover their resource availability. Using this information, the Topology Manager stores the preferred NUMA Node affinity for that container. If the affinity is not preferred, Topology Manager rejects this pod from the node, resulting in a pod in aTerminatedstate with a pod admission failure. single-numa-nodepolicy-
For each container in a pod with the
single-numa-nodetopology management policy, kubelet calls each Hint Provider to discover their resource availability. Using this information, the Topology Manager determines if a single NUMA Node affinity is possible. If it is, the pod is admitted to the node. If a single NUMA Node affinity is not possible, the Topology Manager rejects the pod from the node. This results in a pod in a Terminated state with a pod admission failure.
7.2. Setting up Topology Manager
To use Topology Manager, you must enable the LatencySensitive Feature Gate and configure the Topology Manager policy in the cpumanager-enabled custom resource (CR). This file might exist if you have set up CPU Manager. If the file does not exist, you can create the file.
Prequisites
-
Configure the CPU Manager policy to be
static. Refer to Using CPU Manager in the Scalability and Performance section.
Procedure
To activate Topololgy Manager:
Edit the
FeatureGateobject to add theLatencySensitivefeature set:$ oc edit featuregate/cluster
apiVersion: config.openshift.io/v1 kind: FeatureGate metadata: annotations: release.openshift.io/create-only: "true" creationTimestamp: 2020-06-05T14:41:09Z generation: 2 managedFields: - apiVersion: config.openshift.io/v1 fieldsType: FieldsV1 fieldsV1: f:metadata: f:annotations: .: {} f:release.openshift.io/create-only: {} f:spec: {} manager: cluster-version-operator operation: Update time: 2020-06-05T14:41:09Z - apiVersion: config.openshift.io/v1 fieldsType: FieldsV1 fieldsV1: f:spec: f:featureSet: {} manager: oc operation: Update time: 2020-06-05T15:21:44Z name: cluster resourceVersion: "28457" selfLink: /apis/config.openshift.io/v1/featuregates/cluster uid: e802e840-89ee-4137-a7e5-ca15fd2806f8 spec: featureSet: LatencySensitive 1 ...- 1
- Add the
LatencySensitivefeature set in a comma-separated list.
Configure the Topology Manager policy in the
cpumanager-enabledcustom resource (CR).$ oc edit KubeletConfig cpumanager-enabled
apiVersion: machineconfiguration.openshift.io/v1
kind: KubeletConfig
metadata:
  name: cpumanager-enabled
spec:
  machineConfigPoolSelector:
    matchLabels:
      custom-kubelet: cpumanager-enabled
  kubeletConfig:
     cpuManagerPolicy: static 1
     cpuManagerReconcilePeriod: 5s
     topologyManagerPolicy: single-numa-node 2
Additional resources
For more information on CPU Manager, see Using CPU Manager.
7.3. Pod interactions with Topology Manager policies
The example Pod specs below help illustrate pod interactions with Topology Manager.
The following pod runs in the BestEffort QoS class because no resource requests or limits are specified.
spec:
  containers:
  - name: nginx
    image: nginx
The next pod runs in the Burstable QoS class because requests are less than limits.
spec:
  containers:
  - name: nginx
    image: nginx
    resources:
      limits:
        memory: "200Mi"
      requests:
        memory: "100Mi"
If the selected policy is anything other than none, Topology Manager would not consider either of these Pod specifications.
The last example pod below runs in the Guaranteed QoS class because requests are equal to limits.
spec:
  containers:
  - name: nginx
    image: nginx
    resources:
      limits:
        memory: "200Mi"
        cpu: "2"
        example.com/device: "1"
      requests:
        memory: "200Mi"
        cpu: "2"
        example.com/device: "1"
Topology Manager would consider this pod. The Topology Manager consults the CPU Manager static policy, which returns the topology of available CPUs. Topology Manager also consults Device Manager to discover the topology of available devices for example.com/device.
Topology Manager will use this information to store the best Topology for this container. In the case of this pod, CPU Manager and Device Manager will use this stored information at the resource allocation stage.
Chapter 8. Scaling the Cluster Monitoring Operator
OpenShift Container Platform exposes metrics that the Cluster Monitoring Operator collects and stores in the Prometheus-based monitoring stack. As an administrator, you can view system resources, containers and components metrics in one dashboard interface, Grafana.
8.1. Prometheus database storage requirements
Red Hat performed various tests for different scale sizes.
The Prometheus storage requirements below are not prescriptive. Higher resource consumption might be observed in your cluster depending on workload activity and resource use.
Table 8.1. Prometheus Database storage requirements based on number of nodes/pods in the cluster
| Number of Nodes | Number of pods | Prometheus storage growth per day | Prometheus storage growth per 15 days | RAM Space (per scale size) | Network (per tsdb chunk) |
|---|---|---|---|---|---|
| 50 | 1800 | 6.3 GB | 94 GB | 6 GB | 16 MB |
| 100 | 3600 | 13 GB | 195 GB | 10 GB | 26 MB |
| 150 | 5400 | 19 GB | 283 GB | 12 GB | 36 MB |
| 200 | 7200 | 25 GB | 375 GB | 14 GB | 46 MB |
Approximately 20 percent of the expected size was added as overhead to ensure that the storage requirements do not exceed the calculated value.
The above calculation is for the default OpenShift Container Platform Cluster Monitoring Operator.
CPU utilization has minor impact. The ratio is approximately 1 core out of 40 per 50 nodes and 1800 pods.
Recommendations for OpenShift Container Platform
- Use at least three infrastructure (infra) nodes.
- Use at least three openshift-container-storage nodes with non-volatile memory express (NVMe) drives.
8.2. Configuring cluster monitoring
Procedure
To increase the storage capacity for Prometheus:
Create a YAML configuration file,
cluster-monitoring-config.yml. For example:apiVersion: v1 kind: ConfigMap data: config.yaml: | prometheusOperator: baseImage: quay.io/coreos/prometheus-operator prometheusConfigReloaderBaseImage: quay.io/coreos/prometheus-config-reloader configReloaderBaseImage: quay.io/coreos/configmap-reload nodeSelector: node-role.kubernetes.io/infra: "" prometheusK8s: retention: {{PROMETHEUS_RETENTION_PERIOD}} 1 baseImage: openshift/prometheus nodeSelector: node-role.kubernetes.io/infra: "" volumeClaimTemplate: spec: storageClassName: gp2 resources: requests: storage: {{PROMETHEUS_STORAGE_SIZE}} 2 alertmanagerMain: baseImage: openshift/prometheus-alertmanager nodeSelector: node-role.kubernetes.io/infra: "" volumeClaimTemplate: spec: storageClassName: gp2 resources: requests: storage: {{ALERTMANAGER_STORAGE_SIZE}} 3 nodeExporter: baseImage: openshift/prometheus-node-exporter kubeRbacProxy: baseImage: quay.io/coreos/kube-rbac-proxy kubeStateMetrics: baseImage: quay.io/coreos/kube-state-metrics nodeSelector: node-role.kubernetes.io/infra: "" grafana: baseImage: grafana/grafana nodeSelector: node-role.kubernetes.io/infra: "" auth: baseImage: openshift/oauth-proxy k8sPrometheusAdapter: nodeSelector: node-role.kubernetes.io/infra: "" metadata: name: cluster-monitoring-config namespace: openshift-monitoring- 1
- A typical value is
PROMETHEUS_RETENTION_PERIOD=15d. Units are measured in time using one of these suffixes: s, m, h, d. - 2
- A typical value is
PROMETHEUS_STORAGE_SIZE=2000Gi. Storage values can be a plain integer or as a fixed-point integer using one of these suffixes: E, P, T, G, M, K. You can also use the power-of-two equivalents: Ei, Pi, Ti, Gi, Mi, Ki. - 3
- A typical value is
ALERTMANAGER_STORAGE_SIZE=20Gi. Storage values can be a plain integer or as a fixed-point integer using one of these suffixes: E, P, T, G, M, K. You can also use the power-of-two equivalents: Ei, Pi, Ti, Gi, Mi, Ki.
- Set the values like the retention period and storage sizes.
Apply the changes by running:
$ oc create -f cluster-monitoring-config.yml
Chapter 9. Planning your environment according to object maximums
Consider the following tested object maximums when you plan your OpenShift Container Platform cluster.
These guidelines are based on the largest possible cluster. For smaller clusters, the maximums are lower. There are many factors that influence the stated thresholds, including the etcd version or storage data format.
In most cases, exceeding these numbers results in lower overall performance. It does not necessarily mean that the cluster will fail.
9.1. OpenShift Container Platform tested cluster maximums for major releases
Tested Cloud Platforms for OpenShift Container Platform 3.x: Red Hat OpenStack Platform (RHOSP), Amazon Web Services and Microsoft Azure. Tested Cloud Platforms for OpenShift Container Platform 4.x: Amazon Web Services, Microsoft Azure and Google Cloud Platform.
| Maximum type | 3.x tested maximum | 4.x tested maximum |
|---|---|---|
| Number of nodes | 2,000 | 2,000 |
| Number of pods [1] | 150,000 | 150,000 |
| Number of pods per node | 250 | 500 [2] |
| Number of pods per core | There is no default value. | There is no default value. |
| Number of namespaces [3] | 10,000 | 10,000 |
| Number of builds | 10,000 (Default pod RAM 512 Mi) - Pipeline Strategy | 10,000 (Default pod RAM 512 Mi) - Source-to-Image (S2I) build strategy |
| Number of pods per namespace [4] | 25,000 | 25,000 |
| Number of services [5] | 10,000 | 10,000 |
| Number of services per namespace | 5,000 | 5,000 |
| Number of back-ends per service | 5,000 | 5,000 |
| Number of deployments per namespace [4] | 2,000 | 2,000 |
- The pod count displayed here is the number of test pods. The actual number of pods depends on the application’s memory, CPU, and storage requirements.
-
This was tested on a cluster with 100 worker nodes with 500 pods per worker node. The default
maxPodsis still 250. To get to 500maxPods, the cluster must be created with amaxPodsset to500using a custom kubelet config. If you need 500 user pods, you need ahostPrefixof22because there are 10-15 system pods already running on the node. The maximum number of pods with attached persistent volume claims (PVC) depends on storage backend from where PVC are allocated. In our tests, only OpenShift Container Storage v4 (OCS v4) was able to satisfy the number of pods per node discussed in this document. - When there are a large number of active projects, etcd might suffer from poor performance if the keyspace grows excessively large and exceeds the space quota. Periodic maintenance of etcd, including defragmentaion, is highly recommended to free etcd storage.
- There are a number of control loops in the system that must iterate over all objects in a given namespace as a reaction to some changes in state. Having a large number of objects of a given type in a single namespace can make those loops expensive and slow down processing given state changes. The limit assumes that the system has enough CPU, memory, and disk to satisfy the application requirements.
- Each service port and each service back-end has a corresponding entry in iptables. The number of back-ends of a given service impact the size of the endpoints objects, which impacts the size of data that is being sent all over the system.
9.2. OpenShift Container Platform tested cluster maximums
| Maximum type | 4.1 tested maximum | 4.2 tested maximum | 4.3 tested maximum | 4.4 tested maximum | 4.5 tested maximum |
|---|---|---|---|---|---|
| Number of nodes | 2,000 | 2,000 | 2,000 | 250 | 500 |
| Number of pods [1] | 150,000 | 150,000 | 150,000 | 62,500 | 62,500 |
| Number of pods per node | 250 | 250 | 500 | 500 | 500 |
| Number of pods per core | There is no default value. | There is no default value. | There is no default value. | There is no default value. | There is no default value. |
| Number of namespaces [2] | 10,000 | 10,000 | 10,000 | 10,000 | 10,000 |
| Number of builds | 10,000 (Default pod RAM 512 Mi) - Pipeline Strategy | 10,000 (Default pod RAM 512 Mi) - Pipeline Strategy | 10,000 (Default pod RAM 512 Mi) - Source-to-Image (S2I) build strategy | 10,000 (Default pod RAM 512 Mi) - Source-to-Image (S2I) build strategy | 10,000 (Default pod RAM 512 Mi) - Source-to-Image (S2I) build strategy |
| Number of pods per namespace [3] | 25,000 | 25,000 | 25,000 | 25,000 | 25,000 |
| Number of services [4] | 10,000 | 10,000 | 10,000 | 10,000 | 10,000 |
| Number of services per namespace | 5,000 | 5,000 | 5,000 | 5,000 | 5,000 |
| Number of back ends per service | 5,000 | 5,000 | 5,000 | 5,000 | 5,000 |
| Number of deployments per namespace [3] | 2,000 | 2,000 | 2,000 | 2,000 | 2,000 |
- The pod count displayed here is the number of test pods. The actual number of pods depends on the application’s memory, CPU, and storage requirements.
- When there are a large number of active projects, etcd might suffer from poor performance if the keyspace grows excessively large and exceeds the space quota. Periodic maintenance of etcd, including defragmentaion, is highly recommended to free etcd storage.
- There are a number of control loops in the system that must iterate over all objects in a given namespace as a reaction to some changes in state. Having a large number of objects of a given type in a single namespace can make those loops expensive and slow down processing given state changes. The limit assumes that the system has enough CPU, memory, and disk to satisfy the application requirements.
- Each service port and each service back end has a corresponding entry in iptables. The number of back ends of a given service impact the size of the endpoints objects, which impacts the size of data that is being sent all over the system.
9.3. OpenShift Container Platform environment and configuration on which the cluster maximums are tested
AWS cloud platform:
| Node | Flavor | vCPU | RAM(GiB) | Disk type | Disk size(GiB)/IOS | Count | Region |
|---|---|---|---|---|---|---|---|
| Master/etcd [1] | r5.4xlarge | 16 | 128 | io1 | 220 / 3000 | 3 | us-west-2 |
| Infra [2] | m5.12xlarge | 48 | 192 | gp2 | 100 | 3 | us-west-2 |
| Workload [3] | m5.4xlarge | 16 | 64 | gp2 | 500 [4] | 1 | us-west-2 |
| Worker | m5.2xlarge | 8 | 32 | gp2 | 100 | 3/25/250/500 [5] | us-west-2 |
- io1 disks with 3000 IOPS are used for master/etcd nodes as etcd is I/O intensive and latency sensitive.
- Infra nodes are used to host Monitoring, Ingress, and Registry components to ensure they have enough resources to run at large scale.
- Workload node is dedicated to run performance and scalability workload generators.
- Larger disk size is used so that there is enough space to store the large amounts of data that is collected during the performance and scalability test run.
- Cluster is scaled in iterations and performance and scalability tests are executed at the specified node counts.
9.4. How to plan your environment according to tested cluster maximums
Oversubscribing the physical resources on a node affects resource guarantees the Kubernetes scheduler makes during pod placement. Learn what measures you can take to avoid memory swapping.
Some of the tested maximums are stretched only in a single dimension. They will vary when many objects are running on the cluster.
The numbers noted in this documentation are based on Red Hat’s test methodology, setup, configuration, and tunings. These numbers can vary based on your own individual setup and environments.
While planning your environment, determine how many pods are expected to fit per node:
required pods per cluster / pods per node = total number of nodes needed
The current maximum number of pods per node is 250. However, the number of pods that fit on a node is dependent on the application itself. Consider the application’s memory, CPU, and storage requirements, as described in How to plan your environment according to application requirements.
Example scenario
If you want to scope your cluster for 2200 pods per cluster, you would need at least five nodes, assuming that there are 500 maximum pods per node:
2200 / 500 = 4.4
If you increase the number of nodes to 20, then the pod distribution changes to 110 pods per node:
2200 / 20 = 110
Where:
required pods per cluster / total number of nodes = expected pods per node
9.5. How to plan your environment according to application requirements
Consider an example application environment:
| Pod type | Pod quantity | Max memory | CPU cores | Persistent storage |
|---|---|---|---|---|
| apache | 100 | 500 MB | 0.5 | 1 GB |
| node.js | 200 | 1 GB | 1 | 1 GB |
| postgresql | 100 | 1 GB | 2 | 10 GB |
| JBoss EAP | 100 | 1 GB | 1 | 1 GB |
Extrapolated requirements: 550 CPU cores, 450GB RAM, and 1.4TB storage.
Instance size for nodes can be modulated up or down, depending on your preference. Nodes are often resource overcommitted. In this deployment scenario, you can choose to run additional smaller nodes or fewer larger nodes to provide the same amount of resources. Factors such as operational agility and cost-per-instance should be considered.
| Node type | Quantity | CPUs | RAM (GB) |
|---|---|---|---|
| Nodes (option 1) | 100 | 4 | 16 |
| Nodes (option 2) | 50 | 8 | 32 |
| Nodes (option 3) | 25 | 16 | 64 |
Some applications lend themselves well to overcommitted environments, and some do not. Most Java applications and applications that use huge pages are examples of applications that would not allow for overcommitment. That memory can not be used for other applications. In the example above, the environment would be roughly 30 percent overcommitted, a common ratio.
The application pods can access a service either by using environment variables or DNS. If using environment variables, for each active service the variables are injected by the kubelet when a pod is run on a node. A cluster-aware DNS server watches the Kubernetes API for new services and creates a set of DNS records for each one. If DNS is enabled throughout your cluster, then all pods should automatically be able to resolve services by their DNS name. Service discovery using DNS can be used in case you must go beyond 5000 services. When using environment variables for service discovery, the argument list exceeds the allowed length after 5000 services in a namespace, then the pods and deployments will start failing. Disable the service links in the deployment’s service specification file to overcome this:
 ---
    Kind: Template
    apiVersion: v1
    metadata:
      name: deploymentConfigTemplate
      creationTimestamp:
      annotations:
        description: This template will create a deploymentConfig with 1 replica, 4 env vars and a service.
        tags: ''
    objects:
    - kind: DeploymentConfig
      apiVersion: v1
      metadata:
        name: deploymentconfig${IDENTIFIER}
      spec:
        template:
          metadata:
            labels:
              name: replicationcontroller${IDENTIFIER}
          spec:
            enableServiceLinks: false
            containers:
            - name: pause${IDENTIFIER}
              image: "${IMAGE}"
              ports:
              - containerPort: 8080
                protocol: TCP
              env:
              - name: ENVVAR1_${IDENTIFIER}
                value: "${ENV_VALUE}"
              - name: ENVVAR2_${IDENTIFIER}
                value: "${ENV_VALUE}"
              - name: ENVVAR3_${IDENTIFIER}
                value: "${ENV_VALUE}"
              - name: ENVVAR4_${IDENTIFIER}
                value: "${ENV_VALUE}"
              resources: {}
              imagePullPolicy: IfNotPresent
              capabilities: {}
              securityContext:
                capabilities: {}
                privileged: false
            restartPolicy: Always
            serviceAccount: ''
        replicas: 1
        selector:
          name: replicationcontroller${IDENTIFIER}
        triggers:
        - type: ConfigChange
        strategy:
          type: Rolling
    - kind: Service
      apiVersion: v1
      metadata:
        name: service${IDENTIFIER}
      spec:
        selector:
          name: replicationcontroller${IDENTIFIER}
        ports:
        - name: serviceport${IDENTIFIER}
          protocol: TCP
          port: 80
          targetPort: 8080
        portalIP: ''
        type: ClusterIP
        sessionAffinity: None
      status:
        loadBalancer: {}
    parameters:
    - name: IDENTIFIER
      description: Number to append to the name of resources
      value: '1'
      required: true
    - name: IMAGE
      description: Image to use for deploymentConfig
      value: gcr.io/google-containers/pause-amd64:3.0
      required: false
    - name: ENV_VALUE
      description: Value to use for environment variables
      generate: expression
      from: "[A-Za-z0-9]{255}"
      required: false
    labels:
      template: deploymentConfigTemplate
Chapter 10. Optimizing storage
Optimizing storage helps to minimize storage use across all resources. By optimizing storage, administrators help ensure that existing storage resources are working in an efficient manner.
10.1. Available persistent storage options
Understand your persistent storage options so that you can optimize your OpenShift Container Platform environment.
Table 10.1. Available storage options
| Storage type | Description | Examples |
|---|---|---|
| Block |
| AWS EBS and VMware vSphere support dynamic persistent volume (PV) provisioning natively in OpenShift Container Platform. |
| File |
| RHEL NFS, NetApp NFS [1], and Vendor NFS |
| Object |
| AWS S3 |
- NetApp NFS supports dynamic PV provisioning when using the Trident plug-in.
Currently, CNS is not supported in OpenShift Container Platform 4.5.
10.2. Recommended configurable storage technology
The following table summarizes the recommended and configurable storage technologies for the given OpenShift Container Platform cluster application.
Table 10.2. Recommended and configurable storage technology
| Storage type | ROX1 | RWX2 | Registry | Scaled registry | Metrics3 | Logging | Apps |
|---|---|---|---|---|---|---|---|
|
1
2 3 Prometheus is the underlying technology used for metrics. 4 This does not apply to physical disk, VM physical disk, VMDK, loopback over NFS, AWS EBS, and Azure Disk.
5 For metrics, using file storage with the 6 For logging, using any shared storage would be an anti-pattern. One volume per elasticsearch is required. 7 Object storage is not consumed through OpenShift Container Platform’s PVs or PVCs. Apps must integrate with the object storage REST API. | |||||||
| Block | Yes4 | No | Configurable | Not configurable | Recommended | Recommended | Recommended |
| File | Yes4 | Yes | Configurable | Configurable | Configurable5 | Configurable6 | Recommended |
| Object | Yes | Yes | Recommended | Recommended | Not configurable | Not configurable | Not configurable7 |
A scaled registry is an OpenShift Container Platform registry where two or more pod replicas are running.
10.2.1. Specific application storage recommendations
Testing shows issues with using the NFS server on Red Hat Enterprise Linux (RHEL) as storage backend for core services. This includes the OpenShift Container Registry and Quay, Prometheus for monitoring storage, and Elasticsearch for logging storage. Therefore, using RHEL NFS to back PVs used by core services is not recommended.
Other NFS implementations on the marketplace might not have these issues. Contact the individual NFS implementation vendor for more information on any testing that was possibly completed against these OpenShift Container Platform core components.
10.2.1.1. Registry
In a non-scaled/high-availability (HA) OpenShift Container Platform registry cluster deployment:
- The storage technology does not have to support RWX access mode.
- The storage technology must ensure read-after-write consistency.
- The preferred storage technology is object storage followed by block storage.
- File storage is not recommended for OpenShift Container Platform registry cluster deployment with production workloads.
10.2.1.2. Scaled registry
In a scaled/HA OpenShift Container Platform registry cluster deployment:
- The storage technology must support RWX access mode and must ensure read-after-write consistency.
- The preferred storage technology is object storage.
- Amazon Simple Storage Service (Amazon S3), Google Cloud Storage (GCS), Microsoft Azure Blob Storage, and OpenStack Swift are supported.
- Object storage should be S3 or Swift compliant.
- File storage is not recommended for a scaled/HA OpenShift Container Platform registry cluster deployment with production workloads.
- For non-cloud platforms, such as vSphere and bare metal installations, the only configurable technology is file storage.
- Block storage is not configurable.
10.2.1.3. Metrics
In an OpenShift Container Platform hosted metrics cluster deployment:
- The preferred storage technology is block storage.
- Object storage is not configurable.
It is not recommended to use file storage for a hosted metrics cluster deployment with production workloads.
10.2.1.4. Logging
In an OpenShift Container Platform hosted logging cluster deployment:
- The preferred storage technology is block storage.
- File storage is not recommended for a scaled/HA OpenShift Container Platform registry cluster deployment with production workloads.
- Object storage is not configurable.
Testing shows issues with using the NFS server on RHEL as storage backend for core services. This includes Elasticsearch for logging storage. Therefore, using RHEL NFS to back PVs used by core services is not recommended.
Other NFS implementations on the marketplace might not have these issues. Contact the individual NFS implementation vendor for more information on any testing that was possibly completed against these OpenShift Container Platform core components.
10.2.1.5. Applications
Application use cases vary from application to application, as described in the following examples:
- Storage technologies that support dynamic PV provisioning have low mount time latencies, and are not tied to nodes to support a healthy cluster.
- Application developers are responsible for knowing and understanding the storage requirements for their application, and how it works with the provided storage to ensure that issues do not occur when an application scales or interacts with the storage layer.
10.2.2. Other specific application storage recommendations
-
OpenShift Container Platform Internal
etcd: For the bestetcdreliability, the lowest consistent latency storage technology is preferable. -
It is highly recommended that you use
etcdwith storage that handles serial writes (fsync) quickly, such as NVMe or SSD. Ceph, NFS, and spinning disks are not recommended. - Red Hat OpenStack Platform (RHOSP) Cinder: RHOSP Cinder tends to be adept in ROX access mode use cases.
- Databases: Databases (RDBMSs, NoSQL DBs, etc.) tend to perform best with dedicated block storage.
10.3. Data storage management
The following table summarizes the main directories that OpenShift Container Platform components write data to.
Table 10.3. Main directories for storing OpenShift Container Platform data
| Directory | Notes | Sizing | Expected growth |
|---|---|---|---|
| /var/log | Log files for all components. | 10 to 30 GB. | Log files can grow quickly; size can be managed by growing disks or by using log rotate. |
| /var/lib/etcd | Used for etcd storage when storing the database. | Less than 20 GB. Database can grow up to 8 GB. | Will grow slowly with the environment. Only storing metadata. Additional 20-25 GB for every additional 8 GB of memory. |
| /var/lib/containers | This is the mount point for the CRI-O runtime. Storage used for active container runtimes, including pods, and storage of local images. Not used for registry storage. | 50 GB for a node with 16 GB memory. Note that this sizing should not be used to determine minimum cluster requirements. Additional 20-25 GB for every additional 8 GB of memory. | Growth is limited by capacity for running containers. |
| /var/lib/kubelet | Ephemeral volume storage for pods. This includes anything external that is mounted into a container at runtime. Includes environment variables, kube secrets, and data volumes not backed by persistent volumes. | Varies | Minimal if pods requiring storage are using persistent volumes. If using ephemeral storage, this can grow quickly. |
Chapter 11. Optimizing routing
The OpenShift Container Platform HAProxy router scales to optimize performance.
11.1. Baseline Ingress Controller (router) performance
The OpenShift Container Platform Ingress Controller, or router, is the Ingress point for all external traffic destined for OpenShift Container Platform services.
When evaluating a single HAProxy router performance in terms of HTTP requests handled per second, the performance varies depending on many factors. In particular:
- HTTP keep-alive/close mode
- Route type
- TLS session resumption client support
- Number of concurrent connections per target route
- Number of target routes
- Back end server page size
- Underlying infrastructure (network/SDN solution, CPU, and so on)
While performance in your specific environment will vary, Red Hat lab tests on a public cloud instance of size 4 vCPU/16GB RAM. A single HAProxy router handling 100 routes terminated by backends serving 1kB static pages is able to handle the following number of transactions per second.
In HTTP keep-alive mode scenarios:
| Encryption | LoadBalancerService | HostNetwork |
|---|---|---|
| none | 21515 | 29622 |
| edge | 16743 | 22913 |
| passthrough | 36786 | 53295 |
| re-encrypt | 21583 | 25198 |
In HTTP close (no keep-alive) scenarios:
| Encryption | LoadBalancerService | HostNetwork |
|---|---|---|
| none | 5719 | 8273 |
| edge | 2729 | 4069 |
| passthrough | 4121 | 5344 |
| re-encrypt | 2320 | 2941 |
Default Ingress Controller configuration with ROUTER_THREADS=4 was used and two different endpoint publishing strategies (LoadBalancerService/HostNetwork) were tested. TLS session resumption was used for encrypted routes. With HTTP keep-alive, a single HAProxy router is capable of saturating 1 Gbit NIC at page sizes as small as 8 kB.
When running on bare metal with modern processors, you can expect roughly twice the performance of the public cloud instance above. This overhead is introduced by the virtualization layer in place on public clouds and holds mostly true for private cloud-based virtualization as well. The following table is a guide to how many applications to use behind the router:
| Number of applications | Application type |
|---|---|
| 5-10 | static file/web server or caching proxy |
| 100-1000 | applications generating dynamic content |
In general, HAProxy can support routes for 5 to 1000 applications, depending on the technology in use. Ingress Controller performance might be limited by the capabilities and performance of the applications behind it, such as language or static versus dynamic content.
Ingress, or router, sharding should be used to serve more routes towards applications and help horizontally scale the routing tier.
For more information on Ingress sharding, see Configuring Ingress Controller sharding by using route labels and Configuring Ingress Controller sharding by using namespace labels.
11.2. Ingress Controller (router) performance optimizations
OpenShift Container Platform no longer supports modifying Ingress Controller deployments by setting environment variables such as ROUTER_THREADS, ROUTER_DEFAULT_TUNNEL_TIMEOUT, ROUTER_DEFAULT_CLIENT_TIMEOUT, ROUTER_DEFAULT_SERVER_TIMEOUT, and RELOAD_INTERVAL.
You can modify the Ingress Controller deployment, but if the Ingress Operator is enabled, the configuration is overwritten.
Chapter 12. Optimizing networking
The OpenShift SDN uses OpenvSwitch, virtual extensible LAN (VXLAN) tunnels, OpenFlow rules, and iptables. This network can be tuned by using jumbo frames, network interface cards (NIC) offloads, multi-queue, and ethtool settings.
OVN-Kubernetes uses Geneve (Generic Network Virtualization Encapsulation) instead of VXLAN as the tunnel protocol.
VXLAN provides benefits over VLANs, such as an increase in networks from 4096 to over 16 million, and layer 2 connectivity across physical networks. This allows for all pods behind a service to communicate with each other, even if they are running on different systems.
VXLAN encapsulates all tunneled traffic in user datagram protocol (UDP) packets. However, this leads to increased CPU utilization. Both these outer- and inner-packets are subject to normal checksumming rules to guarantee data is not corrupted during transit. Depending on CPU performance, this additional processing overhead can cause a reduction in throughput and increased latency when compared to traditional, non-overlay networks.
Cloud, VM, and bare metal CPU performance can be capable of handling much more than one Gbps network throughput. When using higher bandwidth links such as 10 or 40 Gbps, reduced performance can occur. This is a known issue in VXLAN-based environments and is not specific to containers or OpenShift Container Platform. Any network that relies on VXLAN tunnels will perform similarly because of the VXLAN implementation.
If you are looking to push beyond one Gbps, you can:
- Evaluate network plug-ins that implement different routing techniques, such as border gateway protocol (BGP).
- Use VXLAN-offload capable network adapters. VXLAN-offload moves the packet checksum calculation and associated CPU overhead off of the system CPU and onto dedicated hardware on the network adapter. This frees up CPU cycles for use by pods and applications, and allows users to utilize the full bandwidth of their network infrastructure.
VXLAN-offload does not reduce latency. However, CPU utilization is reduced even in latency tests.
12.1. Optimizing the MTU for your network
There are two important maximum transmission units (MTUs): the network interface card (NIC) MTU and the cluster network MTU.
The NIC MTU is only configured at the time of OpenShift Container Platform installation. The MTU must be less than or equal to the maximum supported value of the NIC of your network. If you are optimizing for throughput, choose the largest possible value. If you are optimizing for lowest latency, choose a lower value.
The SDN overlay’s MTU must be less than the NIC MTU by 50 bytes at a minimum. This accounts for the SDN overlay header. So, on a normal ethernet network, set this to 1450. On a jumbo frame ethernet network, set this to 8950.
For OVN and Geneve, the MTU must be less than the NIC MTU by 100 bytes at a minimum.
This 50 byte overlay header is relevant to the OpenShift SDN. Other SDN solutions might require the value to be more or less.
12.2. Recommended practices for installing large scale clusters
When installing large clusters or scaling the cluster to larger node counts, set the cluster network cidr accordingly in your install-config.yaml file before you install the cluster:
networking:
  clusterNetwork:
  - cidr: 10.128.0.0/14
    hostPrefix: 23
  machineCIDR: 10.0.0.0/16
  networkType: OpenShiftSDN
  serviceNetwork:
  - 172.30.0.0/16
The default cluster network cidr 10.128.0.0/14 cannot be used if the cluster size is more than 500 nodes. It must be set to 10.128.0.0/12 or 10.128.0.0/10 to get to larger node counts beyond 500 nodes.
12.3. Impact of IPsec
Because encrypting and decrypting node hosts uses CPU power, performance is affected both in throughput and CPU usage on the nodes when encryption is enabled, regardless of the IP security system being used.
IPSec encrypts traffic at the IP payload level, before it hits the NIC, protecting fields that would otherwise be used for NIC offloading. This means that some NIC acceleration features might not be usable when IPSec is enabled and will lead to decreased throughput and increased CPU usage.
Chapter 13. What huge pages do and how they are consumed by applications
13.1. What huge pages do
Memory is managed in blocks known as pages. On most systems, a page is 4Ki. 1Mi of memory is equal to 256 pages; 1Gi of memory is 256,000 pages, and so on. CPUs have a built-in memory management unit that manages a list of these pages in hardware. The Translation Lookaside Buffer (TLB) is a small hardware cache of virtual-to-physical page mappings. If the virtual address passed in a hardware instruction can be found in the TLB, the mapping can be determined quickly. If not, a TLB miss occurs, and the system falls back to slower, software-based address translation, resulting in performance issues. Since the size of the TLB is fixed, the only way to reduce the chance of a TLB miss is to increase the page size.
A huge page is a memory page that is larger than 4Ki. On x86_64 architectures, there are two common huge page sizes: 2Mi and 1Gi. Sizes vary on other architectures. In order to use huge pages, code must be written so that applications are aware of them. Transparent Huge Pages (THP) attempt to automate the management of huge pages without application knowledge, but they have limitations. In particular, they are limited to 2Mi page sizes. THP can lead to performance degradation on nodes with high memory utilization or fragmentation due to defragmenting efforts of THP, which can lock memory pages. For this reason, some applications may be designed to (or recommend) usage of pre-allocated huge pages instead of THP.
In OpenShift Container Platform, applications in a pod can allocate and consume pre-allocated huge pages.
13.2. How huge pages are consumed by apps
Nodes must pre-allocate huge pages in order for the node to report its huge page capacity. A node can only pre-allocate huge pages for a single size.
Huge pages can be consumed through container-level resource requirements using the resource name hugepages-<size>, where size is the most compact binary notation using integer values supported on a particular node. For example, if a node supports 2048KiB page sizes, it exposes a schedulable resource hugepages-2Mi. Unlike CPU or memory, huge pages do not support over-commitment.
apiVersion: v1
kind: Pod
metadata:
  generateName: hugepages-volume-
spec:
  containers:
  - securityContext:
      privileged: true
    image: rhel7:latest
    command:
    - sleep
    - inf
    name: example
    volumeMounts:
    - mountPath: /dev/hugepages
      name: hugepage
    resources:
      limits:
        hugepages-2Mi: 100Mi 1
        memory: "1Gi"
        cpu: "1"
  volumes:
  - name: hugepage
    emptyDir:
medium: HugePages- 1
- Specify the amount of memory for
hugepagesas the exact amount to be allocated. Do not specify this value as the amount of memory forhugepagesmultiplied by the size of the page. For example, given a huge page size of 2MB, if you want to use 100MB of huge-page-backed RAM for your application, then you would allocate 50 huge pages. OpenShift Container Platform handles the math for you. As in the above example, you can specify100MBdirectly.
Allocating huge pages of a specific size
Some platforms support multiple huge page sizes. To allocate huge pages of a specific size, precede the huge pages boot command parameters with a huge page size selection parameter hugepagesz=<size>. The <size> value must be specified in bytes with an optional scale suffix [kKmMgG]. The default huge page size can be defined with the default_hugepagesz=<size> boot parameter.
Huge page requirements
- Huge page requests must equal the limits. This is the default if limits are specified, but requests are not.
- Huge pages are isolated at a pod scope. Container isolation is planned in a future iteration.
-
EmptyDirvolumes backed by huge pages must not consume more huge page memory than the pod request. -
Applications that consume huge pages via
shmget()withSHM_HUGETLBmust run with a supplemental group that matches proc/sys/vm/hugetlb_shm_group.
Additional resources
13.3. Configuring huge pages
Nodes must pre-allocate huge pages used in an OpenShift Container Platform cluster. There are two ways of reserving huge pages: at boot time and at run time. Reserving at boot time increases the possibility of success because the memory has not yet been significantly fragmented. The Node Tuning Operator currently supports boot time allocation of huge pages on specific nodes.
13.3.1. At boot time
Procedure
To minimize node reboots, the order of the steps below needs to be followed:
Label all nodes that need the same huge pages setting by a label.
$ oc label node <node_using_hugepages> node-role.kubernetes.io/worker-hp=
Create a file with the following content and name it
hugepages-tuned-boottime.yaml:apiVersion: tuned.openshift.io/v1 kind: Tuned metadata: name: hugepages 1 namespace: openshift-cluster-node-tuning-operator spec: profile: 2 - data: | [main] summary=Boot time configuration for hugepages include=openshift-node [bootloader] cmdline_openshift_node_hugepages=hugepagesz=2M hugepages=50 3 name: openshift-node-hugepages recommend: - machineConfigLabels: 4 machineconfiguration.openshift.io/role: "worker-hp" priority: 30 profile: openshift-node-hugepages
Create the Tuned
hugepagesprofile$ oc create -f hugepages-tuned-boottime.yaml
Create a file with the following content and name it
hugepages-mcp.yaml:apiVersion: machineconfiguration.openshift.io/v1 kind: MachineConfigPool metadata: name: worker-hp labels: worker-hp: "" spec: machineConfigSelector: matchExpressions: - {key: machineconfiguration.openshift.io/role, operator: In, values: [worker,worker-hp]} nodeSelector: matchLabels: node-role.kubernetes.io/worker-hp: ""Create the machine config pool:
$ oc create -f hugepages-mcp.yaml
Given enough non-fragmented memory, all the nodes in the worker-hp machine config pool should now have 50 2Mi huge pages allocated.
$ oc get node <node_using_hugepages> -o jsonpath="{.status.allocatable.hugepages-2Mi}"
100Mi
This functionality is currently only supported on Red Hat Enterprise Linux CoreOS (RHCOS) 8.x worker nodes. On Red Hat Enterprise Linux (RHEL) 7.x worker nodes the Tuned [bootloader] plug-in is currently not supported.