
Monitoring
Configuring and using the monitoring stack in OpenShift Container Platform
Abstract
Chapter 1. Monitoring overview
1.1. About OpenShift Container Platform monitoring
OpenShift Container Platform includes a preconfigured, preinstalled, and self-updating monitoring stack that provides monitoring for core platform components. You also have the option to enable monitoring for user-defined projects.
A cluster administrator can configure the monitoring stack with the supported configurations. OpenShift Container Platform delivers monitoring best practices out of the box.
A set of alerts are included by default that immediately notify administrators about issues with a cluster. Default dashboards in the OpenShift Container Platform web console include visual representations of cluster metrics to help you to quickly understand the state of your cluster. With the OpenShift Container Platform web console, you can view and manage metrics, alerts, and review monitoring dashboards.
In the Observe section of OpenShift Container Platform web console, you can access and manage monitoring features such as metrics, alerts, monitoring dashboards, and metrics targets.
After installing OpenShift Container Platform, cluster administrators can optionally enable monitoring for user-defined projects. By using this feature, cluster administrators, developers, and other users can specify how services and pods are monitored in their own projects. As a cluster administrator, you can find answers to common problems such as user metrics unavailability and high consumption of disk space by Prometheus in Troubleshooting monitoring issues.
1.2. Understanding the monitoring stack
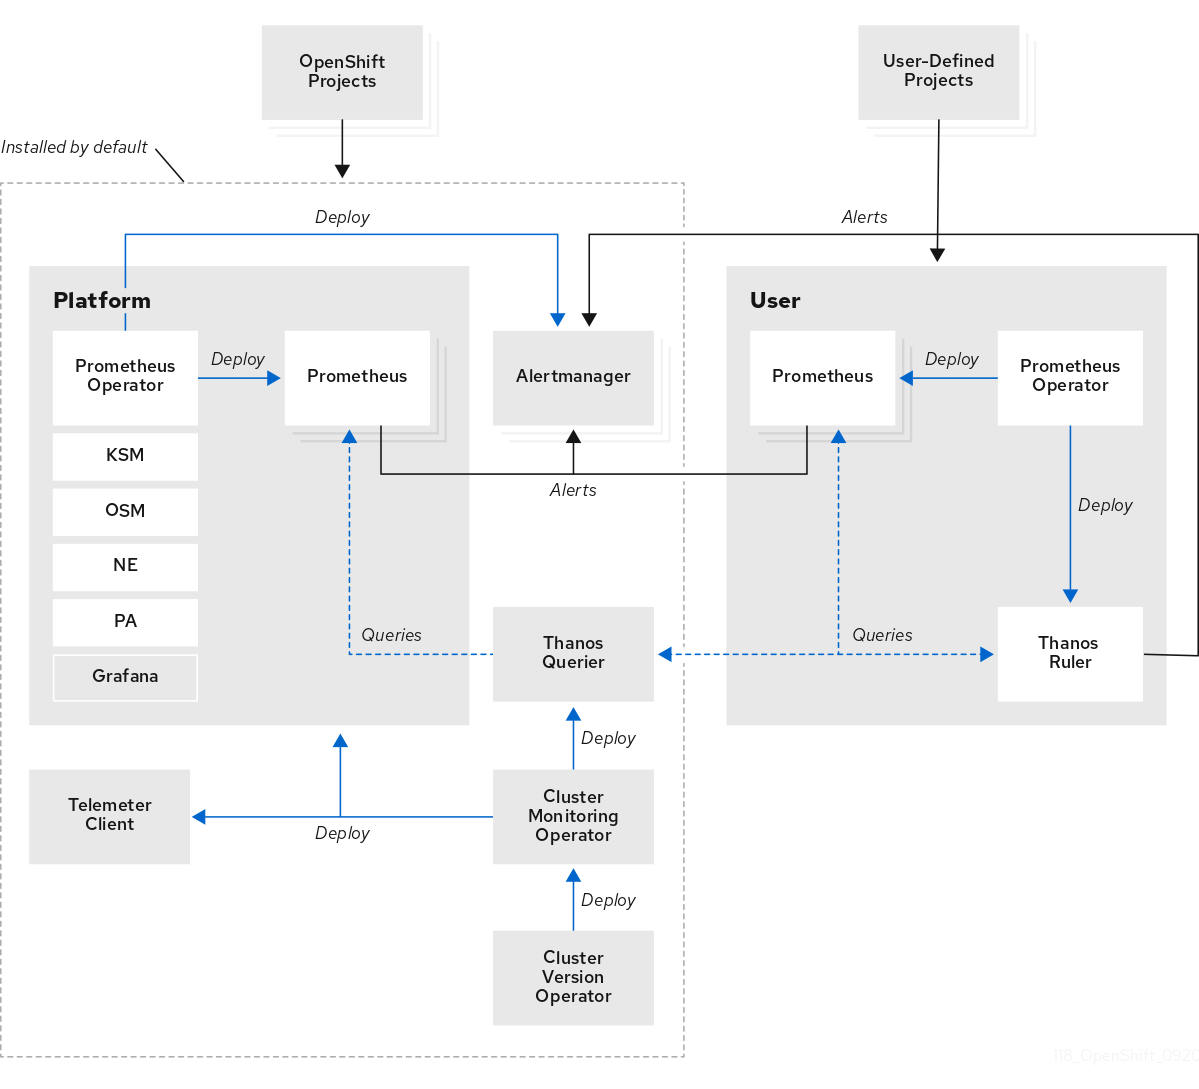
The OpenShift Container Platform monitoring stack is based on the Prometheus open source project and its wider ecosystem. The monitoring stack includes the following:
-
Default platform monitoring components. A set of platform monitoring components are installed in the
openshift-monitoringproject by default during an OpenShift Container Platform installation. This provides monitoring for core OpenShift Container Platform components including Kubernetes services. The default monitoring stack also enables remote health monitoring for clusters. These components are illustrated in the Installed by default section in the following diagram. -
Components for monitoring user-defined projects. After optionally enabling monitoring for user-defined projects, additional monitoring components are installed in the
openshift-user-workload-monitoringproject. This provides monitoring for user-defined projects. These components are illustrated in the User section in the following diagram.
1.2.1. Default monitoring components
By default, the OpenShift Container Platform 4.10 monitoring stack includes these components:
Table 1.1. Default monitoring stack components
| Component | Description |
|---|---|
| Cluster Monitoring Operator | The Cluster Monitoring Operator (CMO) is a central component of the monitoring stack. It deploys, manages, and automatically updates Prometheus and Alertmanager instances, Thanos Querier, Telemeter Client, and metrics targets. The CMO is deployed by the Cluster Version Operator (CVO). |
| Prometheus Operator |
The Prometheus Operator (PO) in the |
| Prometheus | Prometheus is the monitoring system on which the OpenShift Container Platform monitoring stack is based. Prometheus is a time-series database and a rule evaluation engine for metrics. Prometheus sends alerts to Alertmanager for processing. |
| Prometheus Adapter |
The Prometheus Adapter (PA in the preceding diagram) translates Kubernetes node and pod queries for use in Prometheus. The resource metrics that are translated include CPU and memory utilization metrics. The Prometheus Adapter exposes the cluster resource metrics API for horizontal pod autoscaling. The Prometheus Adapter is also used by the |
| Alertmanager | The Alertmanager service handles alerts received from Prometheus. Alertmanager is also responsible for sending the alerts to external notification systems. |
|
|
The |
|
|
The |
|
|
The |
| Thanos Querier | Thanos Querier aggregates and optionally deduplicates core OpenShift Container Platform metrics and metrics for user-defined projects under a single, multi-tenant interface. |
| Grafana | The Grafana analytics platform provides dashboards for analyzing and visualizing the metrics. The Grafana instance that is provided with the monitoring stack, along with its dashboards, is read-only. |
| Telemeter Client | Telemeter Client sends a subsection of the data from platform Prometheus instances to Red Hat to facilitate Remote Health Monitoring for clusters. |
All of the components in the monitoring stack are monitored by the stack and are automatically updated when OpenShift Container Platform is updated.
All components of the monitoring stack use the TLS security profile settings that are centrally configured by a cluster administrator. If you configure a monitoring stack component that uses TLS security settings, the component uses the TLS security profile settings that already exist in the tlsSecurityProfile field in the global OpenShift Container Platform apiservers.config.openshift.io/cluster resource.
1.2.2. Default monitoring targets
In addition to the components of the stack itself, the default monitoring stack monitors:
- CoreDNS
- Elasticsearch (if Logging is installed)
- etcd
- Fluentd (if Logging is installed)
- HAProxy
- Image registry
- Kubelets
- Kubernetes API server
- Kubernetes controller manager
- Kubernetes scheduler
- OpenShift API server
- OpenShift Controller Manager
- Operator Lifecycle Manager (OLM)
Each OpenShift Container Platform component is responsible for its monitoring configuration. For problems with the monitoring of an OpenShift Container Platform component, open a Jira issue against that component, not against the general monitoring component.
Other OpenShift Container Platform framework components might be exposing metrics as well. For details, see their respective documentation.
1.2.3. Components for monitoring user-defined projects
OpenShift Container Platform 4.10 includes an optional enhancement to the monitoring stack that enables you to monitor services and pods in user-defined projects. This feature includes the following components:
Table 1.2. Components for monitoring user-defined projects
| Component | Description |
|---|---|
| Prometheus Operator |
The Prometheus Operator (PO) in the |
| Prometheus | Prometheus is the monitoring system through which monitoring is provided for user-defined projects. Prometheus sends alerts to Alertmanager for processing. |
| Thanos Ruler | The Thanos Ruler is a rule evaluation engine for Prometheus that is deployed as a separate process. In OpenShift Container Platform 4.10, Thanos Ruler provides rule and alerting evaluation for the monitoring of user-defined projects. |
The components in the preceding table are deployed after monitoring is enabled for user-defined projects.
All of the components in the monitoring stack are monitored by the stack and are automatically updated when OpenShift Container Platform is updated.
1.2.4. Monitoring targets for user-defined projects
When monitoring is enabled for user-defined projects, you can monitor:
- Metrics provided through service endpoints in user-defined projects.
- Pods running in user-defined projects.
1.3. Glossary of common terms for OpenShift Container Platform monitoring
This glossary defines common terms that are used in OpenShift Container Platform architecture.
- Alertmanager
- Alertmanager handles alerts received from Prometheus. Alertmanager is also responsible for sending the alerts to external notification systems.
- Alerting rules
- Alerting rules contain a set of conditions that outline a particular state within a cluster. Alerts are triggered when those conditions are true. An alerting rule can be assigned a severity that defines how the alerts are routed.
- Cluster Monitoring Operator
- The Cluster Monitoring Operator (CMO) is a central component of the monitoring stack. It deploys and manages Prometheus instances such as, the Thanos Querier, the Telemeter Client, and metrics targets to ensure that they are up to date. The CMO is deployed by the Cluster Version Operator (CVO).
- Cluster Version Operator
- The Cluster Version Operator (CVO) manages the lifecycle of cluster Operators, many of which are installed in OpenShift Container Platform by default.
- config map
-
A config map provides a way to inject configuration data into pods. You can reference the data stored in a config map in a volume of type
ConfigMap. Applications running in a pod can use this data. - Container
- A container is a lightweight and executable image that includes software and all its dependencies. Containers virtualize the operating system. As a result, you can run containers anywhere from a data center to a public or private cloud as well as a developer’s laptop.
- custom resource (CR)
- A CR is an extension of the Kubernetes API. You can create custom resources.
- etcd
- etcd is the key-value store for OpenShift Container Platform, which stores the state of all resource objects.
- Fluentd
- Fluentd gathers logs from nodes and feeds them to Elasticsearch.
- Kubelets
- Runs on nodes and reads the container manifests. Ensures that the defined containers have started and are running.
- Kubernetes API server
- Kubernetes API server validates and configures data for the API objects.
- Kubernetes controller manager
- Kubernetes controller manager governs the state of the cluster.
- Kubernetes scheduler
- Kubernetes scheduler allocates pods to nodes.
- labels
- Labels are key-value pairs that you can use to organize and select subsets of objects such as a pod.
- node
- A worker machine in the OpenShift Container Platform cluster. A node is either a virtual machine (VM) or a physical machine.
- Operator
- The preferred method of packaging, deploying, and managing a Kubernetes application in an OpenShift Container Platform cluster. An Operator takes human operational knowledge and encodes it into software that is packaged and shared with customers.
- Operator Lifecycle Manager (OLM)
- OLM helps you install, update, and manage the lifecycle of Kubernetes native applications. OLM is an open source toolkit designed to manage Operators in an effective, automated, and scalable way.
- Persistent storage
- Stores the data even after the device is shut down. Kubernetes uses persistent volumes to store the application data.
- Persistent volume claim (PVC)
- You can use a PVC to mount a PersistentVolume into a Pod. You can access the storage without knowing the details of the cloud environment.
- pod
- The pod is the smallest logical unit in Kubernetes. A pod is comprised of one or more containers to run in a worker node.
- Prometheus
- Prometheus is the monitoring system on which the OpenShift Container Platform monitoring stack is based. Prometheus is a time-series database and a rule evaluation engine for metrics. Prometheus sends alerts to Alertmanager for processing.
- Prometheus adapter
- The Prometheus Adapter translates Kubernetes node and pod queries for use in Prometheus. The resource metrics that are translated include CPU and memory utilization. The Prometheus Adapter exposes the cluster resource metrics API for horizontal pod autoscaling.
- Prometheus Operator
-
The Prometheus Operator (PO) in the
openshift-monitoringproject creates, configures, and manages platform Prometheus and Alertmanager instances. It also automatically generates monitoring target configurations based on Kubernetes label queries. - Silences
- A silence can be applied to an alert to prevent notifications from being sent when the conditions for an alert are true. You can mute an alert after the initial notification, while you work on resolving the underlying issue.
- storage
- OpenShift Container Platform supports many types of storage, both for on-premise and cloud providers. You can manage container storage for persistent and non-persistent data in an OpenShift Container Platform cluster.
- Thanos Ruler
- The Thanos Ruler is a rule evaluation engine for Prometheus that is deployed as a separate process. In OpenShift Container Platform, Thanos Ruler provides rule and alerting evaluation for the monitoring of user-defined projects.
- web console
- A user interface (UI) to manage OpenShift Container Platform.
1.4. Additional resources
1.5. Next steps
Chapter 2. Configuring the monitoring stack
The OpenShift Container Platform 4 installation program provides only a low number of configuration options before installation. Configuring most OpenShift Container Platform framework components, including the cluster monitoring stack, happens post-installation.
This section explains what configuration is supported, shows how to configure the monitoring stack, and demonstrates several common configuration scenarios.
2.1. Prerequisites
- The monitoring stack imposes additional resource requirements. Consult the computing resources recommendations in Scaling the Cluster Monitoring Operator and verify that you have sufficient resources.
2.2. Maintenance and support for monitoring
The supported way of configuring OpenShift Container Platform Monitoring is by configuring it using the options described in this document. Do not use other configurations, as they are unsupported. Configuration paradigms might change across Prometheus releases, and such cases can only be handled gracefully if all configuration possibilities are controlled. If you use configurations other than those described in this section, your changes will disappear because the cluster-monitoring-operator reconciles any differences. The Operator resets everything to the defined state by default and by design.
2.2.1. Support considerations for monitoring
The following modifications are explicitly not supported:
-
Creating additional
ServiceMonitor,PodMonitor, andPrometheusRuleobjects in theopenshift-*andkube-*projects. Modifying any resources or objects deployed in the
openshift-monitoringoropenshift-user-workload-monitoringprojects. The resources created by the OpenShift Container Platform monitoring stack are not meant to be used by any other resources, as there are no guarantees about their backward compatibility.NoteThe Alertmanager configuration is deployed as a secret resource in the
openshift-monitoringproject. To configure additional routes for Alertmanager, you need to decode, modify, and then encode that secret. This procedure is a supported exception to the preceding statement.- Modifying resources of the stack. The OpenShift Container Platform monitoring stack ensures its resources are always in the state it expects them to be. If they are modified, the stack will reset them.
-
Deploying user-defined workloads to
openshift-*, andkube-*projects. These projects are reserved for Red Hat provided components and they should not be used for user-defined workloads. - Modifying the monitoring stack Grafana instance.
- Installing custom Prometheus instances on OpenShift Container Platform. A custom instance is a Prometheus custom resource (CR) managed by the Prometheus Operator.
-
Enabling symptom based monitoring by using the
Probecustom resource definition (CRD) in Prometheus Operator. -
Modifying Alertmanager configurations by using the
AlertmanagerConfigCRD in Prometheus Operator.
Backward compatibility for metrics, recording rules, or alerting rules is not guaranteed.
2.2.2. Support policy for monitoring Operators
Monitoring Operators ensure that OpenShift Container Platform monitoring resources function as designed and tested. If Cluster Version Operator (CVO) control of an Operator is overridden, the Operator does not respond to configuration changes, reconcile the intended state of cluster objects, or receive updates.
While overriding CVO control for an Operator can be helpful during debugging, this is unsupported and the cluster administrator assumes full control of the individual component configurations and upgrades.
Overriding the Cluster Version Operator
The spec.overrides parameter can be added to the configuration for the CVO to allow administrators to provide a list of overrides to the behavior of the CVO for a component. Setting the spec.overrides[].unmanaged parameter to true for a component blocks cluster upgrades and alerts the administrator after a CVO override has been set:
Disabling ownership via cluster version overrides prevents upgrades. Please remove overrides before continuing.
Setting a CVO override puts the entire cluster in an unsupported state and prevents the monitoring stack from being reconciled to its intended state. This impacts the reliability features built into Operators and prevents updates from being received. Reported issues must be reproduced after removing any overrides for support to proceed.
2.3. Preparing to configure the monitoring stack
You can configure the monitoring stack by creating and updating monitoring config maps.
2.3.1. Creating a cluster monitoring config map
To configure core OpenShift Container Platform monitoring components, you must create the cluster-monitoring-config ConfigMap object in the openshift-monitoring project.
When you save your changes to the cluster-monitoring-config ConfigMap object, some or all of the pods in the openshift-monitoring project might be redeployed. It can sometimes take a while for these components to redeploy.
Prerequisites
-
You have access to the cluster as a user with the
cluster-admincluster role. -
You have installed the OpenShift CLI (
oc).
Procedure
Check whether the
cluster-monitoring-configConfigMapobject exists:$ oc -n openshift-monitoring get configmap cluster-monitoring-config
If the
ConfigMapobject does not exist:Create the following YAML manifest. In this example the file is called
cluster-monitoring-config.yaml:apiVersion: v1 kind: ConfigMap metadata: name: cluster-monitoring-config namespace: openshift-monitoring data: config.yaml: |
Apply the configuration to create the
ConfigMapobject:$ oc apply -f cluster-monitoring-config.yaml
2.3.2. Creating a user-defined workload monitoring config map
To configure the components that monitor user-defined projects, you must create the user-workload-monitoring-config ConfigMap object in the openshift-user-workload-monitoring project.
When you save your changes to the user-workload-monitoring-config ConfigMap object, some or all of the pods in the openshift-user-workload-monitoring project might be redeployed. It can sometimes take a while for these components to redeploy. You can create and configure the config map before you first enable monitoring for user-defined projects, to prevent having to redeploy the pods often.
Prerequisites
-
You have access to the cluster as a user with the
cluster-admincluster role. -
You have installed the OpenShift CLI (
oc).
Procedure
Check whether the
user-workload-monitoring-configConfigMapobject exists:$ oc -n openshift-user-workload-monitoring get configmap user-workload-monitoring-config
If the
user-workload-monitoring-configConfigMapobject does not exist:Create the following YAML manifest. In this example the file is called
user-workload-monitoring-config.yaml:apiVersion: v1 kind: ConfigMap metadata: name: user-workload-monitoring-config namespace: openshift-user-workload-monitoring data: config.yaml: |
Apply the configuration to create the
ConfigMapobject:$ oc apply -f user-workload-monitoring-config.yaml
NoteConfigurations applied to the
user-workload-monitoring-configConfigMapobject are not activated unless a cluster administrator has enabled monitoring for user-defined projects.
Additional resources
2.4. Configuring the monitoring stack
In OpenShift Container Platform 4.10, you can configure the monitoring stack using the cluster-monitoring-config or user-workload-monitoring-config ConfigMap objects. Config maps configure the Cluster Monitoring Operator (CMO), which in turn configures the components of the stack.
Prerequisites
If you are configuring core OpenShift Container Platform monitoring components:
-
You have access to the cluster as a user with the
cluster-admincluster role. -
You have created the
cluster-monitoring-configConfigMapobject.
-
You have access to the cluster as a user with the
If you are configuring components that monitor user-defined projects:
-
You have access to the cluster as a user with the
cluster-admincluster role, or as a user with theuser-workload-monitoring-config-editrole in theopenshift-user-workload-monitoringproject. -
You have created the
user-workload-monitoring-configConfigMapobject.
-
You have access to the cluster as a user with the
-
You have installed the OpenShift CLI (
oc).
Procedure
Edit the
ConfigMapobject.To configure core OpenShift Container Platform monitoring components:
Edit the
cluster-monitoring-configConfigMapobject in theopenshift-monitoringproject:$ oc -n openshift-monitoring edit configmap cluster-monitoring-config
Add your configuration under
data/config.yamlas a key-value pair<component_name>: <component_configuration>:apiVersion: v1 kind: ConfigMap metadata: name: cluster-monitoring-config namespace: openshift-monitoring data: config.yaml: | <component>: <configuration_for_the_component>Substitute
<component>and<configuration_for_the_component>accordingly.The following example
ConfigMapobject configures a persistent volume claim (PVC) for Prometheus. This relates to the Prometheus instance that monitors core OpenShift Container Platform components only:apiVersion: v1 kind: ConfigMap metadata: name: cluster-monitoring-config namespace: openshift-monitoring data: config.yaml: | prometheusK8s: 1 volumeClaimTemplate: spec: storageClassName: fast volumeMode: Filesystem resources: requests: storage: 40Gi- 1
- Defines the Prometheus component and the subsequent lines define its configuration.
To configure components that monitor user-defined projects:
Edit the
user-workload-monitoring-configConfigMapobject in theopenshift-user-workload-monitoringproject:$ oc -n openshift-user-workload-monitoring edit configmap user-workload-monitoring-config
Add your configuration under
data/config.yamlas a key-value pair<component_name>: <component_configuration>:apiVersion: v1 kind: ConfigMap metadata: name: user-workload-monitoring-config namespace: openshift-user-workload-monitoring data: config.yaml: | <component>: <configuration_for_the_component>Substitute
<component>and<configuration_for_the_component>accordingly.The following example
ConfigMapobject configures a data retention period and minimum container resource requests for Prometheus. This relates to the Prometheus instance that monitors user-defined projects only:apiVersion: v1 kind: ConfigMap metadata: name: user-workload-monitoring-config namespace: openshift-user-workload-monitoring data: config.yaml: | prometheus: 1 retention: 24h 2 resources: requests: cpu: 200m 3 memory: 2Gi 4- 1
- Defines the Prometheus component and the subsequent lines define its configuration.
- 2
- Configures a twenty-four hour data retention period for the Prometheus instance that monitors user-defined projects.
- 3
- Defines a minimum resource request of 200 millicores for the Prometheus container.
- 4
- Defines a minimum pod resource request of 2 GiB of memory for the Prometheus container.
NoteThe Prometheus config map component is called
prometheusK8sin thecluster-monitoring-configConfigMapobject andprometheusin theuser-workload-monitoring-configConfigMapobject.
Save the file to apply the changes to the
ConfigMapobject. The pods affected by the new configuration are restarted automatically.NoteConfigurations applied to the
user-workload-monitoring-configConfigMapobject are not activated unless a cluster administrator has enabled monitoring for user-defined projects.WarningWhen changes are saved to a monitoring config map, the pods and other resources in the related project might be redeployed. The running monitoring processes in that project might also be restarted.
Additional resources
- See Preparing to configure the monitoring stack for steps to create monitoring config maps
- Enabling monitoring for user-defined projects
2.5. Configurable monitoring components
This table shows the monitoring components you can configure and the keys used to specify the components in the cluster-monitoring-config and user-workload-monitoring-config ConfigMap objects:
Table 2.1. Configurable monitoring components
| Component | cluster-monitoring-config config map key | user-workload-monitoring-config config map key |
|---|---|---|
| Prometheus Operator |
|
|
| Prometheus |
|
|
| Alertmanager |
| |
| kube-state-metrics |
| |
| openshift-state-metrics |
| |
| Grafana |
| |
| Telemeter Client |
| |
| Prometheus Adapter |
| |
| Thanos Querier |
| |
| Thanos Ruler |
|
The Prometheus key is called prometheusK8s in the cluster-monitoring-config ConfigMap object and prometheus in the user-workload-monitoring-config ConfigMap object.
2.6. Using node selectors to move monitoring components
By using the nodeSelector constraint with labeled nodes, you can move any of the monitoring stack components to specific nodes. By doing so, you can control the placement and distribution of the monitoring components across a cluster.
By controlling placement and distribution of monitoring components, you can optimize system resource use, improve performance, and segregate workloads based on specific requirements or policies.
2.6.1. How node selectors work with other constraints
If you move monitoring components by using node selector constraints, be aware that other constraints to control pod scheduling might exist for a cluster:
- Topology spread constraints might be in place to control pod placement.
- Hard anti-affinity rules are in place for Prometheus, Thanos Querier, Alertmanager, and other monitoring components to ensure that multiple pods for these components are always spread across different nodes and are therefore always highly available.
When scheduling pods onto nodes, the pod scheduler tries to satisfy all existing constraints when determining pod placement. That is, all constraints compound when the pod scheduler determines which pods will be placed on which nodes.
Therefore, if you configure a node selector constraint but existing constraints cannot all be satisfied, the pod scheduler cannot match all constraints and will not schedule a pod for placement onto a node.
To maintain resilience and high availability for monitoring components, ensure that enough nodes are available and match all constraints when you configure a node selector constraint to move a component.
Additional resources
2.6.2. Moving monitoring components to different nodes
To specify the nodes in your cluster on which monitoring stack components will run, configure the nodeSelector constraint in the component’s ConfigMap object to match labels assigned to the nodes.
You cannot add a node selector constraint directly to an existing scheduled pod.
Prerequisites
If you are configuring core OpenShift Container Platform monitoring components:
-
You have access to the cluster as a user with the
cluster-admincluster role. -
You have created the
cluster-monitoring-configConfigMapobject.
-
You have access to the cluster as a user with the
If you are configuring components that monitor user-defined projects:
-
You have access to the cluster as a user with the
cluster-admincluster role or as a user with theuser-workload-monitoring-config-editrole in theopenshift-user-workload-monitoringproject. -
You have created the
user-workload-monitoring-configConfigMapobject.
-
You have access to the cluster as a user with the
-
You have installed the OpenShift CLI (
oc).
Procedure
If you have not done so yet, add a label to the nodes on which you want to run the monitoring components:
$ oc label nodes <node-name> <node-label>
Edit the
ConfigMapobject:To move a component that monitors core OpenShift Container Platform projects:
Edit the
cluster-monitoring-configConfigMapobject in theopenshift-monitoringproject:$ oc -n openshift-monitoring edit configmap cluster-monitoring-config
Specify the node labels for the
nodeSelectorconstraint for the component underdata/config.yaml:apiVersion: v1 kind: ConfigMap metadata: name: cluster-monitoring-config namespace: openshift-monitoring data: config.yaml: | <component>: 1 nodeSelector: <node-label-1> 2 <node-label-2> 3 <...>- 1
- Substitute
<component>with the appropriate monitoring stack component name. - 2
- Substitute
<node-label-1>with the label you added to the node. - 3
- Optional: Specify additional labels. If you specify additional labels, the pods for the component are only scheduled on the nodes that contain all of the specified labels.
NoteIf monitoring components remain in a
Pendingstate after configuring thenodeSelectorconstraint, check the pod events for errors relating to taints and tolerations.
To move a component that monitors user-defined projects:
Edit the
user-workload-monitoring-configConfigMapobject in theopenshift-user-workload-monitoringproject:$ oc -n openshift-user-workload-monitoring edit configmap user-workload-monitoring-config
Specify the node labels for the
nodeSelectorconstraint for the component underdata/config.yaml:apiVersion: v1 kind: ConfigMap metadata: name: user-workload-monitoring-config namespace: openshift-user-workload-monitoring data: config.yaml: | <component>: 1 nodeSelector: <node-label-1> 2 <node-label-2> 3 <...>- 1
- Substitute
<component>with the appropriate monitoring stack component name. - 2
- Substitute
<node-label-1>with the label you added to the node. - 3
- Optional: Specify additional labels. If you specify additional labels, the pods for the component are only scheduled on the nodes that contain all of the specified labels.
NoteIf monitoring components remain in a
Pendingstate after configuring thenodeSelectorconstraint, check the pod events for errors relating to taints and tolerations.
Save the file to apply the changes. The components specified in the new configuration are moved to the new nodes automatically.
NoteConfigurations applied to the
user-workload-monitoring-configConfigMapobject are not activated unless a cluster administrator has enabled monitoring for user-defined projects.WarningWhen you save changes to a monitoring config map, the pods and other resources in the project might be redeployed. The running monitoring processes in that project might also restart.
Additional resources
- See Preparing to configure the monitoring stack for steps to create monitoring config maps
- Enabling monitoring for user-defined projects
2.7. Assigning tolerations to monitoring components
You can assign tolerations to any of the monitoring stack components to enable moving them to tainted nodes.
Prerequisites
If you are configuring core OpenShift Container Platform monitoring components:
-
You have access to the cluster as a user with the
cluster-admincluster role. -
You have created the
cluster-monitoring-configConfigMapobject.
-
You have access to the cluster as a user with the
If you are configuring components that monitor user-defined projects:
-
You have access to the cluster as a user with the
cluster-admincluster role, or as a user with theuser-workload-monitoring-config-editrole in theopenshift-user-workload-monitoringproject. -
You have created the
user-workload-monitoring-configConfigMapobject.
-
You have access to the cluster as a user with the
-
You have installed the OpenShift CLI (
oc).
Procedure
Edit the
ConfigMapobject:To assign tolerations to a component that monitors core OpenShift Container Platform projects:
Edit the
cluster-monitoring-configConfigMapobject in theopenshift-monitoringproject:$ oc -n openshift-monitoring edit configmap cluster-monitoring-config
Specify
tolerationsfor the component:apiVersion: v1 kind: ConfigMap metadata: name: cluster-monitoring-config namespace: openshift-monitoring data: config.yaml: | <component>: tolerations: <toleration_specification>Substitute
<component>and<toleration_specification>accordingly.For example,
oc adm taint nodes node1 key1=value1:NoScheduleadds a taint tonode1with the keykey1and the valuevalue1. This prevents monitoring components from deploying pods onnode1unless a toleration is configured for that taint. The following example configures thealertmanagerMaincomponent to tolerate the example taint:apiVersion: v1 kind: ConfigMap metadata: name: cluster-monitoring-config namespace: openshift-monitoring data: config.yaml: | alertmanagerMain: tolerations: - key: "key1" operator: "Equal" value: "value1" effect: "NoSchedule"
To assign tolerations to a component that monitors user-defined projects:
Edit the
user-workload-monitoring-configConfigMapobject in theopenshift-user-workload-monitoringproject:$ oc -n openshift-user-workload-monitoring edit configmap user-workload-monitoring-config
Specify
tolerationsfor the component:apiVersion: v1 kind: ConfigMap metadata: name: user-workload-monitoring-config namespace: openshift-user-workload-monitoring data: config.yaml: | <component>: tolerations: <toleration_specification>Substitute
<component>and<toleration_specification>accordingly.For example,
oc adm taint nodes node1 key1=value1:NoScheduleadds a taint tonode1with the keykey1and the valuevalue1. This prevents monitoring components from deploying pods onnode1unless a toleration is configured for that taint. The following example configures thethanosRulercomponent to tolerate the example taint:apiVersion: v1 kind: ConfigMap metadata: name: user-workload-monitoring-config namespace: openshift-user-workload-monitoring data: config.yaml: | thanosRuler: tolerations: - key: "key1" operator: "Equal" value: "value1" effect: "NoSchedule"
Save the file to apply the changes. The new component placement configuration is applied automatically.
NoteConfigurations applied to the
user-workload-monitoring-configConfigMapobject are not activated unless a cluster administrator has enabled monitoring for user-defined projects.WarningWhen changes are saved to a monitoring config map, the pods and other resources in the related project might be redeployed. The running monitoring processes in that project might also be restarted.
Additional resources
- See Preparing to configure the monitoring stack for steps to create monitoring config maps
- Enabling monitoring for user-defined projects
- See the OpenShift Container Platform documentation on taints and tolerations
- See the Kubernetes documentation on taints and tolerations
2.8. Configuring a dedicated service monitor
You can configure OpenShift Container Platform core platform monitoring to use dedicated service monitors to collect metrics for the resource metrics pipeline.
When enabled, a dedicated service monitor exposes two additional metrics from the kubelet endpoint and sets the value of the honorTimestamps field to true.
By enabling a dedicated service monitor, you can improve the consistency of Prometheus Adapter-based CPU usage measurements used by, for example, the oc adm top pod command or the Horizontal Pod Autoscaler.
2.8.1. Enabling a dedicated service monitor
You can configure core platform monitoring to use a dedicated service monitor by configuring the dedicatedServiceMonitors key in the cluster-monitoring-config ConfigMap object in the openshift-monitoring namespace.
Prerequisites
-
You have installed the OpenShift CLI (
oc). -
You have access to the cluster as a user with the
cluster-admincluster role. -
You have created the
cluster-monitoring-configConfigMapobject.
Procedure
Edit the
cluster-monitoring-configConfigMapobject in theopenshift-monitoringnamespace:$ oc -n openshift-monitoring edit configmap cluster-monitoring-config
Add an
enabled: truekey-value pair as shown in the following sample:apiVersion: v1 kind: ConfigMap metadata: name: cluster-monitoring-config namespace: openshift-monitoring data: config.yaml: | k8sPrometheusAdapter: dedicatedServiceMonitors: enabled: true 1- 1
- Set the value of the
enabledfield totrueto deploy a dedicated service monitor that exposes the kubelet/metrics/resourceendpoint.
Save the file to apply the changes automatically.
WarningWhen you save changes to a
cluster-monitoring-configconfig map, the pods and other resources in theopenshift-monitoringproject might be redeployed. The running monitoring processes in that project might also restart.
2.9. Configuring persistent storage
Running cluster monitoring with persistent storage means that your metrics are stored to a persistent volume (PV) and can survive a pod being restarted or recreated. This is ideal if you require your metrics or alerting data to be guarded from data loss. For production environments, it is highly recommended to configure persistent storage. Because of the high IO demands, it is advantageous to use local storage.
2.9.1. Persistent storage prerequisites
- Dedicate sufficient local persistent storage to ensure that the disk does not become full. How much storage you need depends on the number of pods. For information on system requirements for persistent storage, see Prometheus database storage requirements.
- Verify that you have a persistent volume (PV) ready to be claimed by the persistent volume claim (PVC), one PV for each replica. Because Prometheus and Alertmanager both have two replicas, you need four PVs to support the entire monitoring stack. The PVs are available from the Local Storage Operator, but not if you have enabled dynamically provisioned storage.
-
Use
Filesystemas the storage type value for thevolumeModeparameter when you configure the persistent volume. Configure local persistent storage.
NoteIf you use a local volume for persistent storage, do not use a raw block volume, which is described with
volumeMode: Blockin theLocalVolumeobject. Prometheus cannot use raw block volumes.ImportantPrometheus does not support file systems that are not POSIX compliant. For example, some NFS file system implementations are not POSIX compliant. If you want to use an NFS file system for storage, verify with the vendor that their NFS implementation is fully POSIX compliant.
2.9.2. Configuring a local persistent volume claim
For monitoring components to use a persistent volume (PV), you must configure a persistent volume claim (PVC).
Prerequisites
If you are configuring core OpenShift Container Platform monitoring components:
-
You have access to the cluster as a user with the
cluster-admincluster role. -
You have created the
cluster-monitoring-configConfigMapobject.
-
You have access to the cluster as a user with the
If you are configuring components that monitor user-defined projects:
-
You have access to the cluster as a user with the
cluster-admincluster role, or as a user with theuser-workload-monitoring-config-editrole in theopenshift-user-workload-monitoringproject. -
You have created the
user-workload-monitoring-configConfigMapobject.
-
You have access to the cluster as a user with the
-
You have installed the OpenShift CLI (
oc).
Procedure
Edit the
ConfigMapobject:To configure a PVC for a component that monitors core OpenShift Container Platform projects:
Edit the
cluster-monitoring-configConfigMapobject in theopenshift-monitoringproject:$ oc -n openshift-monitoring edit configmap cluster-monitoring-config
Add your PVC configuration for the component under
data/config.yaml:apiVersion: v1 kind: ConfigMap metadata: name: cluster-monitoring-config namespace: openshift-monitoring data: config.yaml: | <component>: volumeClaimTemplate: spec: storageClassName: <storage_class> resources: requests: storage: <amount_of_storage>See the Kubernetes documentation on PersistentVolumeClaims for information on how to specify
volumeClaimTemplate.The following example configures a PVC that claims local persistent storage for the Prometheus instance that monitors core OpenShift Container Platform components:
apiVersion: v1 kind: ConfigMap metadata: name: cluster-monitoring-config namespace: openshift-monitoring data: config.yaml: | prometheusK8s: volumeClaimTemplate: spec: storageClassName: local-storage resources: requests: storage: 40GiIn the above example, the storage class created by the Local Storage Operator is called
local-storage.The following example configures a PVC that claims local persistent storage for Alertmanager:
apiVersion: v1 kind: ConfigMap metadata: name: cluster-monitoring-config namespace: openshift-monitoring data: config.yaml: | alertmanagerMain: volumeClaimTemplate: spec: storageClassName: local-storage resources: requests: storage: 10Gi
To configure a PVC for a component that monitors user-defined projects:
Edit the
user-workload-monitoring-configConfigMapobject in theopenshift-user-workload-monitoringproject:$ oc -n openshift-user-workload-monitoring edit configmap user-workload-monitoring-config
Add your PVC configuration for the component under
data/config.yaml:apiVersion: v1 kind: ConfigMap metadata: name: user-workload-monitoring-config namespace: openshift-user-workload-monitoring data: config.yaml: | <component>: volumeClaimTemplate: spec: storageClassName: <storage_class> resources: requests: storage: <amount_of_storage>See the Kubernetes documentation on PersistentVolumeClaims for information on how to specify
volumeClaimTemplate.The following example configures a PVC that claims local persistent storage for the Prometheus instance that monitors user-defined projects:
apiVersion: v1 kind: ConfigMap metadata: name: user-workload-monitoring-config namespace: openshift-user-workload-monitoring data: config.yaml: | prometheus: volumeClaimTemplate: spec: storageClassName: local-storage resources: requests: storage: 40GiIn the above example, the storage class created by the Local Storage Operator is called
local-storage.The following example configures a PVC that claims local persistent storage for Thanos Ruler:
apiVersion: v1 kind: ConfigMap metadata: name: user-workload-monitoring-config namespace: openshift-user-workload-monitoring data: config.yaml: | thanosRuler: volumeClaimTemplate: spec: storageClassName: local-storage resources: requests: storage: 10GiNoteStorage requirements for the
thanosRulercomponent depend on the number of rules that are evaluated and how many samples each rule generates.
Save the file to apply the changes. The pods affected by the new configuration are restarted automatically and the new storage configuration is applied.
NoteConfigurations applied to the
user-workload-monitoring-configConfigMapobject are not activated unless a cluster administrator has enabled monitoring for user-defined projects.WarningWhen changes are saved to a monitoring config map, the pods and other resources in the related project might be redeployed. The running monitoring processes in that project might also be restarted.
2.9.3. Resizing a persistent storage volume
OpenShift Container Platform does not support resizing an existing persistent storage volume used by StatefulSet resources, even if the underlying StorageClass resource used supports persistent volume sizing. Therefore, even if you update the storage field for an existing persistent volume claim (PVC) with a larger size, this setting will not be propagated to the associated persistent volume (PV).
However, resizing a PV is still possible by using a manual process. If you want to resize a PV for a monitoring component such as Prometheus, Thanos Ruler, or Alertmanager, you can update the appropriate config map in which the component is configured. Then, patch the PVC, and delete and orphan the pods. Orphaning the pods recreates the StatefulSet resource immediately and automatically updates the size of the volumes mounted in the pods with the new PVC settings. No service disruption occurs during this process.
Prerequisites
-
You have installed the OpenShift CLI (
oc). If you are configuring core OpenShift Container Platform monitoring components:
-
You have access to the cluster as a user with the
cluster-admincluster role. -
You have created the
cluster-monitoring-configConfigMapobject. - You have configured at least one PVC for core OpenShift Container Platform monitoring components.
-
You have access to the cluster as a user with the
If you are configuring components that monitor user-defined projects:
-
You have access to the cluster as a user with the
cluster-admincluster role, or as a user with theuser-workload-monitoring-config-editrole in theopenshift-user-workload-monitoringproject. -
You have created the
user-workload-monitoring-configConfigMapobject. - You have configured at least one PVC for components that monitor user-defined projects.
-
You have access to the cluster as a user with the
Procedure
Edit the
ConfigMapobject:To resize a PVC for a component that monitors core OpenShift Container Platform projects:
Edit the
cluster-monitoring-configConfigMapobject in theopenshift-monitoringproject:$ oc -n openshift-monitoring edit configmap cluster-monitoring-config
Add a new storage size for the PVC configuration for the component under
data/config.yaml:apiVersion: v1 kind: ConfigMap metadata: name: cluster-monitoring-config namespace: openshift-monitoring data: config.yaml: | <component>: 1 volumeClaimTemplate: spec: storageClassName: <storage_class> 2 resources: requests: storage: <amount_of_storage> 3The following example configures a PVC that sets the local persistent storage to 100 gigabytes for the Prometheus instance that monitors core OpenShift Container Platform components:
apiVersion: v1
kind: ConfigMap
metadata:
  name: cluster-monitoring-config
  namespace: openshift-monitoring
data:
  config.yaml: |
    prometheusK8s:
      volumeClaimTemplate:
        spec:
          storageClassName: local-storage
          resources:
            requests:
              storage: 100Gi
The following example configures a PVC that sets the local persistent storage for Alertmanager to 40 gigabytes:
apiVersion: v1
kind: ConfigMap
metadata:
  name: cluster-monitoring-config
  namespace: openshift-monitoring
data:
  config.yaml: |
    alertmanagerMain:
      volumeClaimTemplate:
        spec:
          storageClassName: local-storage
          resources:
            requests:
              storage: 40Gi
To resize a PVC for a component that monitors user-defined projects:
NoteYou can resize the volumes for the Thanos Ruler and Prometheus instances that monitor user-defined projects.
Edit the
user-workload-monitoring-configConfigMapobject in theopenshift-user-workload-monitoringproject:$ oc -n openshift-user-workload-monitoring edit configmap user-workload-monitoring-config
Update the PVC configuration for the monitoring component under
data/config.yaml:apiVersion: v1 kind: ConfigMap metadata: name: user-workload-monitoring-config namespace: openshift-user-workload-monitoring data: config.yaml: | <component>: 1 volumeClaimTemplate: spec: storageClassName: <storage_class> 2 resources: requests: storage: <amount_of_storage> 3The following example configures the PVC size to 100 gigabytes for the Prometheus instance that monitors user-defined projects:
apiVersion: v1
kind: ConfigMap
metadata:
  name: user-workload-monitoring-config
  namespace: openshift-user-workload-monitoring
data:
  config.yaml: |
    prometheus:
      volumeClaimTemplate:
        spec:
          storageClassName: local-storage
          resources:
            requests:
              storage: 100Gi
The following example sets the PVC size to 20 gigabytes for Thanos Ruler:
apiVersion: v1 kind: ConfigMap metadata: name: user-workload-monitoring-config namespace: openshift-user-workload-monitoring data: config.yaml: | thanosRuler: volumeClaimTemplate: spec: storageClassName: local-storage resources: requests: storage: 20GiNoteStorage requirements for the
thanosRulercomponent depend on the number of rules that are evaluated and how many samples each rule generates.
Save the file to apply the changes. The pods affected by the new configuration restart automatically.
WarningWhen you save changes to a monitoring config map, the pods and other resources in the related project might be redeployed. The monitoring processes running in that project might also be restarted.
Manually patch every PVC with the updated storage request. The following example resizes the storage size for the Prometheus component in the
openshift-monitoringnamespace to 100Gi:$ for p in $(oc -n openshift-monitoring get pvc -l app.kubernetes.io/name=prometheus -o jsonpath='{range .items[*]}{.metadata.name} {end}'); do \ oc -n openshift-monitoring patch pvc/${p} --patch '{"spec": {"resources": {"requests": {"storage":"100Gi"}}}}'; \ doneDelete the underlying StatefulSet with the
--cascade=orphanparameter:$ oc delete statefulset -l app.kubernetes.io/name=prometheus --cascade=orphan
2.9.4. Modifying the retention time for Prometheus metrics data
By default, the OpenShift Container Platform monitoring stack configures the retention time for Prometheus data to be 15 days. You can modify the retention time to change how soon the data is deleted.
Prerequisites
If you are configuring core OpenShift Container Platform monitoring components:
-
You have access to the cluster as a user with the
cluster-adminrole. -
You have created the
cluster-monitoring-configConfigMapobject.
-
You have access to the cluster as a user with the
If you are configuring components that monitor user-defined projects:
-
You have access to the cluster as a user with the
cluster-adminrole, or as a user with theuser-workload-monitoring-config-editrole in theopenshift-user-workload-monitoringproject. -
You have created the
user-workload-monitoring-configConfigMapobject.
-
You have access to the cluster as a user with the
-
You have installed the OpenShift CLI (
oc).
Procedure
Edit the
ConfigMapobject:To modify the retention time for the Prometheus instance that monitors core OpenShift Container Platform projects:
Edit the
cluster-monitoring-configConfigMapobject in theopenshift-monitoringproject:$ oc -n openshift-monitoring edit configmap cluster-monitoring-config
Add your retention time configuration under
data/config.yaml:apiVersion: v1 kind: ConfigMap metadata: name: cluster-monitoring-config namespace: openshift-monitoring data: config.yaml: | prometheusK8s: retention: <time_specification>Substitute
<time_specification>with a number directly followed byms(milliseconds),s(seconds),m(minutes),h(hours),d(days),w(weeks), ory(years).The following example sets the retention time to 24 hours for the Prometheus instance that monitors core OpenShift Container Platform components:
apiVersion: v1
kind: ConfigMap
metadata:
  name: cluster-monitoring-config
  namespace: openshift-monitoring
data:
  config.yaml: |
    prometheusK8s:
      retention: 24h
To modify the retention time for the Prometheus instance that monitors user-defined projects:
Edit the
user-workload-monitoring-configConfigMapobject in theopenshift-user-workload-monitoringproject:$ oc -n openshift-user-workload-monitoring edit configmap user-workload-monitoring-config
Add your retention time configuration under
data/config.yaml:apiVersion: v1 kind: ConfigMap metadata: name: user-workload-monitoring-config namespace: openshift-user-workload-monitoring data: config.yaml: | prometheus: retention: <time_specification>Substitute
<time_specification>with a number directly followed byms(milliseconds),s(seconds),m(minutes),h(hours),d(days),w(weeks), ory(years).The following example sets the retention time to 24 hours for the Prometheus instance that monitors user-defined projects:
apiVersion: v1
kind: ConfigMap
metadata:
  name: user-workload-monitoring-config
  namespace: openshift-user-workload-monitoring
data:
  config.yaml: |
    prometheus:
      retention: 24h
Save the file to apply the changes. The pods affected by the new configuration are restarted automatically.
NoteConfigurations applied to the
user-workload-monitoring-configConfigMapobject are not activated unless a cluster administrator has enabled monitoring for user-defined projects.WarningWhen changes are saved to a monitoring config map, the pods and other resources in the related project might be redeployed. The running monitoring processes in that project might also be restarted.
2.9.5. Modifying the retention time for Thanos Ruler metrics data
By default, for user-defined projects, Thanos Ruler automatically retains metrics data for 24 hours. You can modify the retention time to change how long this data is retained by specifying a time value in the user-workload-monitoring-config config map in the openshift-user-workload-monitoring namespace.
Prerequisites
-
You have installed the OpenShift CLI (
oc). - A cluster administrator has enabled monitoring for user-defined projects.
-
You have access to the cluster as a user with the
cluster-admincluster role or as a user with theuser-workload-monitoring-config-editrole in theopenshift-user-workload-monitoringproject. -
You have created the
user-workload-monitoring-configConfigMapobject.
Saving changes to a monitoring config map might restart monitoring processes and redeploy the pods and other resources in the related project. The running monitoring processes in that project might also restart.
Procedure
Edit the
user-workload-monitoring-configConfigMapobject in theopenshift-user-workload-monitoringproject:$ oc -n openshift-user-workload-monitoring edit configmap user-workload-monitoring-config
Add the retention time configuration under
data/config.yaml:apiVersion: v1 kind: ConfigMap metadata: name: user-workload-monitoring-config namespace: openshift-user-workload-monitoring data: config.yaml: | thanosRuler: retention: <time_specification> 1- 1
- Specify the retention time in the following format: a number directly followed by
ms(milliseconds),s(seconds),m(minutes),h(hours),d(days),w(weeks), ory(years). You can also combine time values for specific times, such as1h30m15s. The default is24h.
The following example sets the retention time to 10 days for Thanos Ruler data:
apiVersion: v1 kind: ConfigMap metadata: name: user-workload-monitoring-config namespace: openshift-user-workload-monitoring data: config.yaml: | thanosRuler: retention: 10d- Save the file to apply the changes. The pods affected by the new configuration automatically restart.
Additional resources
- See Preparing to configure the monitoring stack for steps to create monitoring config maps.
- Enabling monitoring for user-defined projects
- Understanding persistent storage
- Optimizing storage
2.10. Configuring remote write storage
You can configure remote write storage to enable Prometheus to send ingested metrics to remote systems for long-term storage. Doing so has no impact on how or for how long Prometheus stores metrics.
Prerequisites
If you are configuring core OpenShift Container Platform monitoring components:
-
You have access to the cluster as a user with the
cluster-admincluster role. -
You have created the
cluster-monitoring-configConfigMapobject.
-
You have access to the cluster as a user with the
If you are configuring components that monitor user-defined projects:
-
You have access to the cluster as a user with the
cluster-admincluster role or as a user with theuser-workload-monitoring-config-editrole in theopenshift-user-workload-monitoringproject. -
You have created the
user-workload-monitoring-configConfigMapobject.
-
You have access to the cluster as a user with the
-
You have installed the OpenShift CLI (
oc). - You have set up a remote write compatible endpoint (such as Thanos) and know the endpoint URL. See the Prometheus remote endpoints and storage documentation for information about endpoints that are compatible with the remote write feature.
You have set up authentication credentials for the remote write endpoint.
CautionTo reduce security risks, avoid sending metrics to an endpoint via unencrypted HTTP or without using authentication.
Procedure
Edit the
cluster-monitoring-configConfigMapobject in theopenshift-monitoringproject:$ oc -n openshift-monitoring edit configmap cluster-monitoring-config
-
Add a
remoteWrite:section underdata/config.yaml/prometheusK8s. Add an endpoint URL and authentication credentials in this section:
apiVersion: v1
kind: ConfigMap
metadata:
  name: cluster-monitoring-config
  namespace: openshift-monitoring
data:
  config.yaml: |
    prometheusK8s:
      remoteWrite:
      - url: "https://remote-write.endpoint"
        <endpoint_authentication_credentials>
For
endpoint_authentication_credentialssubstitute the credentials for the endpoint. Currently supported authentication methods are basic authentication (basicAuth) and client TLS (tlsConfig) authentication.The following example configures basic authentication:
basicAuth:
  username:
    <usernameSecret>
  password:
    <passwordSecret>
Substitute
<usernameSecret>and<passwordSecret>accordingly.The following sample shows basic authentication configured with
remoteWriteAuthfor thenamevalues anduserandpasswordfor thekeyvalues. These values contain the endpoint authentication credentials:apiVersion: v1 kind: ConfigMap metadata: name: cluster-monitoring-config namespace: openshift-monitoring data: config.yaml: | prometheusK8s: remoteWrite: - url: "https://remote-write.endpoint" basicAuth: username: name: remoteWriteAuth key: user password: name: remoteWriteAuth key: passwordThe following example configures client TLS authentication:
tlsConfig:
  ca:
    <caSecret>
  cert:
    <certSecret>
  keySecret:
    <keySecret>
Substitute
<caSecret>,<certSecret>, and<keySecret>accordingly.The following sample shows a TLS authentication configuration using
selfsigned-mtls-bundlefor thenamevalues andca.crtfor thecakeyvalue,client.crtfor thecertkeyvalue, andclient.keyfor thekeySecretkeyvalue:apiVersion: v1 kind: ConfigMap metadata: name: cluster-monitoring-config namespace: openshift-monitoring data: config.yaml: | prometheusK8s: remoteWrite: - url: "https://remote-write.endpoint" tlsConfig: ca: secret: name: selfsigned-mtls-bundle key: ca.crt cert: secret: name: selfsigned-mtls-bundle key: client.crt keySecret: name: selfsigned-mtls-bundle key: client.key
Add write relabel configuration values after the authentication credentials:
apiVersion: v1
kind: ConfigMap
metadata:
  name: cluster-monitoring-config
  namespace: openshift-monitoring
data:
  config.yaml: |
    prometheusK8s:
      remoteWrite:
      - url: "https://remote-write.endpoint"
        <endpoint_authentication_credentials>
        <write_relabel_configs>
For
<write_relabel_configs>substitute a list of write relabel configurations for metrics that you want to send to the remote endpoint.The following sample shows how to forward a single metric called
my_metric:apiVersion: v1 kind: ConfigMap metadata: name: cluster-monitoring-config namespace: openshift-monitoring data: config.yaml: | prometheusK8s: remoteWrite: - url: "https://remote-write.endpoint" writeRelabelConfigs: - sourceLabels: [__name__] regex: 'my_metric' action: keepSee the Prometheus relabel_config documentation for information about write relabel configuration options.
If required, configure remote write for the Prometheus instance that monitors user-defined projects by changing the
nameandnamespacemetadatavalues as follows:apiVersion: v1 kind: ConfigMap metadata: name: user-workload-monitoring-config namespace: openshift-user-workload-monitoring data: config.yaml: | prometheus: remoteWrite: - url: "https://remote-write.endpoint" <endpoint_authentication_credentials> <write_relabel_configs>NoteThe Prometheus config map component is called
prometheusK8sin thecluster-monitoring-configConfigMapobject andprometheusin theuser-workload-monitoring-configConfigMapobject.Save the file to apply the changes to the
ConfigMapobject. The pods affected by the new configuration restart automatically.NoteConfigurations applied to the
user-workload-monitoring-configConfigMapobject are not activated unless a cluster administrator has enabled monitoring for user-defined projects.WarningSaving changes to a monitoring
ConfigMapobject might redeploy the pods and other resources in the related project. Saving changes might also restart the running monitoring processes in that project.
Additional resources
- See Setting up remote write compatible endpoints for steps to create a remote write compatible endpoint (such as Thanos).
- See Tuning remote write settings for information about how to optimize remote write settings for different use cases.
- For information about additional optional fields, please refer to the API documentation.
2.11. Controlling the impact of unbound metrics attributes in user-defined projects
Developers can create labels to define attributes for metrics in the form of key-value pairs. The number of potential key-value pairs corresponds to the number of possible values for an attribute. An attribute that has an unlimited number of potential values is called an unbound attribute. For example, a customer_id attribute is unbound because it has an infinite number of possible values.
Every assigned key-value pair has a unique time series. The use of many unbound attributes in labels can result in an exponential increase in the number of time series created. This can impact Prometheus performance and can consume a lot of disk space.
Cluster administrators can use the following measures to control the impact of unbound metrics attributes in user-defined projects:
- Limit the number of samples that can be accepted per target scrape in user-defined projects
- Create alerts that fire when a scrape sample threshold is reached or when the target cannot be scraped
Limiting scrape samples can help prevent the issues caused by adding many unbound attributes to labels. Developers can also prevent the underlying cause by limiting the number of unbound attributes that they define for metrics. Using attributes that are bound to a limited set of possible values reduces the number of potential key-value pair combinations.
2.11.1. Setting a scrape sample limit for user-defined projects
You can limit the number of samples that can be accepted per target scrape in user-defined projects.
If you set a sample limit, no further sample data is ingested for that target scrape after the limit is reached.
Prerequisites
-
You have access to the cluster as a user with the
cluster-adminrole, or as a user with theuser-workload-monitoring-config-editrole in theopenshift-user-workload-monitoringproject. -
You have created the
user-workload-monitoring-configConfigMapobject. -
You have installed the OpenShift CLI (
oc).
Procedure
Edit the
user-workload-monitoring-configConfigMapobject in theopenshift-user-workload-monitoringproject:$ oc -n openshift-user-workload-monitoring edit configmap user-workload-monitoring-config
Add the
enforcedSampleLimitconfiguration todata/config.yamlto limit the number of samples that can be accepted per target scrape in user-defined projects:apiVersion: v1 kind: ConfigMap metadata: name: user-workload-monitoring-config namespace: openshift-user-workload-monitoring data: config.yaml: | prometheus: enforcedSampleLimit: 50000 1- 1
- A value is required if this parameter is specified. This
enforcedSampleLimitexample limits the number of samples that can be accepted per target scrape in user-defined projects to 50,000.
Save the file to apply the changes. The limit is applied automatically.
NoteConfigurations applied to the
user-workload-monitoring-configConfigMapobject are not activated unless a cluster administrator has enabled monitoring for user-defined projects.WarningWhen changes are saved to the
user-workload-monitoring-configConfigMapobject, the pods and other resources in theopenshift-user-workload-monitoringproject might be redeployed. The running monitoring processes in that project might also be restarted.
2.11.2. Creating scrape sample alerts
You can create alerts that notify you when:
-
The target cannot be scraped or is not available for the specified
forduration -
A scrape sample threshold is reached or is exceeded for the specified
forduration
Prerequisites
-
You have access to the cluster as a user with the
cluster-admincluster role, or as a user with theuser-workload-monitoring-config-editrole in theopenshift-user-workload-monitoringproject. - You have enabled monitoring for user-defined projects.
-
You have created the
user-workload-monitoring-configConfigMapobject. -
You have limited the number of samples that can be accepted per target scrape in user-defined projects, by using
enforcedSampleLimit. -
You have installed the OpenShift CLI (
oc).
Procedure
Create a YAML file with alerts that inform you when the targets are down and when the enforced sample limit is approaching. The file in this example is called
monitoring-stack-alerts.yaml:apiVersion: monitoring.coreos.com/v1 kind: PrometheusRule metadata: labels: prometheus: k8s role: alert-rules name: monitoring-stack-alerts 1 namespace: ns1 2 spec: groups: - name: general.rules rules: - alert: TargetDown 3 annotations: message: '{{ printf "%.4g" $value }}% of the {{ $labels.job }}/{{ $labels.service }} targets in {{ $labels.namespace }} namespace are down.' 4 expr: 100 * (count(up == 0) BY (job, namespace, service) / count(up) BY (job, namespace, service)) > 10 for: 10m 5 labels: severity: warning 6 - alert: ApproachingEnforcedSamplesLimit 7 annotations: message: '{{ $labels.container }} container of the {{ $labels.pod }} pod in the {{ $labels.namespace }} namespace consumes {{ $value | humanizePercentage }} of the samples limit budget.' 8 expr: scrape_samples_scraped/50000 > 0.8 9 for: 10m 10 labels: severity: warning 11- 1
- Defines the name of the alerting rule.
- 2
- Specifies the user-defined project where the alerting rule will be deployed.
- 3
- The
TargetDownalert will fire if the target cannot be scraped or is not available for theforduration. - 4
- The message that will be output when the
TargetDownalert fires. - 5
- The conditions for the
TargetDownalert must be true for this duration before the alert is fired. - 6
- Defines the severity for the
TargetDownalert. - 7
- The
ApproachingEnforcedSamplesLimitalert will fire when the defined scrape sample threshold is reached or exceeded for the specifiedforduration. - 8
- The message that will be output when the
ApproachingEnforcedSamplesLimitalert fires. - 9
- The threshold for the
ApproachingEnforcedSamplesLimitalert. In this example the alert will fire when the number of samples per target scrape has exceeded 80% of the enforced sample limit of50000. Theforduration must also have passed before the alert will fire. The<number>in the expressionscrape_samples_scraped/<number> > <threshold>must match theenforcedSampleLimitvalue defined in theuser-workload-monitoring-configConfigMapobject. - 10
- The conditions for the
ApproachingEnforcedSamplesLimitalert must be true for this duration before the alert is fired. - 11
- Defines the severity for the
ApproachingEnforcedSamplesLimitalert.
Apply the configuration to the user-defined project:
$ oc apply -f monitoring-stack-alerts.yaml
Additional resources
- Creating a user-defined workload monitoring config map
- Enabling monitoring for user-defined projects
- See Determining why Prometheus is consuming a lot of disk space for steps to query which metrics have the highest number of scrape samples.
Chapter 3. Configuring external alertmanager instances
The OpenShift Container Platform monitoring stack includes a local Alertmanager instance that routes alerts from Prometheus. You can add external Alertmanager instances by configuring the cluster-monitoring-config config map in either the openshift-monitoring project or the user-workload-monitoring-config project.
If you add the same external Alertmanager configuration for multiple clusters and disable the local instance for each cluster, you can then manage alert routing for multiple clusters by using a single external Alertmanager instance.
Prerequisites
-
You have installed the OpenShift CLI (
oc). If you are configuring core OpenShift Container Platform monitoring components in the
openshift-monitoringproject:-
You have access to the cluster as a user with the
cluster-admincluster role. -
You have created the
cluster-monitoring-configconfig map.
-
You have access to the cluster as a user with the
If you are configuring components that monitor user-defined projects:
-
You have access to the cluster as a user with the
cluster-admincluster role, or as a user with theuser-workload-monitoring-config-editrole in theopenshift-user-workload-monitoringproject. -
You have created the
user-workload-monitoring-configconfig map.
-
You have access to the cluster as a user with the
Procedure
Edit the
ConfigMapobject.To configure additional Alertmanagers for routing alerts from core OpenShift Container Platform projects:
Edit the
cluster-monitoring-configconfig map in theopenshift-monitoringproject:$ oc -n openshift-monitoring edit configmap cluster-monitoring-config
-
Add an
additionalAlertmanagerConfigs:section underdata/config.yaml/prometheusK8s. Add the configuration details for additional Alertmanagers in this section:
apiVersion: v1
kind: ConfigMap
metadata:
  name: cluster-monitoring-config
  namespace: openshift-monitoring
data:
  config.yaml: |
    prometheusK8s:
      additionalAlertmanagerConfigs:
      - <alertmanager_specification>
For
<alertmanager_specification>, substitute authentication and other configuration details for additional Alertmanager instances. Currently supported authentication methods are bearer token (bearerToken) and client TLS (tlsConfig). The following sample config map configures an additional Alertmanager using a bearer token with client TLS authentication:apiVersion: v1 kind: ConfigMap metadata: name: cluster-monitoring-config namespace: openshift-monitoring data: config.yaml: | prometheusK8s: additionalAlertmanagerConfigs: - scheme: https pathPrefix: / timeout: "30s" apiVersion: v1 bearerToken: name: alertmanager-bearer-token key: token tlsConfig: key: name: alertmanager-tls key: tls.key cert: name: alertmanager-tls key: tls.crt ca: name: alertmanager-tls key: tls.ca staticConfigs: - external-alertmanager1-remote.com - external-alertmanager1-remote2.com
To configure additional Alertmanager instances for routing alerts from user-defined projects:
Edit the
user-workload-monitoring-configconfig map in theopenshift-user-workload-monitoringproject:$ oc -n openshift-user-workload-monitoring edit configmap user-workload-monitoring-config
-
Add a
<component>/additionalAlertmanagerConfigs:section underdata/config.yaml/. Add the configuration details for additional Alertmanagers in this section:
apiVersion: v1
kind: ConfigMap
metadata:
  name: user-workload-monitoring-config
  namespace: openshift-user-workload-monitoring
data:
  config.yaml: |
    <component>:
      additionalAlertmanagerConfigs:
      - <alertmanager_specification>
For
<component>, substitute one of two supported external Alertmanager components:prometheusorthanosRuler.For
<alertmanager_specification>, substitute authentication and other configuration details for additional Alertmanager instances. Currently supported authentication methods are bearer token (bearerToken) and client TLS (tlsConfig). The following sample config map configures an additional Alertmanager using Thanos Ruler with a bearer token and client TLS authentication:apiVersion: v1 kind: ConfigMap metadata: name: user-workload-monitoring-config namespace: openshift-user-workload-monitoring data: config.yaml: | thanosRuler: additionalAlertmanagerConfigs: - scheme: https pathPrefix: / timeout: "30s" apiVersion: v1 bearerToken: name: alertmanager-bearer-token key: token tlsConfig: key: name: alertmanager-tls key: tls.key cert: name: alertmanager-tls key: tls.crt ca: name: alertmanager-tls key: tls.ca staticConfigs: - external-alertmanager1-remote.com - external-alertmanager1-remote2.comNoteConfigurations applied to the
user-workload-monitoring-configConfigMapobject are not activated unless a cluster administrator has enabled monitoring for user-defined projects.
-
Save the file to apply the changes to the
ConfigMapobject. The new component placement configuration is applied automatically.
3.1. Attaching additional labels to your time series and alerts
Using the external labels feature of Prometheus, you can attach custom labels to all time series and alerts leaving Prometheus.
Prerequisites
If you are configuring core OpenShift Container Platform monitoring components:
-
You have access to the cluster as a user with the
cluster-admincluster role. -
You have created the
cluster-monitoring-configConfigMapobject.
-
You have access to the cluster as a user with the
If you are configuring components that monitor user-defined projects:
-
You have access to the cluster as a user with the
cluster-admincluster role, or as a user with theuser-workload-monitoring-config-editrole in theopenshift-user-workload-monitoringproject. -
You have created the
user-workload-monitoring-configConfigMapobject.
-
You have access to the cluster as a user with the
-
You have installed the OpenShift CLI (
oc).
Procedure
Edit the
ConfigMapobject:To attach custom labels to all time series and alerts leaving the Prometheus instance that monitors core OpenShift Container Platform projects:
Edit the
cluster-monitoring-configConfigMapobject in theopenshift-monitoringproject:$ oc -n openshift-monitoring edit configmap cluster-monitoring-config
Define a map of labels you want to add for every metric under
data/config.yaml:apiVersion: v1 kind: ConfigMap metadata: name: cluster-monitoring-config namespace: openshift-monitoring data: config.yaml: | prometheusK8s: externalLabels: <key>: <value> 1- 1
- Substitute
<key>: <value>with a map of key-value pairs where<key>is a unique name for the new label and<value>is its value.
WarningDo not use
prometheusorprometheus_replicaas key names, because they are reserved and will be overwritten.For example, to add metadata about the region and environment to all time series and alerts, use:
apiVersion: v1
kind: ConfigMap
metadata:
  name: cluster-monitoring-config
  namespace: openshift-monitoring
data:
  config.yaml: |
    prometheusK8s:
      externalLabels:
        region: eu
        environment: prod
To attach custom labels to all time series and alerts leaving the Prometheus instance that monitors user-defined projects:
Edit the
user-workload-monitoring-configConfigMapobject in theopenshift-user-workload-monitoringproject:$ oc -n openshift-user-workload-monitoring edit configmap user-workload-monitoring-config
Define a map of labels you want to add for every metric under
data/config.yaml:apiVersion: v1 kind: ConfigMap metadata: name: user-workload-monitoring-config namespace: openshift-user-workload-monitoring data: config.yaml: | prometheus: externalLabels: <key>: <value> 1- 1
- Substitute
<key>: <value>with a map of key-value pairs where<key>is a unique name for the new label and<value>is its value.
WarningDo not use
prometheusorprometheus_replicaas key names, because they are reserved and will be overwritten.NoteIn the
openshift-user-workload-monitoringproject, Prometheus handles metrics and Thanos Ruler handles alerting and recording rules. SettingexternalLabelsforprometheusin theuser-workload-monitoring-configConfigMapobject will only configure external labels for metrics and not for any rules.For example, to add metadata about the region and environment to all time series and alerts related to user-defined projects, use:
apiVersion: v1
kind: ConfigMap
metadata:
  name: user-workload-monitoring-config
  namespace: openshift-user-workload-monitoring
data:
  config.yaml: |
    prometheus:
      externalLabels:
        region: eu
        environment: prod
Save the file to apply the changes. The new configuration is applied automatically.
NoteConfigurations applied to the
user-workload-monitoring-configConfigMapobject are not activated unless a cluster administrator has enabled monitoring for user-defined projects.WarningWhen changes are saved to a monitoring config map, the pods and other resources in the related project might be redeployed. The running monitoring processes in that project might also be restarted.
Additional resources
- See Preparing to configure the monitoring stack for steps to create monitoring config maps.
- Enabling monitoring for user-defined projects
3.2. Setting log levels for monitoring components
You can configure the log level for Alertmanager, Prometheus Operator, Prometheus, Thanos Querier, and Thanos Ruler.
The following log levels can be applied to the relevant component in the cluster-monitoring-config and user-workload-monitoring-config ConfigMap objects:
-
debug. Log debug, informational, warning, and error messages. -
info. Log informational, warning, and error messages. -
warn. Log warning and error messages only. -
error. Log error messages only.
The default log level is info.
Prerequisites
If you are setting a log level for Alertmanager, Prometheus Operator, Prometheus, or Thanos Querier in the
openshift-monitoringproject:-
You have access to the cluster as a user with the
cluster-admincluster role. -
You have created the
cluster-monitoring-configConfigMapobject.
-
You have access to the cluster as a user with the
If you are setting a log level for Prometheus Operator, Prometheus, or Thanos Ruler in the
openshift-user-workload-monitoringproject:-
You have access to the cluster as a user with the
cluster-admincluster role, or as a user with theuser-workload-monitoring-config-editrole in theopenshift-user-workload-monitoringproject. -
You have created the
user-workload-monitoring-configConfigMapobject.
-
You have access to the cluster as a user with the
-
You have installed the OpenShift CLI (
oc).
Procedure
Edit the
ConfigMapobject:To set a log level for a component in the
openshift-monitoringproject:Edit the
cluster-monitoring-configConfigMapobject in theopenshift-monitoringproject:$ oc -n openshift-monitoring edit configmap cluster-monitoring-config
Add
logLevel: <log_level>for a component underdata/config.yaml:apiVersion: v1 kind: ConfigMap metadata: name: cluster-monitoring-config namespace: openshift-monitoring data: config.yaml: | <component>: 1 logLevel: <log_level> 2- 1
- The monitoring stack component for which you are setting a log level. For default platform monitoring, available component values are
prometheusK8s,alertmanagerMain,prometheusOperator, andthanosQuerier. - 2
- The log level to set for the component. The available values are
error,warn,info, anddebug. The default value isinfo.
To set a log level for a component in the
openshift-user-workload-monitoringproject:Edit the
user-workload-monitoring-configConfigMapobject in theopenshift-user-workload-monitoringproject:$ oc -n openshift-user-workload-monitoring edit configmap user-workload-monitoring-config
Add
logLevel: <log_level>for a component underdata/config.yaml:apiVersion: v1 kind: ConfigMap metadata: name: user-workload-monitoring-config namespace: openshift-user-workload-monitoring data: config.yaml: | <component>: 1 logLevel: <log_level> 2- 1
- The monitoring stack component for which you are setting a log level. For user workload monitoring, available component values are
prometheus,prometheusOperator, andthanosRuler. - 2
- The log level to set for the component. The available values are
error,warn,info, anddebug. The default value isinfo.
Save the file to apply the changes. The pods for the component restarts automatically when you apply the log-level change.
NoteConfigurations applied to the
user-workload-monitoring-configConfigMapobject are not activated unless a cluster administrator has enabled monitoring for user-defined projects.WarningWhen changes are saved to a monitoring config map, the pods and other resources in the related project might be redeployed. The running monitoring processes in that project might also be restarted.
Confirm that the log-level has been applied by reviewing the deployment or pod configuration in the related project. The following example checks the log level in the
prometheus-operatordeployment in theopenshift-user-workload-monitoringproject:$ oc -n openshift-user-workload-monitoring get deploy prometheus-operator -o yaml | grep "log-level"
Example output
- --log-level=debug
Check that the pods for the component are running. The following example lists the status of pods in the
openshift-user-workload-monitoringproject:$ oc -n openshift-user-workload-monitoring get pods
NoteIf an unrecognized
loglevelvalue is included in theConfigMapobject, the pods for the component might not restart successfully.
3.3. Enabling the query log file for Prometheus
You can configure Prometheus to write all queries that have been run by the engine to a log file. You can do so for default platform monitoring and for user-defined workload monitoring.
Because log rotation is not supported, only enable this feature temporarily when you need to troubleshoot an issue. After you finish troubleshooting, disable query logging by reverting the changes you made to the ConfigMap object to enable the feature.
Prerequisites
-
You have installed the OpenShift CLI (
oc). If you are enabling the query log file feature for Prometheus in the
openshift-monitoringproject:-
You have access to the cluster as a user with the
cluster-admincluster role. -
You have created the
cluster-monitoring-configConfigMapobject.
-
You have access to the cluster as a user with the
If you are enabling the query log file feature for Prometheus in the
openshift-user-workload-monitoringproject:-
You have access to the cluster as a user with the
cluster-admincluster role, or as a user with theuser-workload-monitoring-config-editrole in theopenshift-user-workload-monitoringproject. -
You have created the
user-workload-monitoring-configConfigMapobject.
-
You have access to the cluster as a user with the
Procedure
To set the query log file for Prometheus in the
openshift-monitoringproject:Edit the
cluster-monitoring-configConfigMapobject in theopenshift-monitoringproject:$ oc -n openshift-monitoring edit configmap cluster-monitoring-config
Add
queryLogFile: <path>forprometheusK8sunderdata/config.yaml:apiVersion: v1 kind: ConfigMap metadata: name: cluster-monitoring-config namespace: openshift-monitoring data: config.yaml: | prometheusK8s: queryLogFile: <path> 1- 1
- The full path to the file in which queries will be logged.
Save the file to apply the changes.
WarningWhen you save changes to a monitoring config map, pods and other resources in the related project might be redeployed. The running monitoring processes in that project might also be restarted.
Verify that the pods for the component are running. The following sample command lists the status of pods in the
openshift-monitoringproject:$ oc -n openshift-monitoring get pods
Read the query log:
$ oc -n openshift-monitoring exec prometheus-k8s-0 -- cat <path>
ImportantRevert the setting in the config map after you have examined the logged query information.
To set the query log file for Prometheus in the
openshift-user-workload-monitoringproject:Edit the
user-workload-monitoring-configConfigMapobject in theopenshift-user-workload-monitoringproject:$ oc -n openshift-user-workload-monitoring edit configmap user-workload-monitoring-config
Add
queryLogFile: <path>forprometheusunderdata/config.yaml:apiVersion: v1 kind: ConfigMap metadata: name: user-workload-monitoring-config namespace: openshift-user-workload-monitoring data: config.yaml: | prometheus: queryLogFile: <path> 1- 1
- The full path to the file in which queries will be logged.
Save the file to apply the changes.
NoteConfigurations applied to the
user-workload-monitoring-configConfigMapobject are not activated unless a cluster administrator has enabled monitoring for user-defined projects.WarningWhen you save changes to a monitoring config map, pods and other resources in the related project might be redeployed. The running monitoring processes in that project might also be restarted.
Verify that the pods for the component are running. The following example command lists the status of pods in the
openshift-user-workload-monitoringproject:$ oc -n openshift-user-workload-monitoring get pods
Read the query log:
$ oc -n openshift-user-workload-monitoring exec prometheus-user-workload-0 -- cat <path>
ImportantRevert the setting in the config map after you have examined the logged query information.
Additional resources
- See Preparing to configure the monitoring stack for steps to create monitoring config maps
- See Enabling monitoring for user-defined projects for steps to enable user-defined monitoring.
3.4. Enabling query logging for Thanos Querier
For default platform monitoring in the openshift-monitoring project, you can enable the Cluster Monitoring Operator to log all queries run by Thanos Querier.
Because log rotation is not supported, only enable this feature temporarily when you need to troubleshoot an issue. After you finish troubleshooting, disable query logging by reverting the changes you made to the ConfigMap object to enable the feature.
Prerequisites
-
You have installed the OpenShift CLI (
oc). -
You have access to the cluster as a user with the
cluster-admincluster role. -
You have created the
cluster-monitoring-configConfigMapobject.
Procedure
You can enable query logging for Thanos Querier in the openshift-monitoring project:
Edit the
cluster-monitoring-configConfigMapobject in theopenshift-monitoringproject:$ oc -n openshift-monitoring edit configmap cluster-monitoring-config
Add a
thanosQueriersection underdata/config.yamland add values as shown in the following example:apiVersion: v1 kind: ConfigMap metadata: name: cluster-monitoring-config namespace: openshift-monitoring data: config.yaml: | thanosQuerier: enableRequestLogging: <value> 1 logLevel: <value> 2Save the file to apply the changes.
WarningWhen you save changes to a monitoring config map, pods and other resources in the related project might be redeployed. The running monitoring processes in that project might also be restarted.
Verification
Verify that the Thanos Querier pods are running. The following sample command lists the status of pods in the
openshift-monitoringproject:$ oc -n openshift-monitoring get pods
Run a test query using the following sample commands as a model:
$ token=`oc sa get-token prometheus-k8s -n openshift-monitoring`
$ oc -n openshift-monitoring exec -c prometheus prometheus-k8s-0 -- curl -k -H "Authorization: Bearer $token" 'https://thanos-querier.openshift-monitoring.svc:9091/api/v1/query?query=cluster_version'
Run the following command to read the query log:
$ oc -n openshift-monitoring logs <thanos_querier_pod_name> -c thanos-query
NoteBecause the
thanos-querierpods are highly available (HA) pods, you might be able to see logs in only one pod.-
After you examine the logged query information, disable query logging by changing the
enableRequestLoggingvalue tofalsein the config map.
Additional resources
- See Preparing to configure the monitoring stack for steps to create monitoring config maps.
Chapter 4. Setting audit log levels for the Prometheus Adapter
In default platform monitoring, you can configure the audit log level for the Prometheus Adapter.
Prerequisites
-
You have installed the OpenShift CLI (
oc). -
You have access to the cluster as a user with the
cluster-admincluster role. -
You have created the
cluster-monitoring-configConfigMapobject.
Procedure
You can set an audit log level for the Prometheus Adapter in the default openshift-monitoring project:
Edit the
cluster-monitoring-configConfigMapobject in theopenshift-monitoringproject:$ oc -n openshift-monitoring edit configmap cluster-monitoring-config
Add
profile:in thek8sPrometheusAdapter/auditsection underdata/config.yaml:apiVersion: v1 kind: ConfigMap metadata: name: cluster-monitoring-config namespace: openshift-monitoring data: config.yaml: | k8sPrometheusAdapter: audit: profile: <audit_log_level> 1- 1
- The audit log level to apply to the Prometheus Adapter.
Set the audit log level by using one of the following values for the
profile:parameter:-
None: Do not log events. -
Metadata: Log only the metadata for the request, such as user, timestamp, and so forth. Do not log the request text and the response text.Metadatais the default audit log level. -
Request: Log only the metadata and the request text but not the response text. This option does not apply for non-resource requests. -
RequestResponse: Log event metadata, request text, and response text. This option does not apply for non-resource requests.
-
Save the file to apply the changes. The pods for the Prometheus Adapter restart automatically when you apply the change.
WarningWhen changes are saved to a monitoring config map, the pods and other resources in the related project might be redeployed. The running monitoring processes in that project might also be restarted.
Verification
-
In the config map, under
k8sPrometheusAdapter/audit/profile, set the log level toRequestand save the file. Confirm that the pods for the Prometheus Adapter are running. The following example lists the status of pods in the
openshift-monitoringproject:$ oc -n openshift-monitoring get pods
Confirm that the audit log level and audit log file path are correctly configured:
$ oc -n openshift-monitoring get deploy prometheus-adapter -o yaml
Example output
...
  - --audit-policy-file=/etc/audit/request-profile.yaml
  - --audit-log-path=/var/log/adapter/audit.log
Confirm that the correct log level has been applied in the
prometheus-adapterdeployment in theopenshift-monitoringproject:$ oc -n openshift-monitoring exec deploy/prometheus-adapter -c prometheus-adapter -- cat /etc/audit/request-profile.yaml
Example output
"apiVersion": "audit.k8s.io/v1"
"kind": "Policy"
"metadata":
  "name": "Request"
"omitStages":
- "RequestReceived"
"rules":
- "level": "Request"
NoteIf you enter an unrecognized
profilevalue for the Prometheus Adapter in theConfigMapobject, no changes are made to the Prometheus Adapter, and an error is logged by the Cluster Monitoring Operator.Review the audit log for the Prometheus Adapter:
$ oc -n openshift-monitoring exec -c <prometheus_adapter_pod_name> -- cat /var/log/adapter/audit.log
Additional resources
- See Preparing to configure the monitoring stack for steps to create monitoring config maps.
4.1. Disabling the default Grafana deployment
By default, a read-only Grafana instance is deployed with a collection of dashboards displaying cluster metrics. The Grafana instance is not user-configurable.
You can disable the Grafana deployment, causing the associated resources to be deleted from the cluster. You might do this if you do not need these dashboards and want to conserve resources in your cluster. You will still be able to view metrics and dashboards included in the web console. Grafana can be safely enabled again at any time.
Prerequisites
-
You have access to the cluster as a user with the
cluster-adminrole. -
You have created the
cluster-monitoring-configConfigMapobject. -
You have installed the OpenShift CLI (
oc).
Procedure
Edit the
cluster-monitoring-configConfigMapobject in theopenshift-monitoringproject:$ oc -n openshift-monitoring edit configmap cluster-monitoring-config
Add
enabled: falsefor thegrafanacomponent underdata/config.yaml:apiVersion: v1 kind: ConfigMap metadata: name: cluster-monitoring-config namespace: openshift-monitoring data: config.yaml: | grafana: enabled: falseSave the file to apply the changes. The resources will begin to be removed automatically when you apply the change.
WarningThis change results in some components, including Prometheus and the Thanos Querier, being restarted. This might lead to previously collected metrics being lost if you have not yet followed the steps in the "Configuring persistent storage" section.
Check that the Grafana pod is no longer running. The following example lists the status of pods in the
openshift-monitoringproject:$ oc -n openshift-monitoring get pods
NoteIt may take a few minutes after applying the change for these pods to terminate.
Additional resources
- See Preparing to configure the monitoring stack for steps to create monitoring config maps.
4.2. Disabling the local Alertmanager
A local Alertmanager that routes alerts from Prometheus instances is enabled by default in the openshift-monitoring project of the OpenShift Container Platform monitoring stack.
If you do not need the local Alertmanager, you can disable it by configuring the cluster-monitoring-config config map in the openshift-monitoring project.
Prerequisites
-
You have access to the cluster as a user with the
cluster-admincluster role. -
You have created the
cluster-monitoring-configconfig map. -
You have installed the OpenShift CLI (
oc).
Procedure
Edit the
cluster-monitoring-configconfig map in theopenshift-monitoringproject:$ oc -n openshift-monitoring edit configmap cluster-monitoring-config
Add
enabled: falsefor thealertmanagerMaincomponent underdata/config.yaml:apiVersion: v1 kind: ConfigMap metadata: name: cluster-monitoring-config namespace: openshift-monitoring data: config.yaml: | alertmanagerMain: enabled: false- Save the file to apply the changes. The Alertmanager instance is disabled automatically when you apply the change.
Additional resources
4.3. Next steps
- Enabling monitoring for user-defined projects
- Learn about remote health reporting and, if necessary, opt out of it.
Chapter 5. Enabling monitoring for user-defined projects
In OpenShift Container Platform 4.10, you can enable monitoring for user-defined projects in addition to the default platform monitoring. You can monitor your own projects in OpenShift Container Platform without the need for an additional monitoring solution. Using this feature centralizes monitoring for core platform components and user-defined projects.
Versions of Prometheus Operator installed using Operator Lifecycle Manager (OLM) are not compatible with user-defined monitoring. Therefore, custom Prometheus instances installed as a Prometheus custom resource (CR) managed by the OLM Prometheus Operator are not supported in OpenShift Container Platform.
5.1. Enabling monitoring for user-defined projects
Cluster administrators can enable monitoring for user-defined projects by setting the enableUserWorkload: true field in the cluster monitoring ConfigMap object.
In OpenShift Container Platform 4.10 you must remove any custom Prometheus instances before enabling monitoring for user-defined projects.
You must have access to the cluster as a user with the cluster-admin cluster role to enable monitoring for user-defined projects in OpenShift Container Platform. Cluster administrators can then optionally grant users permission to configure the components that are responsible for monitoring user-defined projects.
Prerequisites
-
You have access to the cluster as a user with the
cluster-admincluster role. -
You have installed the OpenShift CLI (
oc). -
You have created the
cluster-monitoring-configConfigMapobject. You have optionally created and configured the
user-workload-monitoring-configConfigMapobject in theopenshift-user-workload-monitoringproject. You can add configuration options to thisConfigMapobject for the components that monitor user-defined projects.NoteEvery time you save configuration changes to the
user-workload-monitoring-configConfigMapobject, the pods in theopenshift-user-workload-monitoringproject are redeployed. It can sometimes take a while for these components to redeploy. You can create and configure theConfigMapobject before you first enable monitoring for user-defined projects, to prevent having to redeploy the pods often.
Procedure
Edit the
cluster-monitoring-configConfigMapobject:$ oc -n openshift-monitoring edit configmap cluster-monitoring-config
Add
enableUserWorkload: trueunderdata/config.yaml:apiVersion: v1 kind: ConfigMap metadata: name: cluster-monitoring-config namespace: openshift-monitoring data: config.yaml: | enableUserWorkload: true 1- 1
- When set to
true, theenableUserWorkloadparameter enables monitoring for user-defined projects in a cluster.
Save the file to apply the changes. Monitoring for user-defined projects is then enabled automatically.
WarningWhen changes are saved to the
cluster-monitoring-configConfigMapobject, the pods and other resources in theopenshift-monitoringproject might be redeployed. The running monitoring processes in that project might also be restarted.Check that the
prometheus-operator,prometheus-user-workloadandthanos-ruler-user-workloadpods are running in theopenshift-user-workload-monitoringproject. It might take a short while for the pods to start:$ oc -n openshift-user-workload-monitoring get pod
Example output
NAME                                   READY   STATUS        RESTARTS   AGE
prometheus-operator-6f7b748d5b-t7nbg   2/2     Running       0          3h
prometheus-user-workload-0             4/4     Running       1          3h
prometheus-user-workload-1             4/4     Running       1          3h
thanos-ruler-user-workload-0           3/3     Running       0          3h
thanos-ruler-user-workload-1           3/3     Running       0          3h
5.2. Granting users permission to monitor user-defined projects
Cluster administrators can monitor all core OpenShift Container Platform and user-defined projects.
Cluster administrators can grant developers and other users permission to monitor their own projects. Privileges are granted by assigning one of the following monitoring roles:
-
The monitoring-rules-view cluster role provides read access to
PrometheusRulecustom resources for a project. -
The monitoring-rules-edit cluster role grants a user permission to create, modify, and deleting
PrometheusRulecustom resources for a project. -
The monitoring-edit cluster role grants the same privileges as the
monitoring-rules-editcluster role. Additionally, it enables a user to create new scrape targets for services or pods. With this role, you can also create, modify, and deleteServiceMonitorandPodMonitorresources.
You can also grant users permission to configure the components that are responsible for monitoring user-defined projects:
-
The user-workload-monitoring-config-edit role in the
openshift-user-workload-monitoringproject enables you to edit theuser-workload-monitoring-configConfigMapobject. With this role, you can edit theConfigMapobject to configure Prometheus, Prometheus Operator, and Thanos Ruler for user-defined workload monitoring.
You can also grant users permission to configure alert routing for user-defined projects:
-
The alert-routing-edit cluster role grants a user permission to create, update, and delete
AlertmanagerConfigcustom resources for a project.
This section provides details on how to assign these roles by using the OpenShift Container Platform web console or the CLI.
5.2.1. Granting user permissions by using the web console
You can grant users permissions to monitor their own projects, by using the OpenShift Container Platform web console.
Prerequisites
-
You have access to the cluster as a user with the
cluster-admincluster role. - The user account that you are assigning the role to already exists.
Procedure
- In the Administrator perspective within the OpenShift Container Platform web console, navigate to User Management → Role Bindings → Create Binding.
- In the Binding Type section, select the "Namespace Role Binding" type.
- In the Name field, enter a name for the role binding.
In the Namespace field, select the user-defined project where you want to grant the access.
ImportantThe monitoring role will be bound to the project that you apply in the Namespace field. The permissions that you grant to a user by using this procedure will apply only to the selected project.
-
Select
monitoring-rules-view,monitoring-rules-edit, ormonitoring-editin the Role Name list. - In the Subject section, select User.
- In the Subject Name field, enter the name of the user.
- Select Create to apply the role binding.
5.2.2. Granting user permissions by using the CLI
You can grant users permissions to monitor their own projects, by using the OpenShift CLI (oc).
Prerequisites
-
You have access to the cluster as a user with the
cluster-admincluster role. - The user account that you are assigning the role to already exists.
-
You have installed the OpenShift CLI (
oc).
Procedure
Assign a monitoring role to a user for a project:
$ oc policy add-role-to-user <role> <user> -n <namespace> 1- 1
- Substitute
<role>withmonitoring-rules-view,monitoring-rules-edit, ormonitoring-edit.
ImportantWhichever role you choose, you must bind it against a specific project as a cluster administrator.
As an example, substitute
<role>withmonitoring-edit,<user>withjohnsmith, and<namespace>withns1. This assigns the userjohnsmithpermission to set up metrics collection and to create alerting rules in thens1namespace.
5.3. Granting users permission to configure monitoring for user-defined projects
You can grant users permission to configure monitoring for user-defined projects.
Prerequisites
-
You have access to the cluster as a user with the
cluster-admincluster role. - The user account that you are assigning the role to already exists.
-
You have installed the OpenShift CLI (
oc).
Procedure
Assign the
user-workload-monitoring-config-editrole to a user in theopenshift-user-workload-monitoringproject:$ oc -n openshift-user-workload-monitoring adm policy add-role-to-user \ user-workload-monitoring-config-edit <user> \ --role-namespace openshift-user-workload-monitoring
5.4. Accessing metrics from outside the cluster for custom applications
Learn how to query Prometheus statistics from the command line when monitoring your own services. You can access monitoring data from outside the cluster with the thanos-querier route.
Prerequisites
- You deployed your own service, following the Enabling monitoring for user-defined projects procedure.
Procedure
Extract a token to connect to Prometheus:
$ SECRET=`oc get secret -n openshift-user-workload-monitoring | grep prometheus-user-workload-token | head -n 1 | awk '{print $1 }'`$ TOKEN=`echo $(oc get secret $SECRET -n openshift-user-workload-monitoring -o json | jq -r '.data.token') | base64 -d`
Extract your route host:
$ THANOS_QUERIER_HOST=`oc get route thanos-querier -n openshift-monitoring -o json | jq -r '.spec.host'`
Query the metrics of your own services in the command line. For example:
$ NAMESPACE=ns1
$ curl -X GET -kG "https://$THANOS_QUERIER_HOST/api/v1/query?" --data-urlencode "query=up{namespace='$NAMESPACE'}" -H "Authorization: Bearer $TOKEN"The output will show you the duration that your application pods have been up.
Example output
{"status":"success","data":{"resultType":"vector","result":[{"metric":{"__name__":"up","endpoint":"web","instance":"10.129.0.46:8080","job":"prometheus-example-app","namespace":"ns1","pod":"prometheus-example-app-68d47c4fb6-jztp2","service":"prometheus-example-app"},"value":[1591881154.748,"1"]}]}}
5.5. Excluding a user-defined project from monitoring
Individual user-defined projects can be excluded from user workload monitoring. To do so, simply add the openshift.io/user-monitoring label to the project’s namespace with a value of false.
Procedure
Add the label to the project namespace:
$ oc label namespace my-project 'openshift.io/user-monitoring=false'
To re-enable monitoring, remove the label from the namespace:
$ oc label namespace my-project 'openshift.io/user-monitoring-'
NoteIf there were any active monitoring targets for the project, it may take a few minutes for Prometheus to stop scraping them after adding the label.
5.6. Disabling monitoring for user-defined projects
After enabling monitoring for user-defined projects, you can disable it again by setting enableUserWorkload: false in the cluster monitoring ConfigMap object.
Alternatively, you can remove enableUserWorkload: true to disable monitoring for user-defined projects.
Procedure
Edit the
cluster-monitoring-configConfigMapobject:$ oc -n openshift-monitoring edit configmap cluster-monitoring-config
Set
enableUserWorkload:tofalseunderdata/config.yaml:apiVersion: v1 kind: ConfigMap metadata: name: cluster-monitoring-config namespace: openshift-monitoring data: config.yaml: | enableUserWorkload: false
- Save the file to apply the changes. Monitoring for user-defined projects is then disabled automatically.
Check that the
prometheus-operator,prometheus-user-workloadandthanos-ruler-user-workloadpods are terminated in theopenshift-user-workload-monitoringproject. This might take a short while:$ oc -n openshift-user-workload-monitoring get pod
Example output
No resources found in openshift-user-workload-monitoring project.
The user-workload-monitoring-config ConfigMap object in the openshift-user-workload-monitoring project is not automatically deleted when monitoring for user-defined projects is disabled. This is to preserve any custom configurations that you may have created in the ConfigMap object.
5.7. Next steps
Chapter 6. Enabling alert routing for user-defined projects
Alert routing for user-defined projects is a Technology Preview feature only. Technology Preview features are not supported with Red Hat production service level agreements (SLAs) and might not be functionally complete. Red Hat does not recommend using them in production. These features provide early access to upcoming product features, enabling customers to test functionality and provide feedback during the development process.
For more information about the support scope of Red Hat Technology Preview features, see Technology Preview Features Support Scope.
In OpenShift Container Platform 4.10, a cluster administrator can enable alert routing for user-defined projects.
6.1. Understanding alert routing for user-defined projects
As a cluster administrator, you can enable alert routing for user-defined projects. After doing so, you can allow users to configure alert routing for their user-defined projects. Users can then create and configure user-defined alert routing by creating or editing the AlertmanagerConfig objects.
After a user has defined alert routing for a user-defined project, user-defined alerts are routed to the alertmanager-main pods in the openshift-monitoring namespace.
Note the following limitations and features of alert routing for user-defined projects:
-
For user-defined alerting rules, user-defined routing is scoped to the namespace in which the resource is defined. For example, a routing configuration in namespace
ns1only applies toPrometheusRulesresources in the same namespace. - The Cluster Monitoring Operator (CMO) does not deploy a second Alertmanager service dedicated to user-defined alerts. Cluster administrators continue to define the main Alertmanager configuration by using a custom secret or the OpenShift Container Platform web console.
-
When a namespace is excluded from user-defined monitoring,
AlertmanagerConfigresources in the namespace cease to be part of the Alertmanager configuration.
6.2. Enabling alert routing for user-defined projects
You can enable alert routing for user-defined projects. By doing so, you enable users with the alert-routing-edit role to configure alert routing and receivers for user-defined projects in Alertmanager.
Prerequisites
- You have enabled monitoring for user-defined projects.
-
You have access to the cluster as a user with the
cluster-adminrole. -
You have installed the OpenShift CLI (
oc).
Procedure
Edit the
cluster-monitoring-configConfigMapobject:$ oc -n openshift-monitoring edit configmap cluster-monitoring-config
Add
enableUserAlertmanagerConfig: trueunder thealertmanagerMainkey indata/config.yaml:apiVersion: v1 kind: ConfigMap metadata: name: cluster-monitoring-config namespace: openshift-monitoring data: config.yaml: | enableUserWorkload: true alertmanagerMain: enableUserAlertmanagerConfig: true 1- 1
- When set to
true, theenableUserAlertmanagerConfigparameter enables alert routing for user-defined projects in a cluster.
- Save the file to apply the changes. Alert routing for user-defined projects is enabled automatically.
6.3. Granting users permission to configure alert routing for user-defined projects
You can grant users permission to configure alert routing for user-defined projects.
Prerequisites
-
You have access to the cluster as a user with the
cluster-admincluster role. - The user account that you are assigning the role to already exists.
-
You have installed the OpenShift CLI (
oc). - You have enabled monitoring for user-defined projects.
Procedure
Assign the
alert-routing-editcluster role to a user in the user-defined project:$ oc -n <namespace> adm policy add-role-to-user alert-routing-edit <user> 1- 1
- For
<namespace>, substitute the namespace for the user-defined project, such asns1. For<user>, substitute the username for the account to which you want to assign the role.
6.4. Disabling alert routing for user-defined projects
If you have enabled alert routing for user-defined projects, you can disable it. By doing so, you prevent users with the alert-routing-edit role from configuring alert routing for user-defined projects in Alertmanager.
Alert routing for user-defined projects is disabled by default. You do not need to disable it if the feature is not already enabled.
Prerequisites
- You have enabled monitoring for user-defined projects.
- You have enabled alert routing for user-defined projects.
-
You have access to the cluster as a user with the
cluster-adminrole. -
You have installed the OpenShift CLI (
oc).
Procedure
Edit the
cluster-monitoring-configConfigMapobject:$ oc -n openshift-monitoring edit configmap cluster-monitoring-config
Change the value to
falseforenableUserAlertmanagerConfigunder thealertmanagerMainkey indata/config.yaml:apiVersion: v1 kind: ConfigMap metadata: name: cluster-monitoring-config namespace: openshift-monitoring data: config.yaml: | enableUserWorkload: true alertmanagerMain: enableUserAlertmanagerConfig: false 1- 1
- When set to
false, theenableUserAlertmanagerConfigparameter disables alert routing for user-defined projects in a cluster.
- Save the file to apply the changes. Alert routing for user-defined projects is disabled automatically.
Additional resources
6.5. Next steps
Chapter 7. Managing metrics
You can collect metrics to monitor how cluster components and your own workloads are performing.
7.1. Understanding metrics
In OpenShift Container Platform 4.10, cluster components are monitored by scraping metrics exposed through service endpoints. You can also configure metrics collection for user-defined projects.
You can define the metrics that you want to provide for your own workloads by using Prometheus client libraries at the application level.
In OpenShift Container Platform, metrics are exposed through an HTTP service endpoint under the /metrics canonical name. You can list all available metrics for a service by running a curl query against http://<endpoint>/metrics. For instance, you can expose a route to the prometheus-example-app example service and then run the following to view all of its available metrics:
$ curl http://<example_app_endpoint>/metrics
Example output
# HELP http_requests_total Count of all HTTP requests
# TYPE http_requests_total counter
http_requests_total{code="200",method="get"} 4
http_requests_total{code="404",method="get"} 2
# HELP version Version information about this binary
# TYPE version gauge
version{version="v0.1.0"} 1
Additional resources
- See the Prometheus documentation for details on Prometheus client libraries.
7.2. Setting up metrics collection for user-defined projects
You can create a ServiceMonitor resource to scrape metrics from a service endpoint in a user-defined project. This assumes that your application uses a Prometheus client library to expose metrics to the /metrics canonical name.
This section describes how to deploy a sample service in a user-defined project and then create a ServiceMonitor resource that defines how that service should be monitored.
7.2.1. Deploying a sample service
To test monitoring of a service in a user-defined project, you can deploy a sample service.
Procedure
-
Create a YAML file for the service configuration. In this example, it is called
prometheus-example-app.yaml. Add the following deployment and service configuration details to the file:
apiVersion: v1
kind: Namespace
metadata:
  name: ns1
---
apiVersion: apps/v1
kind: Deployment
metadata:
  labels:
    app: prometheus-example-app
  name: prometheus-example-app
  namespace: ns1
spec:
  replicas: 1
  selector:
    matchLabels:
      app: prometheus-example-app
  template:
    metadata:
      labels:
        app: prometheus-example-app
    spec:
      containers:
      - image: ghcr.io/rhobs/prometheus-example-app:0.4.1
        imagePullPolicy: IfNotPresent
        name: prometheus-example-app
---
apiVersion: v1
kind: Service
metadata:
  labels:
    app: prometheus-example-app
  name: prometheus-example-app
  namespace: ns1
spec:
  ports:
  - port: 8080
    protocol: TCP
    targetPort: 8080
    name: web
  selector:
    app: prometheus-example-app
  type: ClusterIP
This configuration deploys a service named
prometheus-example-appin the user-definedns1project. This service exposes the customversionmetric.Apply the configuration to the cluster:
$ oc apply -f prometheus-example-app.yaml
It takes some time to deploy the service.
You can check that the pod is running:
$ oc -n ns1 get pod
Example output
NAME                                      READY     STATUS    RESTARTS   AGE
prometheus-example-app-7857545cb7-sbgwq   1/1       Running   0          81m
7.2.2. Specifying how a service is monitored
To use the metrics exposed by your service, you must configure OpenShift Container Platform monitoring to scrape metrics from the /metrics endpoint. You can do this using a ServiceMonitor custom resource definition (CRD) that specifies how a service should be monitored, or a PodMonitor CRD that specifies how a pod should be monitored. The former requires a Service object, while the latter does not, allowing Prometheus to directly scrape metrics from the metrics endpoint exposed by a pod.
This procedure shows you how to create a ServiceMonitor resource for a service in a user-defined project.
Prerequisites
-
You have access to the cluster as a user with the
cluster-admincluster role or themonitoring-editcluster role. - You have enabled monitoring for user-defined projects.
For this example, you have deployed the
prometheus-example-appsample service in thens1project.NoteThe
prometheus-example-appsample service does not support TLS authentication.
Procedure
-
Create a YAML file for the
ServiceMonitorresource configuration. In this example, the file is calledexample-app-service-monitor.yaml. Add the following
ServiceMonitorresource configuration details:apiVersion: monitoring.coreos.com/v1 kind: ServiceMonitor metadata: labels: k8s-app: prometheus-example-monitor name: prometheus-example-monitor namespace: ns1 spec: endpoints: - interval: 30s port: web scheme: http selector: matchLabels: app: prometheus-example-appThis defines a
ServiceMonitorresource that scrapes the metrics exposed by theprometheus-example-appsample service, which includes theversionmetric.NoteA
ServiceMonitorresource in a user-defined namespace can only discover services in the same namespace. That is, thenamespaceSelectorfield of theServiceMonitorresource is always ignored.Apply the configuration to the cluster:
$ oc apply -f example-app-service-monitor.yaml
It takes some time to deploy the
ServiceMonitorresource.You can check that the
ServiceMonitorresource is running:$ oc -n ns1 get servicemonitor
Example output
NAME                         AGE
prometheus-example-monitor   81m
7.3. Querying metrics
The OpenShift Container Platform monitoring dashboard enables you to run Prometheus Query Language (PromQL) queries to examine metrics visualized on a plot. This functionality provides information about the state of a cluster and any user-defined workloads that you are monitoring.
As a cluster administrator, you can query metrics for all core OpenShift Container Platform and user-defined projects.
As a developer, you must specify a project name when querying metrics. You must have the required privileges to view metrics for the selected project.
7.3.1. Querying metrics for all projects as a cluster administrator
As a cluster administrator or as a user with view permissions for all projects, you can access metrics for all default OpenShift Container Platform and user-defined projects in the Metrics UI.
Only cluster administrators have access to the third-party UIs provided with OpenShift Container Platform Monitoring.
Prerequisites
-
You have access to the cluster as a user with the
cluster-admincluster role or with view permissions for all projects. -
You have installed the OpenShift CLI (
oc).
Procedure
- In the Administrator perspective within the OpenShift Container Platform web console, select Observe → Metrics.
- Select Insert Metric at Cursor to view a list of predefined queries.
- To create a custom query, add your Prometheus Query Language (PromQL) query to the Expression field.
- To add multiple queries, select Add Query.
-
To delete a query, select
 next to the query, then choose Delete query.
-
To disable a query from being run, select
next to the query and choose Disable query.
Select Run Queries to run the queries that you have created. The metrics from the queries are visualized on the plot. If a query is invalid, the UI shows an error message.
NoteQueries that operate on large amounts of data might time out or overload the browser when drawing time series graphs. To avoid this, select Hide graph and calibrate your query using only the metrics table. Then, after finding a feasible query, enable the plot to draw the graphs.
- Optional: The page URL now contains the queries you ran. To use this set of queries again in the future, save this URL.
Additional resources
- See the Prometheus query documentation for more information about creating PromQL queries.
7.3.2. Querying metrics for user-defined projects as a developer
You can access metrics for a user-defined project as a developer or as a user with view permissions for the project.
In the Developer perspective, the Metrics UI includes some predefined CPU, memory, bandwidth, and network packet queries for the selected project. You can also run custom Prometheus Query Language (PromQL) queries for CPU, memory, bandwidth, network packet and application metrics for the project.
Developers can only use the Developer perspective and not the Administrator perspective. As a developer, you can only query metrics for one project at a time. Developers cannot access the third-party UIs provided with OpenShift Container Platform monitoring that are for core platform components. Instead, use the Metrics UI for your user-defined project.
Prerequisites
- You have access to the cluster as a developer or as a user with view permissions for the project that you are viewing metrics for.
- You have enabled monitoring for user-defined projects.
- You have deployed a service in a user-defined project.
-
You have created a
ServiceMonitorcustom resource definition (CRD) for the service to define how the service is monitored.
Procedure
- From the Developer perspective in the OpenShift Container Platform web console, select Observe → Metrics.
- Select the project that you want to view metrics for in the Project: list.
Choose a query from the Select Query list, or run a custom PromQL query by selecting Show PromQL.
NoteIn the Developer perspective, you can only run one query at a time.
Additional resources
- See the Prometheus query documentation for more information about creating PromQL queries.
7.3.3. Exploring the visualized metrics
After running the queries, the metrics are displayed on an interactive plot. The X-axis in the plot represents time and the Y-axis represents metrics values. Each metric is shown as a colored line on the graph. You can manipulate the plot interactively and explore the metrics.
Procedure
In the Administrator perspective:
Initially, all metrics from all enabled queries are shown on the plot. You can select which metrics are shown.
NoteBy default, the query table shows an expanded view that lists every metric and its current value. You can select ˅ to minimize the expanded view for a query.
-
To hide all metrics from a query, click
for the query and click Hide all series.
- To hide a specific metric, go to the query table and click the colored square near the metric name.
-
To hide all metrics from a query, click
To zoom into the plot and change the time range, do one of the following:
- Visually select the time range by clicking and dragging on the plot horizontally.
- Use the menu in the left upper corner to select the time range.
- To reset the time range, select Reset Zoom.
- To display outputs for all queries at a specific point in time, hold the mouse cursor on the plot at that point. The query outputs will appear in a pop-up box.
- To hide the plot, select Hide Graph.
In the Developer perspective:
To zoom into the plot and change the time range, do one of the following:
- Visually select the time range by clicking and dragging on the plot horizontally.
- Use the menu in the left upper corner to select the time range.
- To reset the time range, select Reset Zoom.
- To display outputs for all queries at a specific point in time, hold the mouse cursor on the plot at that point. The query outputs will appear in a pop-up box.
Additional resources
- See the Querying metrics section on using the PromQL interface
7.4. Next steps
Chapter 8. Managing metrics targets
OpenShift Container Platform Monitoring collects metrics from targeted cluster components by scraping data from exposed service endpoints.
In the Administrator perspective in the OpenShift Container Platform web console, you can use the Metrics Targets page to view, search, and filter the endpoints that are currently targeted for scraping, which helps you to identify and troubleshoot problems. For example, you can view the current status of targeted endpoints to see when OpenShift Container Platform Monitoring is not able to scrape metrics from a targeted component.
The Metrics Targets page shows targets for default OpenShift Container Platform projects and for user-defined projects.
8.1. Accessing the Metrics Targets page in the Administrator perspective
You can view the Metrics Targets page in the Administrator perspective in the OpenShift Container Platform web console.
Prerequisites
- You have access to the cluster as an administrator for the project for which you want to view metrics targets.
Procedure
- In the Administrator perspective, select Observe → Targets. The Metrics Targets page opens with a list of all service endpoint targets that are being scraped for metrics.
8.2. Searching and filtering metrics targets
The list of metrics targets can be long. You can filter and search these targets based on various criteria.
In the Administrator perspective, the Metrics Targets page provides details about targets for default OpenShift Container Platform and user-defined projects. This page lists the following information for each target:
- the service endpoint URL being scraped
- the ServiceMonitor component being monitored
- the up or down status of the target
- the namespace
- the last scrape time
- the duration of the last scrape
You can filter the list of targets by status and source. The following filtering options are available:
Status filters:
- Up. The target is currently up and being actively scraped for metrics.
- Down. The target is currently down and not being scraped for metrics.
Source filters:
- Platform. Platform-level targets relate only to default OpenShift Container Platform projects. These projects provide core OpenShift Container Platform functionality.
- User. User targets relate to user-defined projects. These projects are user-created and can be customized.
You can also use the search box to find a target by target name or label. Select Text or Label from the search box menu to limit your search.
8.3. Getting detailed information about a target
On the Target details page, you can view detailed information about a metric target.
Prerequisites
- You have access to the cluster as an administrator for the project for which you want to view metrics targets.
Procedure
To view detailed information about a target in the Administrator perspective:
- Open the OpenShift Container Platform web console and navigate to Observe → Targets.
- Optional: Filter the targets by status and source by selecting filters in the Filter list.
- Optional: Search for a target by name or label by using the Text or Label field next to the search box.
- Optional: Sort the targets by clicking one or more of the Endpoint, Status, Namespace, Last Scrape, and Scrape Duration column headers.
Click the URL in the Endpoint column for a target to navigate to its Target details page. This page provides information about the target, including:
- The endpoint URL being scraped for metrics
- The current Up or Down status of the target
- A link to the namespace
- A link to the ServiceMonitor details
- Labels attached to the target
- The most recent time that the target was scraped for metrics
8.4. Next steps
Chapter 9. Managing alerts
In OpenShift Container Platform 4.10, the Alerting UI enables you to manage alerts, silences, and alerting rules.
- Alerting rules. Alerting rules contain a set of conditions that outline a particular state within a cluster. Alerts are triggered when those conditions are true. An alerting rule can be assigned a severity that defines how the alerts are routed.
- Alerts. An alert is fired when the conditions defined in an alerting rule are true. Alerts provide a notification that a set of circumstances are apparent within an OpenShift Container Platform cluster.
- Silences. A silence can be applied to an alert to prevent notifications from being sent when the conditions for an alert are true. You can mute an alert after the initial notification, while you work on resolving the underlying issue.
The alerts, silences, and alerting rules that are available in the Alerting UI relate to the projects that you have access to. For example, if you are logged in with cluster-admin privileges, you can access all alerts, silences, and alerting rules.
If you are a non-administrator user, you can create and silence alerts if you are assigned the following user roles:
-
The
cluster-monitoring-viewcluster role, which allows you to access Alertmanager -
The
monitoring-alertmanager-editrole, which permits you to create and silence alerts in the Administrator perspective in the web console -
The
monitoring-rules-editcluster role, which permits you to create and silence alerts in the Developer perspective in the web console
9.1. Accessing the Alerting UI in the Administrator and Developer perspectives
The Alerting UI is accessible through the Administrator perspective and the Developer perspective in the OpenShift Container Platform web console.
- In the Administrator perspective, select Observe → Alerting. The three main pages in the Alerting UI in this perspective are the Alerts, Silences, and Alerting Rules pages.
- In the Developer perspective, select Observe → <project_name> → Alerts. In this perspective, alerts, silences, and alerting rules are all managed from the Alerts page. The results shown in the Alerts page are specific to the selected project.
In the Developer perspective, you can select from core OpenShift Container Platform and user-defined projects that you have access to in the Project: list. However, alerts, silences, and alerting rules relating to core OpenShift Container Platform projects are not displayed if you do not have cluster-admin privileges.
9.2. Searching and filtering alerts, silences, and alerting rules
You can filter the alerts, silences, and alerting rules that are displayed in the Alerting UI. This section provides a description of each of the available filtering options.
Understanding alert filters
In the Administrator perspective, the Alerts page in the Alerting UI provides details about alerts relating to default OpenShift Container Platform and user-defined projects. The page includes a summary of severity, state, and source for each alert. The time at which an alert went into its current state is also shown.
You can filter by alert state, severity, and source. By default, only Platform alerts that are Firing are displayed. The following describes each alert filtering option:
Alert State filters:
-
Firing. The alert is firing because the alert condition is true and the optional
forduration has passed. The alert will continue to fire as long as the condition remains true. - Pending. The alert is active but is waiting for the duration that is specified in the alerting rule before it fires.
- Silenced. The alert is now silenced for a defined time period. Silences temporarily mute alerts based on a set of label selectors that you define. Notifications will not be sent for alerts that match all the listed values or regular expressions.
-
Firing. The alert is firing because the alert condition is true and the optional
Severity filters:
- Critical. The condition that triggered the alert could have a critical impact. The alert requires immediate attention when fired and is typically paged to an individual or to a critical response team.
- Warning. The alert provides a warning notification about something that might require attention to prevent a problem from occurring. Warnings are typically routed to a ticketing system for non-immediate review.
- Info. The alert is provided for informational purposes only.
- None. The alert has no defined severity.
- You can also create custom severity definitions for alerts relating to user-defined projects.
Source filters:
- Platform. Platform-level alerts relate only to default OpenShift Container Platform projects. These projects provide core OpenShift Container Platform functionality.
- User. User alerts relate to user-defined projects. These alerts are user-created and are customizable. User-defined workload monitoring can be enabled post-installation to provide observability into your own workloads.
Understanding silence filters
In the Administrator perspective, the Silences page in the Alerting UI provides details about silences applied to alerts in default OpenShift Container Platform and user-defined projects. The page includes a summary of the state of each silence and the time at which a silence ends.
You can filter by silence state. By default, only Active and Pending silences are displayed. The following describes each silence state filter option:
Silence State filters:
- Active. The silence is active and the alert will be muted until the silence is expired.
- Pending. The silence has been scheduled and it is not yet active.
- Expired. The silence has expired and notifications will be sent if the conditions for an alert are true.
Understanding alerting rule filters
In the Administrator perspective, the Alerting Rules page in the Alerting UI provides details about alerting rules relating to default OpenShift Container Platform and user-defined projects. The page includes a summary of the state, severity, and source for each alerting rule.
You can filter alerting rules by alert state, severity, and source. By default, only Platform alerting rules are displayed. The following describes each alerting rule filtering option:
Alert State filters:
-
Firing. The alert is firing because the alert condition is true and the optional
forduration has passed. The alert will continue to fire as long as the condition remains true. - Pending. The alert is active but is waiting for the duration that is specified in the alerting rule before it fires.
- Silenced. The alert is now silenced for a defined time period. Silences temporarily mute alerts based on a set of label selectors that you define. Notifications will not be sent for alerts that match all the listed values or regular expressions.
- Not Firing. The alert is not firing.
-
Firing. The alert is firing because the alert condition is true and the optional
Severity filters:
- Critical. The conditions defined in the alerting rule could have a critical impact. When true, these conditions require immediate attention. Alerts relating to the rule are typically paged to an individual or to a critical response team.
- Warning. The conditions defined in the alerting rule might require attention to prevent a problem from occurring. Alerts relating to the rule are typically routed to a ticketing system for non-immediate review.
- Info. The alerting rule provides informational alerts only.
- None. The alerting rule has no defined severity.
- You can also create custom severity definitions for alerting rules relating to user-defined projects.
Source filters:
- Platform. Platform-level alerting rules relate only to default OpenShift Container Platform projects. These projects provide core OpenShift Container Platform functionality.
- User. User-defined workload alerting rules relate to user-defined projects. These alerting rules are user-created and are customizable. User-defined workload monitoring can be enabled post-installation to provide observability into your own workloads.
Searching and filtering alerts, silences, and alerting rules in the Developer perspective
In the Developer perspective, the Alerts page in the Alerting UI provides a combined view of alerts and silences relating to the selected project. A link to the governing alerting rule is provided for each displayed alert.
In this view, you can filter by alert state and severity. By default, all alerts in the selected project are displayed if you have permission to access the project. These filters are the same as those described for the Administrator perspective.
9.3. Getting information about alerts, silences, and alerting rules
The Alerting UI provides detailed information about alerts and their governing alerting rules and silences.
Prerequisites
- You have access to the cluster as a developer or as a user with view permissions for the project that you are viewing metrics for.
Procedure
To obtain information about alerts in the Administrator perspective:
- Open the OpenShift Container Platform web console and navigate to the Observe → Alerting → Alerts page.
- Optional: Search for alerts by name using the Name field in the search list.
- Optional: Filter alerts by state, severity, and source by selecting filters in the Filter list.
- Optional: Sort the alerts by clicking one or more of the Name, Severity, State, and Source column headers.
Select the name of an alert to navigate to its Alert Details page. The page includes a graph that illustrates alert time series data. It also provides information about the alert, including:
- A description of the alert
- Messages associated with the alerts
- Labels attached to the alert
- A link to its governing alerting rule
- Silences for the alert, if any exist
To obtain information about silences in the Administrator perspective:
- Navigate to the Observe → Alerting → Silences page.
- Optional: Filter the silences by name using the Search by name field.
- Optional: Filter silences by state by selecting filters in the Filter list. By default, Active and Pending filters are applied.
- Optional: Sort the silences by clicking one or more of the Name, Firing Alerts, and State column headers.
Select the name of a silence to navigate to its Silence Details page. The page includes the following details:
- Alert specification
- Start time
- End time
- Silence state
- Number and list of firing alerts
To obtain information about alerting rules in the Administrator perspective:
- Navigate to the Observe → Alerting → Alerting Rules page.
- Optional: Filter alerting rules by state, severity, and source by selecting filters in the Filter list.
- Optional: Sort the alerting rules by clicking one or more of the Name, Severity, Alert State, and Source column headers.
Select the name of an alerting rule to navigate to its Alerting Rule Details page. The page provides the following details about the alerting rule:
- Alerting rule name, severity, and description
- The expression that defines the condition for firing the alert
- The time for which the condition should be true for an alert to fire
- A graph for each alert governed by the alerting rule, showing the value with which the alert is firing
- A table of all alerts governed by the alerting rule
To obtain information about alerts, silences, and alerting rules in the Developer perspective:
- Navigate to the Observe → <project_name> → Alerts page.
View details for an alert, silence, or an alerting rule:
- Alert Details can be viewed by selecting > to the left of an alert name and then selecting the alert in the list.
Silence Details can be viewed by selecting a silence in the Silenced By section of the Alert Details page. The Silence Details page includes the following information:
- Alert specification
- Start time
- End time
- Silence state
- Number and list of firing alerts
-
Alerting Rule Details can be viewed by selecting View Alerting Rule in the
menu on the right of an alert in the Alerts page.
Only alerts, silences, and alerting rules relating to the selected project are displayed in the Developer perspective.
9.4. Managing alerting rules
OpenShift Container Platform monitoring ships with a set of default alerting rules. As a cluster administrator, you can view the default alerting rules.
In OpenShift Container Platform 4.10, you can create, view, edit, and remove alerting rules in user-defined projects.
Alerting rule considerations
- The default alerting rules are used specifically for the OpenShift Container Platform cluster.
- Some alerting rules intentionally have identical names. They send alerts about the same event with different thresholds, different severity, or both.
- Inhibition rules prevent notifications for lower severity alerts that are firing when a higher severity alert is also firing.
9.4.1. Optimizing alerting for user-defined projects
You can optimize alerting for your own projects by considering the following recommendations when creating alerting rules:
- Minimize the number of alerting rules that you create for your project. Create alerting rules that notify you of conditions that impact you. It is more difficult to notice relevant alerts if you generate many alerts for conditions that do not impact you.
- Create alerting rules for symptoms instead of causes. Create alerting rules that notify you of conditions regardless of the underlying cause. The cause can then be investigated. You will need many more alerting rules if each relates only to a specific cause. Some causes are then likely to be missed.
- Plan before you write your alerting rules. Determine what symptoms are important to you and what actions you want to take if they occur. Then build an alerting rule for each symptom.
- Provide clear alert messaging. State the symptom and recommended actions in the alert message.
- Include severity levels in your alerting rules. The severity of an alert depends on how you need to react if the reported symptom occurs. For example, a critical alert should be triggered if a symptom requires immediate attention by an individual or a critical response team.
Optimize alert routing. Deploy an alerting rule directly on the Prometheus instance in the
openshift-user-workload-monitoringproject if the rule does not query default OpenShift Container Platform metrics. This reduces latency for alerting rules and minimizes the load on monitoring components.WarningDefault OpenShift Container Platform metrics for user-defined projects provide information about CPU and memory usage, bandwidth statistics, and packet rate information. Those metrics cannot be included in an alerting rule if you route the rule directly to the Prometheus instance in the
openshift-user-workload-monitoringproject. Alerting rule optimization should be used only if you have read the documentation and have a comprehensive understanding of the monitoring architecture.
Additional resources
- See the Prometheus alerting documentation for further guidelines on optimizing alerts
- See Monitoring overview for details about OpenShift Container Platform 4.10 monitoring architecture
9.4.2. Creating alerting rules for user-defined projects
You can create alerting rules for user-defined projects. Those alerting rules will fire alerts based on the values of chosen metrics.
Prerequisites
- You have enabled monitoring for user-defined projects.
-
You are logged in as a user that has the
monitoring-rules-editcluster role for the project where you want to create an alerting rule. -
You have installed the OpenShift CLI (
oc).
Procedure
-
Create a YAML file for alerting rules. In this example, it is called
example-app-alerting-rule.yaml. Add an alerting rule configuration to the YAML file. For example:
NoteWhen you create an alerting rule, a project label is enforced on it if a rule with the same name exists in another project.
apiVersion: monitoring.coreos.com/v1
kind: PrometheusRule
metadata:
  name: example-alert
  namespace: ns1
spec:
  groups:
  - name: example
    rules:
    - alert: VersionAlert
      expr: version{job="prometheus-example-app"} == 0
This configuration creates an alerting rule named
example-alert. The alerting rule fires an alert when theversionmetric exposed by the sample service becomes0.ImportantA user-defined alerting rule can include metrics for its own project and cluster metrics. You cannot include metrics for another user-defined project.
For example, an alerting rule for the user-defined project
ns1can have metrics fromns1and cluster metrics, such as the CPU and memory metrics. However, the rule cannot include metrics fromns2.Additionally, you cannot create alerting rules for the
openshift-*core OpenShift Container Platform projects. OpenShift Container Platform monitoring by default provides a set of alerting rules for these projects.Apply the configuration file to the cluster:
$ oc apply -f example-app-alerting-rule.yaml
It takes some time to create the alerting rule.
9.4.3. Reducing latency for alerting rules that do not query platform metrics
If an alerting rule for a user-defined project does not query default cluster metrics, you can deploy the rule directly on the Prometheus instance in the openshift-user-workload-monitoring project. This reduces latency for alerting rules by bypassing Thanos Ruler when it is not required. This also helps to minimize the overall load on monitoring components.
Default OpenShift Container Platform metrics for user-defined projects provide information about CPU and memory usage, bandwidth statistics, and packet rate information. Those metrics cannot be included in an alerting rule if you deploy the rule directly to the Prometheus instance in the openshift-user-workload-monitoring project. The procedure outlined in this section should only be used if you have read the documentation and have a comprehensive understanding of the monitoring architecture.
Prerequisites
- You have enabled monitoring for user-defined projects.
-
You are logged in as a user that has the
monitoring-rules-editcluster role for the project where you want to create an alerting rule. -
You have installed the OpenShift CLI (
oc).
Procedure
-
Create a YAML file for alerting rules. In this example, it is called
example-app-alerting-rule.yaml. Add an alerting rule configuration to the YAML file that includes a label with the key
openshift.io/prometheus-rule-evaluation-scopeand valueleaf-prometheus. For example:apiVersion: monitoring.coreos.com/v1 kind: PrometheusRule metadata: name: example-alert namespace: ns1 labels: openshift.io/prometheus-rule-evaluation-scope: leaf-prometheus spec: groups: - name: example rules: - alert: VersionAlert expr: version{job="prometheus-example-app"} == 0
If that label is present, the alerting rule is deployed on the Prometheus instance in the openshift-user-workload-monitoring project. If the label is not present, the alerting rule is deployed to Thanos Ruler.
Apply the configuration file to the cluster:
$ oc apply -f example-app-alerting-rule.yaml
It takes some time to create the alerting rule.
- See Monitoring overview for details about OpenShift Container Platform 4.10 monitoring architecture.
9.4.4. Accessing alerting rules for user-defined projects
To list alerting rules for a user-defined project, you must have been assigned the monitoring-rules-view cluster role for the project.
Prerequisites
- You have enabled monitoring for user-defined projects.
-
You are logged in as a user that has the
monitoring-rules-viewcluster role for your project. -
You have installed the OpenShift CLI (
oc).
Procedure
You can list alerting rules in
<project>:$ oc -n <project> get prometheusrule
To list the configuration of an alerting rule, run the following:
$ oc -n <project> get prometheusrule <rule> -o yaml
9.4.5. Listing alerting rules for all projects in a single view
As a cluster administrator, you can list alerting rules for core OpenShift Container Platform and user-defined projects together in a single view.
Prerequisites
-
You have access to the cluster as a user with the
cluster-adminrole. -
You have installed the OpenShift CLI (
oc).
Procedure
- In the Administrator perspective, navigate to Observe → Alerting → Alerting Rules.
Select the Platform and User sources in the Filter drop-down menu.
NoteThe Platform source is selected by default.
9.4.6. Removing alerting rules for user-defined projects
You can remove alerting rules for user-defined projects.
Prerequisites
- You have enabled monitoring for user-defined projects.
-
You are logged in as a user that has the
monitoring-rules-editcluster role for the project where you want to create an alerting rule. -
You have installed the OpenShift CLI (
oc).
Procedure
To remove rule
<foo>in<namespace>, run the following:$ oc -n <namespace> delete prometheusrule <foo>
Additional resources
- See the Alertmanager documentation
9.5. Managing silences
You can create a silence to stop receiving notifications about an alert when it is firing. It might be useful to silence an alert after being first notified, while you resolve the underlying issue.
When creating a silence, you must specify whether it becomes active immediately or at a later time. You must also set a duration period after which the silence expires.
You can view, edit, and expire existing silences.
9.5.1. Silencing alerts
You can either silence a specific alert or silence alerts that match a specification that you define.
Prerequisites
-
You are a cluster administrator and have access to the cluster as a user with the
cluster-admincluster role. You are a non-administator user and have access to the cluster as a user with the following user roles:
-
The
cluster-monitoring-viewcluster role, which allows you to access Alertmanager. -
The
monitoring-alertmanager-editrole, which permits you to create and silence alerts in the Administrator perspective in the web console. -
The
monitoring-rules-editcluster role, which permits you to create and silence alerts in the Developer perspective in the web console.
-
The
Procedure
To silence a specific alert:
In the Administrator perspective:
- Navigate to the Observe → Alerting → Alerts page of the OpenShift Container Platform web console.
-
For the alert that you want to silence, select the
in the right-hand column and select Silence Alert. The Silence Alert form will appear with a pre-populated specification for the chosen alert.
- Optional: Modify the silence.
- You must add a comment before creating the silence.
- To create the silence, select Silence.
In the Developer perspective:
- Navigate to the Observe → <project_name> → Alerts page in the OpenShift Container Platform web console.
- Expand the details for an alert by selecting > to the left of the alert name. Select the name of the alert in the expanded view to open the Alert Details page for the alert.
- Select Silence Alert. The Silence Alert form will appear with a prepopulated specification for the chosen alert.
- Optional: Modify the silence.
- You must add a comment before creating the silence.
- To create the silence, select Silence.
To silence a set of alerts by creating an alert specification in the Administrator perspective:
- Navigate to the Observe → Alerting → Silences page in the OpenShift Container Platform web console.
- Select Create Silence.
- Set the schedule, duration, and label details for an alert in the Create Silence form. You must also add a comment for the silence.
- To create silences for alerts that match the label sectors that you entered in the previous step, select Silence.
9.5.2. Editing silences
You can edit a silence, which will expire the existing silence and create a new one with the changed configuration.
Procedure
To edit a silence in the Administrator perspective:
- Navigate to the Observe → Alerting → Silences page.
For the silence you want to modify, select the
in the last column and choose Edit silence.
Alternatively, you can select Actions → Edit Silence in the Silence Details page for a silence.
- In the Edit Silence page, enter your changes and select Silence. This will expire the existing silence and create one with the chosen configuration.
To edit a silence in the Developer perspective:
- Navigate to the Observe → <project_name> → Alerts page.
- Expand the details for an alert by selecting > to the left of the alert name. Select the name of the alert in the expanded view to open the Alert Details page for the alert.
- Select the name of a silence in the Silenced By section in that page to navigate to the Silence Details page for the silence.
- Select the name of a silence to navigate to its Silence Details page.
- Select Actions → Edit Silence in the Silence Details page for a silence.
- In the Edit Silence page, enter your changes and select Silence. This will expire the existing silence and create one with the chosen configuration.
9.5.3. Expiring silences
You can expire a silence. Expiring a silence deactivates it forever.
You cannot delete expired, silenced alerts. Expired silences older than 120 hours are garbage collected.
Procedure
To expire a silence in the Administrator perspective:
- Navigate to the Observe → Alerting → Silences page.
For the silence you want to modify, select the
in the last column and choose Expire silence.
Alternatively, you can select Actions → Expire Silence in the Silence Details page for a silence.
To expire a silence in the Developer perspective:
- Navigate to the Observe → <project_name> → Alerts page.
- Expand the details for an alert by selecting > to the left of the alert name. Select the name of the alert in the expanded view to open the Alert Details page for the alert.
- Select the name of a silence in the Silenced By section in that page to navigate to the Silence Details page for the silence.
- Select the name of a silence to navigate to its Silence Details page.
- Select Actions → Expire Silence in the Silence Details page for a silence.
9.6. Sending notifications to external systems
In OpenShift Container Platform 4.10, firing alerts can be viewed in the Alerting UI. Alerts are not configured by default to be sent to any notification systems. You can configure OpenShift Container Platform to send alerts to the following receiver types:
- PagerDuty
- Webhook
- Slack
Routing alerts to receivers enables you to send timely notifications to the appropriate teams when failures occur. For example, critical alerts require immediate attention and are typically paged to an individual or a critical response team. Alerts that provide non-critical warning notifications might instead be routed to a ticketing system for non-immediate review.
Checking that alerting is operational by using the watchdog alert
OpenShift Container Platform monitoring includes a watchdog alert that fires continuously. Alertmanager repeatedly sends watchdog alert notifications to configured notification providers. The provider is usually configured to notify an administrator when it stops receiving the watchdog alert. This mechanism helps you quickly identify any communication issues between Alertmanager and the notification provider.
9.6.1. Configuring alert receivers
You can configure alert receivers to ensure that you learn about important issues with your cluster.
Prerequisites
-
You have access to the cluster as a user with the
cluster-admincluster role.
Procedure
In the Administrator perspective, navigate to Administration → Cluster Settings → Configuration → Alertmanager.
NoteAlternatively, you can navigate to the same page through the notification drawer. Select the bell icon at the top right of the OpenShift Container Platform web console and choose Configure in the AlertmanagerReceiverNotConfigured alert.
- Select Create Receiver in the Receivers section of the page.
- In the Create Receiver form, add a Receiver Name and choose a Receiver Type from the list.
Edit the receiver configuration:
For PagerDuty receivers:
- Choose an integration type and add a PagerDuty integration key.
- Add the URL of your PagerDuty installation.
- Select Show advanced configuration if you want to edit the client and incident details or the severity specification.
For webhook receivers:
- Add the endpoint to send HTTP POST requests to.
- Select Show advanced configuration if you want to edit the default option to send resolved alerts to the receiver.
For email receivers:
- Add the email address to send notifications to.
- Add SMTP configuration details, including the address to send notifications from, the smarthost and port number used for sending emails, the hostname of the SMTP server, and authentication details.
- Choose whether TLS is required.
- Select Show advanced configuration if you want to edit the default option not to send resolved alerts to the receiver or edit the body of email notifications configuration.
For Slack receivers:
- Add the URL of the Slack webhook.
- Add the Slack channel or user name to send notifications to.
- Select Show advanced configuration if you want to edit the default option not to send resolved alerts to the receiver or edit the icon and username configuration. You can also choose whether to find and link channel names and usernames.
By default, firing alerts with labels that match all of the selectors will be sent to the receiver. If you want label values for firing alerts to be matched exactly before they are sent to the receiver:
- Add routing label names and values in the Routing Labels section of the form.
- Select Regular Expression if want to use a regular expression.
- Select Add Label to add further routing labels.
- Select Create to create the receiver.
9.6.2. Creating alert routing for user-defined projects
Alert routing for user-defined projects is a Technology Preview feature only. Technology Preview features are not supported with Red Hat production service level agreements (SLAs) and might not be functionally complete. Red Hat does not recommend using them in production. These features provide early access to upcoming product features, enabling customers to test functionality and provide feedback during the development process.
For more information about the support scope of Red Hat Technology Preview features, see https://access.redhat.com/support/offerings/techpreview.
If you are a non-administrator user who has been given the alert-routing-edit cluster role, you can create or edit alert routing for user-defined projects.
Prerequisites
- A cluster administrator has enabled monitoring for user-defined projects.
- A cluster administrator has enabled alert routing for user-defined projects.
-
You are logged in as a user that has the
alert-routing-editcluster role for the project for which you want to create alert routing. -
You have installed the OpenShift CLI (
oc).
Procedure
-
Create a YAML file for alert routing. The example in this procedure uses a file called
example-app-alert-routing.yaml. Add an
AlertmanagerConfigYAML definition to the file. For example:apiVersion: monitoring.coreos.com/v1alpha1 kind: AlertmanagerConfig metadata: name: example-routing namespace: ns1 spec: route: receiver: default groupBy: [job] receivers: - name: default webhookConfigs: - url: https://example.org/postNoteFor user-defined alerting rules, user-defined routing is scoped to the namespace in which the resource is defined. For example, a routing configuration defined in the
AlertmanagerConfigobject for namespacens1only applies toPrometheusRulesresources in the same namespace.- Save the file.
Apply the resource to the cluster:
$ oc apply -f example-app-alert-routing.yaml
The configuration is automatically applied to the Alertmanager pods.
9.7. Applying a custom Alertmanager configuration
You can overwrite the default Alertmanager configuration by editing the alertmanager-main secret inside the openshift-monitoring project.
Prerequisites
-
You have access to the cluster as a user with the
cluster-admincluster role.
Procedure
To change the Alertmanager configuration from the CLI:
Print the currently active Alertmanager configuration into file
alertmanager.yaml:$ oc -n openshift-monitoring get secret alertmanager-main --template='{{ index .data "alertmanager.yaml" }}' | base64 --decode > alertmanager.yamlEdit the configuration in
alertmanager.yaml:global: resolve_timeout: 5m route: group_wait: 30s 1 group_interval: 5m 2 repeat_interval: 12h 3 receiver: default routes: - matchers: - "alertname=Watchdog" repeat_interval: 2m receiver: watchdog - matchers: - "service=<your_service>" 4 routes: - matchers: - <your_matching_rules> 5 receiver: <receiver> 6 receivers: - name: default - name: watchdog - name: <receiver> # <receiver_configuration>
- 1
- The
group_waitvalue specifies how long Alertmanager waits before sending an initial notification for a group of alerts. This value controls how long Alertmanager waits while collecting initial alerts for the same group before sending a notification. - 2
- The
group_intervalvalue specifies how much time must elapse before Alertmanager sends a notification about new alerts added to a group of alerts for which an initial notification was already sent. - 3
- The
repeat_intervalvalue specifies the minimum amount of time that must pass before an alert notification is repeated. If you want a notification to repeat at each group interval, set therepeat_intervalvalue to less than thegroup_intervalvalue. However, the repeated notification can still be delayed, for example, when certain Alertmanager pods are restarted or rescheduled. - 4
- The
servicevalue specifies the service that fires the alerts. - 5
- The
<your_matching_rules>value specifies the target alerts. - 6
- The
receivervalue specifies the receiver to use for the alert.
NoteUse the
matcherskey name to indicate the matchers that an alert has to fulfill to match the node. Do not use thematchormatch_rekey names, which are both deprecated and planned for removal in a future release.In addition, if you define inhibition rules, use the
target_matcherskey name to indicate the target matchers and thesource_matcherskey name to indicate the source matchers. Do not use thetarget_match,target_match_re,source_match, orsource_match_rekey names, which are deprecated and planned for removal in a future release.The following Alertmanager configuration example configures PagerDuty as an alert receiver:
global:
  resolve_timeout: 5m
route:
  group_wait: 30s
  group_interval: 5m
  repeat_interval: 12h
  receiver: default
  routes:
  - matchers:
    - "alertname=Watchdog"
    repeat_interval: 2m
    receiver: watchdog
  - matchers:
    - "service=example-app"
    routes:
    - matchers:
      - "severity=critical"
      receiver: team-frontend-page*
receivers:
- name: default
- name: watchdog
- name: team-frontend-page
  pagerduty_configs:
  - service_key: "_your-key_"
With this configuration, alerts of
criticalseverity that are fired by theexample-appservice are sent using theteam-frontend-pagereceiver. Typically these types of alerts would be paged to an individual or a critical response team.Apply the new configuration in the file:
$ oc -n openshift-monitoring create secret generic alertmanager-main --from-file=alertmanager.yaml --dry-run=client -o=yaml | oc -n openshift-monitoring replace secret --filename=-
To change the Alertmanager configuration from the OpenShift Container Platform web console:
- Navigate to the Administration → Cluster Settings → Configuration → Alertmanager → YAML page of the web console.
- Modify the YAML configuration file.
- Select Save.
Additional resources
- See the PagerDuty official site for more information on PagerDuty
-
See the PagerDuty Prometheus Integration Guide to learn how to retrieve the
service_key - See Alertmanager configuration for configuring alerting through different alert receivers
9.8. Next steps
Chapter 10. Reviewing monitoring dashboards
OpenShift Container Platform 4.10 provides a comprehensive set of monitoring dashboards that help you understand the state of cluster components and user-defined workloads.
Use the Administrator perspective to access dashboards for the core OpenShift Container Platform components, including the following items:
- API performance
- etcd
- Kubernetes compute resources
- Kubernetes network resources
- Prometheus
- USE method dashboards relating to cluster and node performance
Figure 10.1. Example dashboard in the Administrator perspective
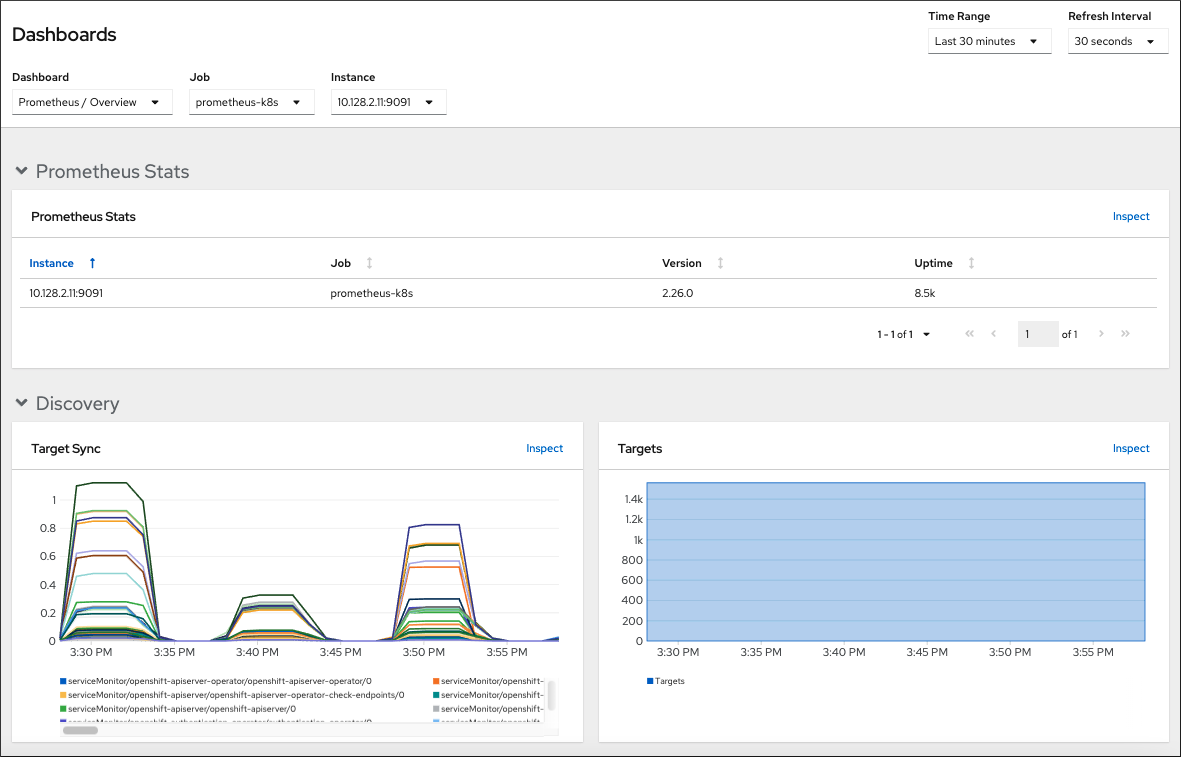
Use the Developer perspective to access Kubernetes compute resources dashboards that provide the following application metrics for a selected project:
- CPU usage
- Memory usage
- Bandwidth information
- Packet rate information
Figure 10.2. Example dashboard in the Developer perspective
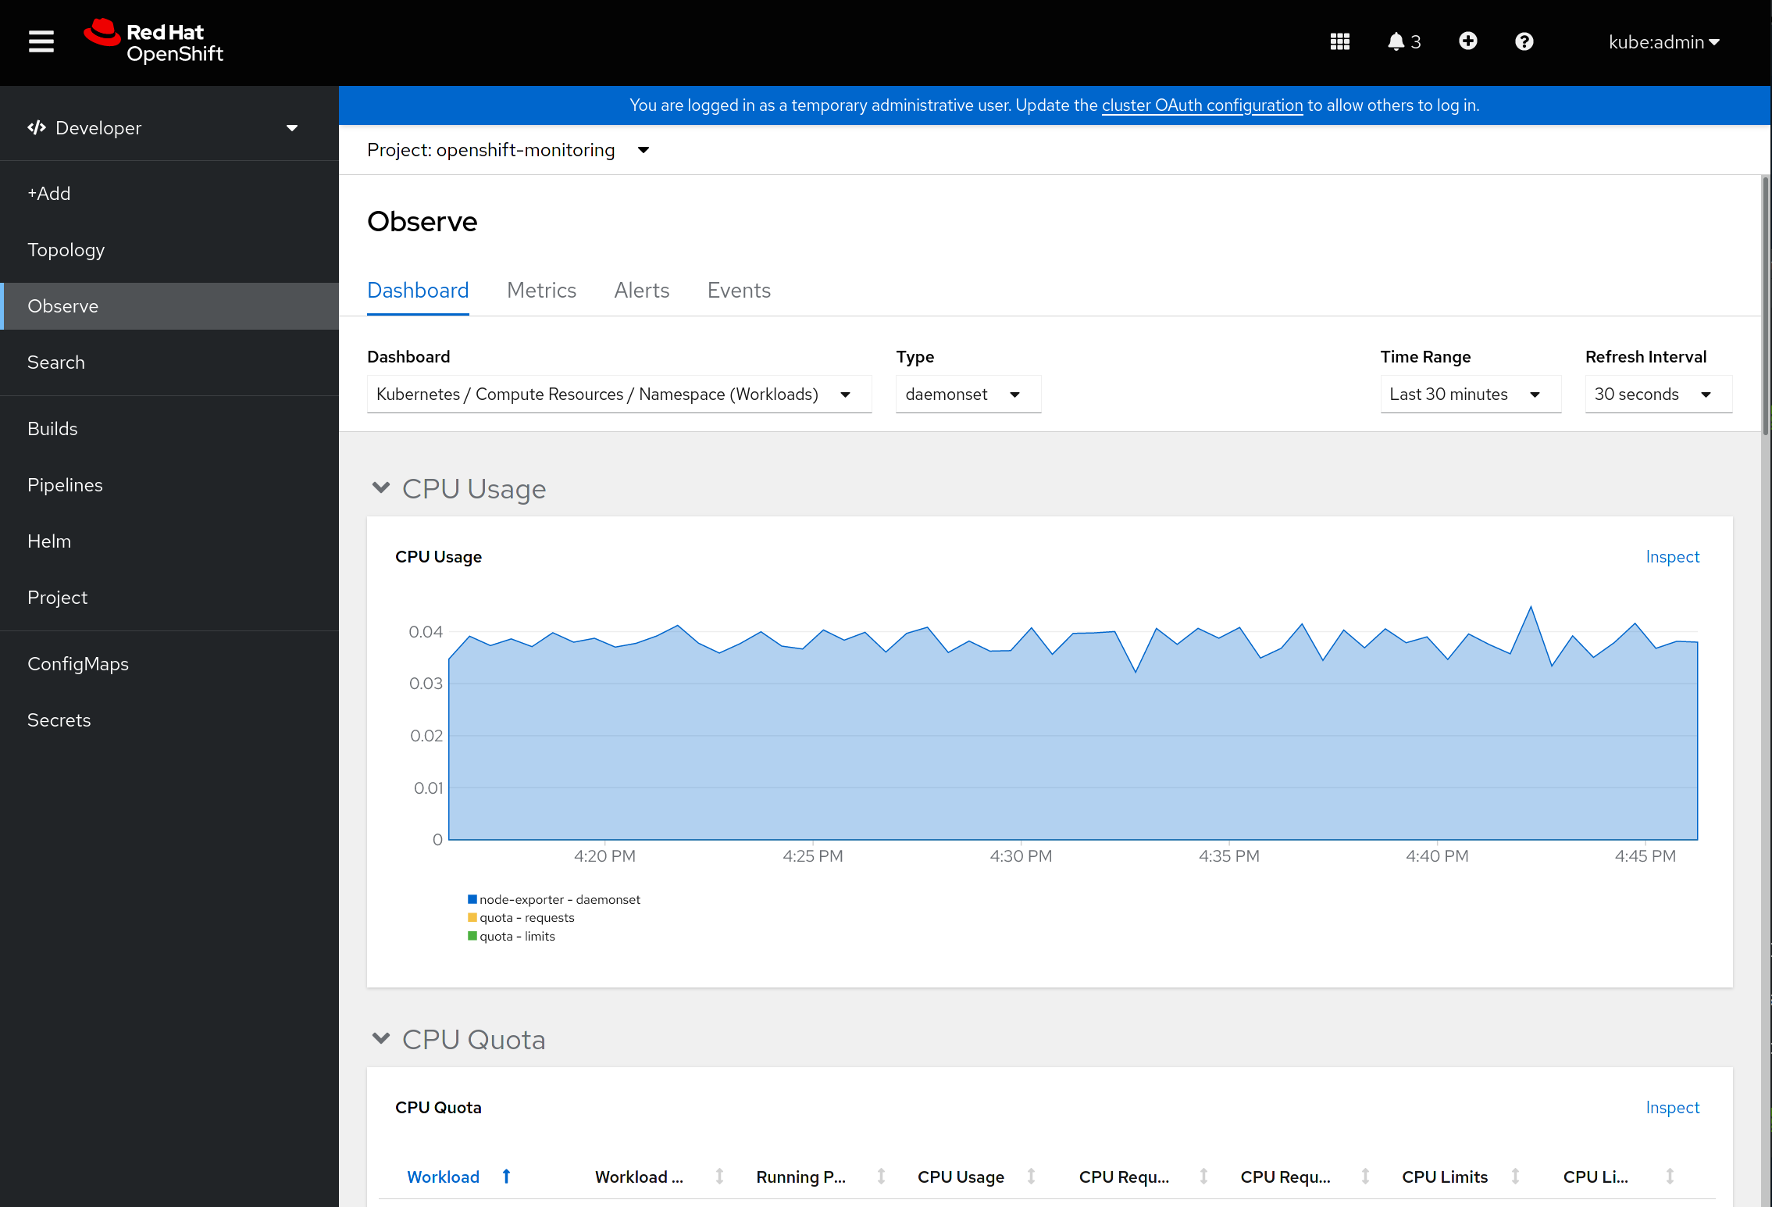
In the Developer perspective, you can view dashboards for only one project at a time.
10.1. Reviewing monitoring dashboards as a cluster administrator
In the Administrator perspective, you can view dashboards relating to core OpenShift Container Platform cluster components.
Prerequisites
-
You have access to the cluster as a user with the
cluster-admincluster role.
Procedure
- In the Administrator perspective in the OpenShift Container Platform web console, navigate to Observe → Dashboards.
- Choose a dashboard in the Dashboard list. Some dashboards, such as etcd and Prometheus dashboards, produce additional sub-menus when selected.
Optional: Select a time range for the graphs in the Time Range list.
- Select a pre-defined time period.
Set a custom time range by selecting Custom time range in the Time Range list.
- Input or select the From and To dates and times.
- Click Save to save the custom time range.
- Optional: Select a Refresh Interval.
- Hover over each of the graphs within a dashboard to display detailed information about specific items.
10.2. Reviewing monitoring dashboards as a developer
Use the Developer perspective to view Kubernetes compute resources dashboards of a selected project.
Prerequisites
- You have access to the cluster as a developer or as a user.
- You have view permissions for the project that you are viewing the dashboard for.
Procedure
- In the Developer perspective in the OpenShift Container Platform web console, navigate to Observe → Dashboard.
- Select a project from the Project: drop-down list.
Select a dashboard from the Dashboard drop-down list to see the filtered metrics.
NoteAll dashboards produce additional sub-menus when selected, except Kubernetes / Compute Resources / Namespace (Pods).
Optional: Select a time range for the graphs in the Time Range list.
- Select a pre-defined time period.
Set a custom time range by selecting Custom time range in the Time Range list.
- Input or select the From and To dates and times.
- Click Save to save the custom time range.
- Optional: Select a Refresh Interval.
- Hover over each of the graphs within a dashboard to display detailed information about specific items.
Additional resources
10.3. Next steps
Chapter 11. Monitoring bare-metal events with the Bare Metal Event Relay
Bare Metal Event Relay is a Technology Preview feature only. Technology Preview features are not supported with Red Hat production service level agreements (SLAs) and might not be functionally complete. Red Hat does not recommend using them in production. These features provide early access to upcoming product features, enabling customers to test functionality and provide feedback during the development process.
For more information about the support scope of Red Hat Technology Preview features, see Technology Preview Features Support Scope.
11.1. About bare-metal events
Use the Bare Metal Event Relay to subscribe applications that run in your OpenShift Container Platform cluster to events that are generated on the underlying bare-metal host. The Redfish service publishes events on a node and transmits them on an advanced message queue to subscribed applications.
Bare-metal events are based on the open Redfish standard that is developed under the guidance of the Distributed Management Task Force (DMTF). Redfish provides a secure industry-standard protocol with a REST API. The protocol is used for the management of distributed, converged or software-defined resources and infrastructure.
Hardware-related events published through Redfish includes:
- Breaches of temperature limits
- Server status
- Fan status
Begin using bare-metal events by deploying the Bare Metal Event Relay Operator and subscribing your application to the service. The Bare Metal Event Relay Operator installs and manages the lifecycle of the Redfish bare-metal event service.
The Bare Metal Event Relay works only with Redfish-capable devices on single-node clusters provisioned on bare-metal infrastructure.
11.2. How bare-metal events work
The Bare Metal Event Relay enables applications running on bare-metal clusters to respond quickly to Redfish hardware changes and failures such as breaches of temperature thresholds, fan failure, disk loss, power outages, and memory failure. These hardware events are delivered over a reliable low-latency transport channel based on Advanced Message Queuing Protocol (AMQP). The latency of the messaging service is between 10 to 20 milliseconds.
The Bare Metal Event Relay provides a publish-subscribe service for the hardware events, where multiple applications can use REST APIs to subscribe and consume the events. The Bare Metal Event Relay supports hardware that complies with Redfish OpenAPI v1.8 or higher.
11.2.1. Bare Metal Event Relay data flow
The following figure illustrates an example of bare-metal events data flow:
Figure 11.1. Bare Metal Event Relay data flow
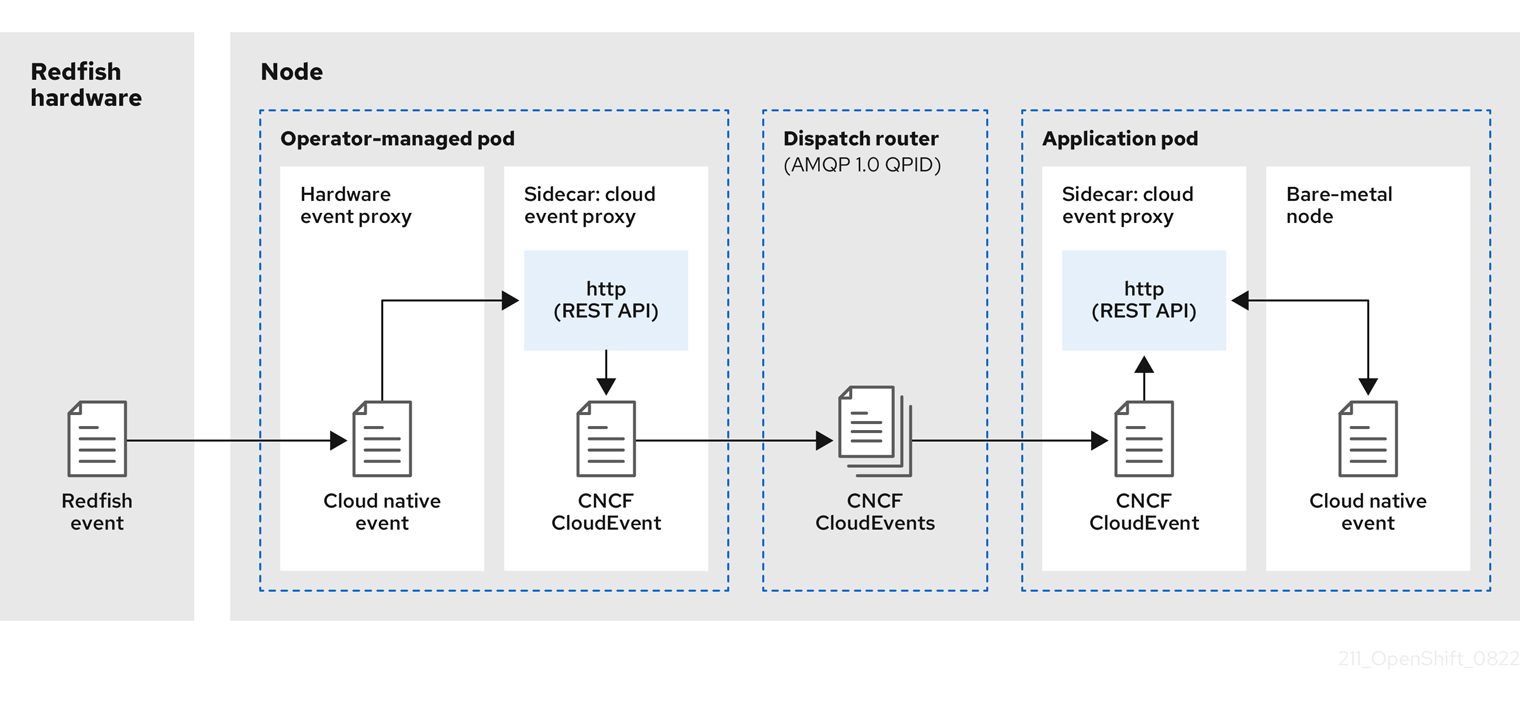
11.2.1.1. Operator-managed pod
The Operator uses custom resources to manage the pod containing the Bare Metal Event Relay and its components using the HardwareEvent CR.
11.2.1.2. Bare Metal Event Relay
At startup, the Bare Metal Event Relay queries the Redfish API and downloads all the message registries, including custom registries. The Bare Metal Event Relay then begins to receive subscribed events from the Redfish hardware.
The Bare Metal Event Relay enables applications running on bare-metal clusters to respond quickly to Redfish hardware changes and failures such as breaches of temperature thresholds, fan failure, disk loss, power outages, and memory failure. The events are reported using the HardwareEvent CR.
11.2.1.3. Cloud native event
Cloud native events (CNE) is a REST API specification for defining the format of event data.
11.2.1.4. CNCF CloudEvents
CloudEvents is a vendor-neutral specification developed by the Cloud Native Computing Foundation (CNCF) for defining the format of event data.
11.2.1.5. AMQP dispatch router
The dispatch router is responsible for the message delivery service between publisher and subscriber. AMQP 1.0 qpid is an open standard that supports reliable, high-performance, fully-symmetrical messaging over the internet.
11.2.1.6. Cloud event proxy sidecar
The cloud event proxy sidecar container image is based on the ORAN API specification and provides a publish-subscribe event framework for hardware events.
11.2.2. Redfish message parsing service
In addition to handling Redfish events, the Bare Metal Event Relay provides message parsing for events without a Message property. The proxy downloads all the Redfish message registries including vendor specific registries from the hardware when it starts. If an event does not contain a Message property, the proxy uses the Redfish message registries to construct the Message and Resolution properties and add them to the event before passing the event to the cloud events framework. This service allows Redfish events to have smaller message size and lower transmission latency.
11.2.3. Installing the Bare Metal Event Relay using the CLI
As a cluster administrator, you can install the Bare Metal Event Relay Operator by using the CLI.
Prerequisites
- A cluster that is installed on bare-metal hardware with nodes that have a RedFish-enabled Baseboard Management Controller (BMC).
-
Install the OpenShift CLI (
oc). -
Log in as a user with
cluster-adminprivileges.
Procedure
Create a namespace for the Bare Metal Event Relay.
Save the following YAML in the
bare-metal-events-namespace.yamlfile:apiVersion: v1 kind: Namespace metadata: name: openshift-bare-metal-events labels: name: openshift-bare-metal-events openshift.io/cluster-monitoring: "true"Create the
NamespaceCR:$ oc create -f bare-metal-events-namespace.yaml
Create an Operator group for the Bare Metal Event Relay Operator.
Save the following YAML in the
bare-metal-events-operatorgroup.yamlfile:apiVersion: operators.coreos.com/v1 kind: OperatorGroup metadata: name: bare-metal-event-relay-group namespace: openshift-bare-metal-events spec: targetNamespaces: - openshift-bare-metal-events
Create the
OperatorGroupCR:$ oc create -f bare-metal-events-operatorgroup.yaml
Subscribe to the Bare Metal Event Relay.
Save the following YAML in the
bare-metal-events-sub.yamlfile:apiVersion: operators.coreos.com/v1alpha1 kind: Subscription metadata: name: bare-metal-event-relay-subscription namespace: openshift-bare-metal-events spec: channel: "stable" name: bare-metal-event-relay source: redhat-operators sourceNamespace: openshift-marketplace
Create the
SubscriptionCR:$ oc create -f bare-metal-events-sub.yaml
Verification
To verify that the Bare Metal Event Relay Operator is installed, run the following command:
$ oc get csv -n openshift-bare-metal-events -o custom-columns=Name:.metadata.name,Phase:.status.phase
Example output
Name                                                    Phase
bare-metal-event-relay.4.10.0-202206301927              Succeeded
11.2.4. Installing the Bare Metal Event Relay using the web console
As a cluster administrator, you can install the Bare Metal Event Relay Operator using the web console.
Prerequisites
- A cluster that is installed on bare-metal hardware with nodes that have a RedFish-enabled Baseboard Management Controller (BMC).
-
Log in as a user with
cluster-adminprivileges.
Procedure
Install the Bare Metal Event Relay using the OpenShift Container Platform web console:
- In the OpenShift Container Platform web console, click Operators → OperatorHub.
- Choose Bare Metal Event Relay from the list of available Operators, and then click Install.
- On the Install Operator page, select or create a Namespace, select openshift-bare-metal-events, and then click Install.
Verification
Optional: You can verify that the Operator installed successfully by performing the following check:
- Switch to the Operators → Installed Operators page.
Ensure that Bare Metal Event Relay is listed in the project with a Status of InstallSucceeded.
NoteDuring installation an Operator might display a Failed status. If the installation later succeeds with an InstallSucceeded message, you can ignore the Failed message.
If the Operator does not appear as installed, to troubleshoot further:
- Go to the Operators → Installed Operators page and inspect the Operator Subscriptions and Install Plans tabs for any failure or errors under Status.
- Go to the Workloads → Pods page and check the logs for pods in the project namespace.
11.3. Installing the AMQ messaging bus
To pass Redfish bare-metal event notifications between publisher and subscriber on a node, you must install and configure an AMQ messaging bus to run locally on the node. You do this by installing the AMQ Interconnect Operator for use in the cluster.
Prerequisites
-
Install the OpenShift Container Platform CLI (
oc). -
Log in as a user with
cluster-adminprivileges.
Procedure
-
Install the AMQ Interconnect Operator to its own
amq-interconnectnamespace. See Installing the AMQ Interconnect Operator.
Verification
Verify that the AMQ Interconnect Operator is available and the required pods are running:
$ oc get pods -n amq-interconnect
Example output
NAME                                    READY   STATUS    RESTARTS   AGE
amq-interconnect-645db76c76-k8ghs       1/1     Running   0          23h
interconnect-operator-5cb5fc7cc-4v7qm   1/1     Running   0          23h
Verify that the required
bare-metal-event-relaybare-metal event producer pod is running in theopenshift-bare-metal-eventsnamespace:$ oc get pods -n openshift-bare-metal-events
Example output
NAME                                                            READY   STATUS    RESTARTS   AGE
hw-event-proxy-operator-controller-manager-74d5649b7c-dzgtl     2/2     Running   0          25s
11.4. Subscribing to Redfish BMC bare-metal events for a cluster node
As a cluster administrator, you can subscribe to Redfish BMC events generated on a node in your cluster by creating a BMCEventSubscription custom resource (CR) for the node, creating a HardwareEvent CR for the event, and a Secret CR for the BMC.
11.4.1. Subscribing to bare-metal events
You can configure the baseboard management controller (BMC) to send bare-metal events to subscribed applications running in an OpenShift Container Platform cluster. Example Redfish bare-metal events include an increase in device temperature, or removal of a device. You subscribe applications to bare-metal events using a REST API.
You can only create a BMCEventSubscription custom resource (CR) for physical hardware that supports Redfish and has a vendor interface set to redfish or idrac-redfish.
Use the BMCEventSubscription CR to subscribe to predefined Redfish events. The Redfish standard does not provide an option to create specific alerts and thresholds. For example, to receive an alert event when an enclosure’s temperature exceeds 40° Celsius, you must manually configure the event according to the vendor’s recommendations.
Perform the following procedure to subscribe to bare-metal events for the node using a BMCEventSubscription CR.
Prerequisites
-
Install the OpenShift CLI (
oc). -
Log in as a user with
cluster-adminprivileges. - Get the user name and password for the BMC.
Deploy a bare-metal node with a Redfish-enabled Baseboard Management Controller (BMC) in your cluster, and enable Redfish events on the BMC.
NoteEnabling Redfish events on specific hardware is outside the scope of this information. For more information about enabling Redfish events for your specific hardware, consult the BMC manufacturer documentation.
Procedure
Confirm that the node hardware has the Redfish
EventServiceenabled by running the followingcurlcommand:curl https://<bmc_ip_address>/redfish/v1/EventService --insecure -H 'Content-Type: application/json' -u "<bmc_username>:<password>"
where:
- bmc_ip_address
- is the IP address of the BMC where the Redfish events are generated.
Example output
{
   "@odata.context": "/redfish/v1/$metadata#EventService.EventService",
   "@odata.id": "/redfish/v1/EventService",
   "@odata.type": "#EventService.v1_0_2.EventService",
   "Actions": {
      "#EventService.SubmitTestEvent": {
         "EventType@Redfish.AllowableValues": ["StatusChange", "ResourceUpdated", "ResourceAdded", "ResourceRemoved", "Alert"],
         "target": "/redfish/v1/EventService/Actions/EventService.SubmitTestEvent"
      }
   },
   "DeliveryRetryAttempts": 3,
   "DeliveryRetryIntervalSeconds": 30,
   "Description": "Event Service represents the properties for the service",
   "EventTypesForSubscription": ["StatusChange", "ResourceUpdated", "ResourceAdded", "ResourceRemoved", "Alert"],
   "EventTypesForSubscription@odata.count": 5,
   "Id": "EventService",
   "Name": "Event Service",
   "ServiceEnabled": true,
   "Status": {
      "Health": "OK",
      "HealthRollup": "OK",
      "State": "Enabled"
   },
   "Subscriptions": {
      "@odata.id": "/redfish/v1/EventService/Subscriptions"
   }
}
Get the Bare Metal Event Relay service route for the cluster by running the following command:
$ oc get route -n openshift-bare-metal-events
Example output
NAME             HOST/PORT                                                                                           PATH   SERVICES                 PORT   TERMINATION   WILDCARD
hw-event-proxy   hw-event-proxy-openshift-bare-metal-events.apps.compute-1.example.com          hw-event-proxy-service   9087   edge          None
Create a
BMCEventSubscriptionresource to subscribe to the Redfish events:Save the following YAML in the
bmc_sub.yamlfile:apiVersion: metal3.io/v1alpha1 kind: BMCEventSubscription metadata: name: sub-01 namespace: openshift-machine-api spec: hostName: <hostname> 1 destination: <proxy_service_url> 2 context: ''
- 1
- Specifies the name or UUID of the worker node where the Redfish events are generated.
- 2
- Specifies the bare-metal event proxy service, for example,
https://hw-event-proxy-openshift-bare-metal-events.apps.compute-1.example.com/webhook.
Create the
BMCEventSubscriptionCR:$ oc create -f bmc_sub.yaml
Optional: To delete the BMC event subscription, run the following command:
$ oc delete -f bmc_sub.yaml
Optional: To manually create a Redfish event subscription without creating a
BMCEventSubscriptionCR, run the followingcurlcommand, specifying the BMC username and password.$ curl -i -k -X POST -H "Content-Type: application/json" -d '{"Destination": "https://<proxy_service_url>", "Protocol" : "Redfish", "EventTypes": ["Alert"], "Context": "root"}' -u <bmc_username>:<password> 'https://<bmc_ip_address>/redfish/v1/EventService/Subscriptions' –vwhere:
- proxy_service_url
-
is the bare-metal event proxy service, for example,
https://hw-event-proxy-openshift-bare-metal-events.apps.compute-1.example.com/webhook.
- bmc_ip_address
- is the IP address of the BMC where the Redfish events are generated.
Example output
HTTP/1.1 201 Created
Server: AMI MegaRAC Redfish Service
Location: /redfish/v1/EventService/Subscriptions/1
Allow: GET, POST
Access-Control-Allow-Origin: *
Access-Control-Expose-Headers: X-Auth-Token
Access-Control-Allow-Headers: X-Auth-Token
Access-Control-Allow-Credentials: true
Cache-Control: no-cache, must-revalidate
Link: <http://redfish.dmtf.org/schemas/v1/EventDestination.v1_6_0.json>; rel=describedby
Link: <http://redfish.dmtf.org/schemas/v1/EventDestination.v1_6_0.json>
Link: </redfish/v1/EventService/Subscriptions>; path=
ETag: "1651135676"
Content-Type: application/json; charset=UTF-8
OData-Version: 4.0
Content-Length: 614
Date: Thu, 28 Apr 2022 08:47:57 GMT
11.4.2. Querying Redfish bare-metal event subscriptions with curl
Some hardware vendors limit the amount of Redfish hardware event subscriptions. You can query the number of Redfish event subscriptions by using curl.
Prerequisites
- Get the user name and password for the BMC.
- Deploy a bare-metal node with a Redfish-enabled Baseboard Management Controller (BMC) in your cluster, and enable Redfish hardware events on the BMC.
Procedure
Check the current subscriptions for the BMC by running the following
curlcommand:$ curl --globoff -H "Content-Type: application/json" -k -X GET --user <bmc_username>:<password> https://<bmc_ip_address>/redfish/v1/EventService/Subscriptions
where:
- bmc_ip_address
- is the IP address of the BMC where the Redfish events are generated.
Example output
% Total % Received % Xferd Average Speed Time Time Time Current
Dload Upload Total Spent Left Speed
100 435 100 435 0 0 399 0 0:00:01 0:00:01 --:--:-- 399
{
  "@odata.context": "/redfish/v1/$metadata#EventDestinationCollection.EventDestinationCollection",
  "@odata.etag": ""
  1651137375 "",
  "@odata.id": "/redfish/v1/EventService/Subscriptions",
  "@odata.type": "#EventDestinationCollection.EventDestinationCollection",
  "Description": "Collection for Event Subscriptions",
  "Members": [
  {
    "@odata.id": "/redfish/v1/EventService/Subscriptions/1"
  }],
  "Members@odata.count": 1,
  "Name": "Event Subscriptions Collection"
}
In this example, a single subscription is configured:
/redfish/v1/EventService/Subscriptions/1.Optional: To remove the
/redfish/v1/EventService/Subscriptions/1subscription withcurl, run the following command, specifying the BMC username and password:$ curl --globoff -L -w "%{http_code} %{url_effective}\n" -k -u <bmc_username>:<password >-H "Content-Type: application/json" -d '{}' -X DELETE https://<bmc_ip_address>/redfish/v1/EventService/Subscriptions/1where:
- bmc_ip_address
- is the IP address of the BMC where the Redfish events are generated.
11.4.3. Creating the bare-metal event and Secret CRs
To start using bare-metal events, create the HardwareEvent custom resource (CR) for the host where the Redfish hardware is present. Hardware events and faults are reported in the hw-event-proxy logs.
Prerequisites
-
Install the OpenShift CLI (
oc). -
Log in as a user with
cluster-adminprivileges. - Install the Bare Metal Event Relay.
-
Create a
BMCEventSubscriptionCR for the BMC Redfish hardware.
Multiple HardwareEvent resources are not permitted.
Procedure
Create the
HardwareEventcustom resource (CR):Save the following YAML in the
hw-event.yamlfile:apiVersion: "event.redhat-cne.org/v1alpha1" kind: "HardwareEvent" metadata: name: "hardware-event" spec: nodeSelector: node-role.kubernetes.io/hw-event: "" 1 transportHost: "amqp://amq-router-service-name.amq-namespace.svc.cluster.local" 2 logLevel: "debug" 3 msgParserTimeout: "10" 4- 1
- Required. Use the
nodeSelectorfield to target nodes with the specified label, for example,node-role.kubernetes.io/hw-event: "". - 2
- Required. AMQP host that delivers the events at the transport layer using the AMQP protocol.
- 3
- Optional. The default value is
debug. Sets the log level inhw-event-proxylogs. The following log levels are available:fatal,error,warning,info,debug,trace. - 4
- Optional. Sets the timeout value in milliseconds for the Message Parser. If a message parsing request is not responded to within the timeout duration, the original hardware event message is passed to the cloud native event framework. The default value is 10.
Create the
HardwareEventCR:$ oc create -f hardware-event.yaml
Create a BMC username and password
SecretCR that enables the hardware events proxy to access the Redfish message registry for the bare-metal host.Save the following YAML in the
hw-event-bmc-secret.yamlfile:apiVersion: v1 kind: Secret metadata: name: redfish-basic-auth type: Opaque stringData: 1 username: <bmc_username> password: <bmc_password> # BMC host DNS or IP address hostaddr: <bmc_host_ip_address>- 1
- Enter plain text values for the various items under
stringData.
Create the
SecretCR:$ oc create -f hw-event-bmc-secret.yaml
11.5. Subscribing applications to bare-metal events REST API reference
Use the bare-metal events REST API to subscribe an application to the bare-metal events that are generated on the parent node.
Subscribe applications to Redfish events by using the resource address /cluster/node/<node_name>/redfish/event, where <node_name> is the cluster node running the application.
Deploy your cloud-event-consumer application container and cloud-event-proxy sidecar container in a separate application pod. The cloud-event-consumer application subscribes to the cloud-event-proxy container in the application pod.
Use the following API endpoints to subscribe the cloud-event-consumer application to Redfish events posted by the cloud-event-proxy container at http://localhost:8089/api/ocloudNotifications/v1/ in the application pod:
/api/ocloudNotifications/v1/subscriptions-
POST: Creates a new subscription -
GET: Retrieves a list of subscriptions
-
/api/ocloudNotifications/v1/subscriptions/<subscription_id>-
GET: Returns details for the specified subscription ID
-
api/ocloudNotifications/v1/subscriptions/status/<subscription_id>-
PUT: Creates a new status ping request for the specified subscription ID
-
/api/ocloudNotifications/v1/health-
GET: Returns the health status ofocloudNotificationsAPI
-
9089 is the default port for the cloud-event-consumer container deployed in the application pod. You can configure a different port for your application as required.
api/ocloudNotifications/v1/subscriptions
HTTP method
GET api/ocloudNotifications/v1/subscriptions
Description
Returns a list of subscriptions. If subscriptions exist, a 200 OK status code is returned along with the list of subscriptions.
Example API response
[
 {
  "id": "ca11ab76-86f9-428c-8d3a-666c24e34d32",
  "endpointUri": "http://localhost:9089/api/ocloudNotifications/v1/dummy",
  "uriLocation": "http://localhost:8089/api/ocloudNotifications/v1/subscriptions/ca11ab76-86f9-428c-8d3a-666c24e34d32",
  "resource": "/cluster/node/openshift-worker-0.openshift.example.com/redfish/event"
 }
]
HTTP method
POST api/ocloudNotifications/v1/subscriptions
Description
Creates a new subscription. If a subscription is successfully created, or if it already exists, a 201 Created status code is returned.
Table 11.1. Query parameters
| Parameter | Type |
|---|---|
| subscription | data |
Example payload
{
  "uriLocation": "http://localhost:8089/api/ocloudNotifications/v1/subscriptions",
  "resource": "/cluster/node/openshift-worker-0.openshift.example.com/redfish/event"
}
api/ocloudNotifications/v1/subscriptions/<subscription_id>
HTTP method
GET api/ocloudNotifications/v1/subscriptions/<subscription_id>
Description
Returns details for the subscription with ID <subscription_id>
Table 11.2. Query parameters
| Parameter | Type |
|---|---|
|
| string |
Example API response
{
  "id":"ca11ab76-86f9-428c-8d3a-666c24e34d32",
  "endpointUri":"http://localhost:9089/api/ocloudNotifications/v1/dummy",
  "uriLocation":"http://localhost:8089/api/ocloudNotifications/v1/subscriptions/ca11ab76-86f9-428c-8d3a-666c24e34d32",
  "resource":"/cluster/node/openshift-worker-0.openshift.example.com/redfish/event"
}
api/ocloudNotifications/v1/subscriptions/status/<subscription_id>
HTTP method
PUT api/ocloudNotifications/v1/subscriptions/status/<subscription_id>
Description
Creates a new status ping request for subscription with ID <subscription_id>. If a subscription is present, the status request is successful and a 202 Accepted status code is returned.
Table 11.3. Query parameters
| Parameter | Type |
|---|---|
|
| string |
Example API response
{"status":"ping sent"}
api/ocloudNotifications/v1/health/
HTTP method
GET api/ocloudNotifications/v1/health/
Description
Returns the health status for the ocloudNotifications REST API.
Example API response
OK
Chapter 12. Accessing third-party monitoring UIs and APIs
In OpenShift Container Platform 4.10, you cannot access third-party web browser user interfaces (UIs) for the following monitoring components: Alertmanager, Thanos Ruler, and Thanos Querier. However, you can access web UIs for Grafana and Prometheus, although this access is deprecated and is planned to be removed in a future OpenShift Container Platform release. In addition, you can access web service APIs for third-party monitoring components from the command line interface (CLI).
12.1. Accessing third-party monitoring UIs
OpenShift Container Platform does not provide or support direct access to third-party web user interfaces (UIs) for the following components in the monitoring stack: Alertmanager, Thanos Ruler, and Thanos Querier. As an alternative to these third-party UIs, navigate to the Observe section of the OpenShift Container Platform web console to access metrics, alerting, metrics targets, and dashboard UIs for platform components.
Although you can access the third-party Grafana and Prometheus web UIs from the web console or the CLI, this access is deprecated and is planned to be removed in a future OpenShift Container Platform release.
12.2. Accessing third-party monitoring web service APIs
You can directly access third-party web service APIs from the command line for monitoring stack components such as Prometheus, Alertmanager, Thanos Ruler, and Thanos Querier.
The following example shows how to query the service API receivers for Alertmanager. This example requires that the associated user account be bound against the monitoring-alertmanager-edit role in the openshift-monitoring namespace and that the account has the privilege to view the route. This access only supports using a Bearer Token for authentication.
$ host=$(oc -n openshift-monitoring get route alertmanager-main -ojsonpath={.spec.host})
$ token=$(oc whoami -t)
$ curl -H "Authorization: Bearer $token" -k "https://$host/api/v2/receivers"
To access Thanos Ruler and Thanos Querier service APIs, the requesting account must have get permission on the namespaces resource, which can be done by granting the cluster-monitoring-view cluster role to the account.
12.3. Querying metrics by using the federation endpoint for Prometheus
From OpenShift Container Platform 4.10.17, you can use the federation endpoint to scrape platform and user-defined metrics from a network location outside the cluster. To do so, access the Prometheus /federate endpoint for the cluster via an OpenShift Container Platform route.
A delay in retrieving metrics data occurs when you use federation. This delay can affect the accuracy and timeliness of the scraped metrics.
Using the federation endpoint can also degrade the performance and scalability of your cluster, especially if you use the federation endpoint to retrieve large amounts of metrics data. To avoid these issues, follow these recommendations:
- Do not try to retrieve all metrics data via the federation endpoint. Query it only when you want to retrieve a limited, aggregated data set. For example, retrieving fewer than 1,000 samples for each request helps minimize the risk of performance degradation.
- Avoid querying the federation endpoint frequently. Limit queries to a maximum of one every 30 seconds.
If you need to forward large amounts of data outside the cluster, use remote write instead. For more information, see the Configuring remote write storage section.
Prerequisites
-
You have installed the OpenShift CLI (
oc). - You have obtained the host URL for the OpenShift Container Platform route.
You have access to the cluster as a user with the
cluster-monitoring-viewcluster role or have obtained a bearer token withgetpermission on thenamespacesresource.NoteYou can only use bearer token authentication to access the federation endpoint.
Procedure
Retrieve the bearer token:
$ token=`oc whoami -t`
Query metrics from the
/federateroute. The following example queriesupmetrics:$ curl -G -s -k -H "Authorization: Bearer $token" \ 'https:/<federation_host>/federate' \ 1 --data-urlencode 'match[]=up'- 1
- For <federation_host>, substitute the host URL for the federation route.
Example output
# TYPE up untyped
up{apiserver="kube-apiserver",endpoint="https",instance="10.0.143.148:6443",job="apiserver",namespace="default",service="kubernetes",prometheus="openshift-monitoring/k8s",prometheus_replica="prometheus-k8s-0"} 1 1657035322214
up{apiserver="kube-apiserver",endpoint="https",instance="10.0.148.166:6443",job="apiserver",namespace="default",service="kubernetes",prometheus="openshift-monitoring/k8s",prometheus_replica="prometheus-k8s-0"} 1 1657035338597
up{apiserver="kube-apiserver",endpoint="https",instance="10.0.173.16:6443",job="apiserver",namespace="default",service="kubernetes",prometheus="openshift-monitoring/k8s",prometheus_replica="prometheus-k8s-0"} 1 1657035343834
...
12.4. Additional resources
Chapter 13. Troubleshooting monitoring issues
13.2. Determining why Prometheus is consuming a lot of disk space
Developers can create labels to define attributes for metrics in the form of key-value pairs. The number of potential key-value pairs corresponds to the number of possible values for an attribute. An attribute that has an unlimited number of potential values is called an unbound attribute. For example, a customer_id attribute is unbound because it has an infinite number of possible values.
Every assigned key-value pair has a unique time series. The use of many unbound attributes in labels can result in an exponential increase in the number of time series created. This can impact Prometheus performance and can consume a lot of disk space.
You can use the following measures when Prometheus consumes a lot of disk:
- Check the number of scrape samples that are being collected.
- Check the time series database (TSDB) status in the Prometheus UI for more information on which labels are creating the most time series. This requires cluster administrator privileges.
Reduce the number of unique time series that are created by reducing the number of unbound attributes that are assigned to user-defined metrics.
NoteUsing attributes that are bound to a limited set of possible values reduces the number of potential key-value pair combinations.
- Enforce limits on the number of samples that can be scraped across user-defined projects. This requires cluster administrator privileges.
Prerequisites
-
You have access to the cluster as a user with the
cluster-admincluster role. -
You have installed the OpenShift CLI (
oc).
Procedure
- In the Administrator perspective, navigate to Observe → Metrics.
Run the following Prometheus Query Language (PromQL) query in the Expression field. This returns the ten metrics that have the highest number of scrape samples:
topk(10,count by (job)({__name__=~".+"}))Investigate the number of unbound label values assigned to metrics with higher than expected scrape sample counts.
- If the metrics relate to a user-defined project, review the metrics key-value pairs assigned to your workload. These are implemented through Prometheus client libraries at the application level. Try to limit the number of unbound attributes referenced in your labels.
- If the metrics relate to a core OpenShift Container Platform project, create a Red Hat support case on the Red Hat Customer Portal.
Check the TSDB status in the Prometheus UI.
- In the Administrator perspective, navigate to Networking → Routes.
-
Select the
openshift-monitoringproject in the Project list. -
Select the URL in the
prometheus-k8srow to open the login page for the Prometheus UI. - Choose Log in with OpenShift to log in using your OpenShift Container Platform credentials.
- In the Prometheus UI, navigate to Status → TSDB Status.
Additional resources
- See Setting a scrape sample limit for user-defined projects for details on how to set a scrape sample limit and create related alerting rules
- Submitting a support case
Chapter 14. ConfigMap reference for Cluster Monitoring Operator
14.1. Cluster Monitoring configuration reference
Parts of Cluster Monitoring are configurable. The API is accessible through parameters defined in various ConfigMaps.
Depending on which part of the stack you want to configure, edit the following:
-
The configuration of OpenShift Container Platform monitoring components in a ConfigMap called
cluster-monitoring-configin theopenshift-monitoringnamespace. Defined by ClusterMonitoringConfiguration. -
The configuration of components that monitor user-defined projects in a ConfigMap called
user-workload-monitoring-configin theopenshift-user-workload-monitoringnamespace. Defined by UserWorkloadConfiguration.
The configuration file itself is always defined under the config.yaml key within the ConfigMap data.
Not all configuration parameters are exposed. Configuring Cluster Monitoring is optional. If the configuration does not exist or is empty or malformed, defaults are used.
14.2. AdditionalAlertmanagerConfig
14.2.1. Description
AdditionalAlertmanagerConfig defines configuration on how a component should communicate with aditional Alertmanager instances.
14.2.2. Required
-
apiVersion
Appears in: PrometheusK8sConfig, PrometheusRestrictedConfig, ThanosRulerConfig
| Property | Type | Description |
|---|---|---|
| apiVersion | string | APIVersion defines the api version of Alertmanager. |
| bearerToken | BearerToken defines the bearer token to use when authenticating to Alertmanager. | |
| pathPrefix | string | PathPrefix defines the path prefix to add in front of the push endpoint path. |
| scheme | string | Scheme the URL scheme to use when talking to Alertmanagers. |
| staticConfigs | array(string) | StaticConfigs a list of statically configured Alertmanagers. |
| timeout | string | Timeout defines the timeout used when sending alerts. |
| tlsConfig | TLSConfig defines the TLS Config to use for alertmanager connection. |
14.3. AlertmanagerMainConfig
14.3.1. Description
AlertmanagerMainConfig defines configuration related with the main Alertmanager instance.
Appears in: ClusterMonitoringConfiguration
| Property | Type | Description |
|---|---|---|
| enabled | bool | Enabled a boolean flag to enable or disable the main Alertmanager instance under openshift-monitoring default: true |
| enableUserAlertmanagerConfig | bool | EnableUserAlertManagerConfig boolean flag to enable or disable user-defined namespaces to be selected for AlertmanagerConfig lookup, by default Alertmanager only looks for configuration in the namespace where it was deployed to. This will only work if the UWM Alertmanager instance is not enabled. default: false |
| logLevel | string | LogLevel defines the log level for Alertmanager. Possible values are: error, warn, info, debug. default: info |
| nodeSelector | map[string]string | NodeSelector defines which Nodes the Pods are scheduled on. |
| resources | Resources define resources requests and limits for single Pods. | |
| tolerations | array(v1.Toleration) | Tolerations defines the Pods tolerations. |
| volumeClaimTemplate | VolumeClaimTemplate defines persistent storage for Alertmanager. It’s possible to configure storageClass and size of volume. |
14.4. ClusterMonitoringConfiguration
14.4.1. Description
ClusterMonitoringConfiguration defines configuration that allows users to customise the platform monitoring stack through the cluster-monitoring-config ConfigMap in the openshift-monitoring namespace
| Property | Type | Description |
|---|---|---|
| alertmanagerMain | AlertmanagerMainConfig defines configuration related with the main Alertmanager instance. | |
| enableUserWorkload | bool | UserWorkloadEnabled boolean flag to enable monitoring for user-defined projects. |
| k8sPrometheusAdapter | K8sPrometheusAdapter defines configuration related with prometheus-adapter | |
| kubeStateMetrics | KubeStateMetricsConfig defines configuration related with kube-state-metrics agent | |
| prometheusK8s | PrometheusK8sConfig defines configuration related with prometheus | |
| prometheusOperator | PrometheusOperatorConfig defines configuration related with prometheus-operator | |
| openshiftStateMetrics | OpenShiftMetricsConfig defines configuration related with openshift-state-metrics agent | |
| thanosQuerier | ThanosQuerierConfig defines configuration related with the Thanos Querier component |
14.5. K8sPrometheusAdapter
14.5.1. Description
K8sPrometheusAdapter defines configuration related with Prometheus Adapater
Appears in: ClusterMonitoringConfiguration
| Property | Type | Description |
|---|---|---|
| audit | Audit | Audit defines the audit configuration to be used by the prometheus adapter instance. Possible profile values are: "metadata, request, requestresponse, none". default: metadata |
| nodeSelector | map[string]string | NodeSelector defines which Nodes the Pods are scheduled on. |
| tolerations | array(v1.Toleration) | Tolerations defines the Pods tolerations. |
14.6. KubeStateMetricsConfig
14.6.1. Description
KubeStateMetricsConfig defines configuration related with the kube-state-metrics agent.
Appears in: ClusterMonitoringConfiguration
| Property | Type | Description |
|---|---|---|
| nodeSelector | map[string]string | NodeSelector defines which Nodes the Pods are scheduled on. |
| tolerations | array(v1.Toleration) | Tolerations defines the Pods tolerations. |
14.7. OpenShiftStateMetricsConfig
14.7.1. Description
OpenShiftStateMetricsConfig holds configuration related to openshift-state-metrics agent.
Appears in: ClusterMonitoringConfiguration
| Property | Type | Description |
|---|---|---|
| nodeSelector | map[string]string | NodeSelector defines which Nodes the Pods are scheduled on. |
| tolerations | array(v1.Toleration) | Tolerations defines the Pods tolerations. |
14.8. PrometheusK8sConfig
14.8.1. Description
PrometheusK8sConfig holds configuration related to the Prometheus component.
Appears in: ClusterMonitoringConfiguration
| Property | Type | Description |
|---|---|---|
| additionalAlertmanagerConfigs | array(AdditionalAlertmanagerConfig) | AlertmanagerConfigs holds configuration about how the Prometheus component should communicate with aditional Alertmanager instances. default: nil |
| externalLabels | map[string]string | ExternalLabels defines labels to be added to any time series or alerts when communicating with external systems (federation, remote storage, Alertmanager). default: nil |
| logLevel | string | LogLevel defines the log level for Prometheus. Possible values are: error, warn, info, debug. default: info |
| nodeSelector | map[string]string | NodeSelector defines which Nodes the Pods are scheduled on. |
| queryLogFile | string |
QueryLogFile specifies the file to which PromQL queries are logged. Suports both just a filename in which case they will be saved to an emptyDir volume at |
| remoteWrite | array(remotewritespec) | RemoteWrite Holds the remote write configuration, everything from url, authorization to relabeling |
| resources | Resources define resources requests and limits for single Pods. | |
| retention | string | Retention defines the Time duration Prometheus shall retain data for. Must match the regular expression [0-9]+(ms|s|m|h|d|w|y) (milliseconds seconds minutes hours days weeks years). default: 15d |
| tolerations | array(v1.Toleration) | Tolerations defines the Pods tolerations. |
| volumeClaimTemplate | VolumeClaimTemplate defines persistent storage for Prometheus. It’s possible to configure storageClass and size of volume. |
14.9. PrometheusOperatorConfig
14.9.1. Description
PrometheusOperatorConfig holds configuration related to Prometheus Operator.
Appears in: ClusterMonitoringConfiguration, UserWorkloadConfiguration
| Property | Type | Description |
|---|---|---|
| logLevel | string | LogLevel defines the log level for Prometheus Operator. Possible values are: error, warn, info, debug. default: info |
| nodeSelector | map[string]string | NodeSelector defines which Nodes the Pods are scheduled on. |
| tolerations | array(v1.Toleration) | Tolerations defines the Pods tolerations. |
14.10. PrometheusRestrictedConfig
14.10.1. Description
PrometheusRestrictedConfig defines configuration related to the Prometheus component that will monitor user-defined projects.
Appears in: UserWorkloadConfiguration
| Property | Type | Description |
|---|---|---|
| additionalAlertmanagerConfigs | array(additionalalertmanagerconfig) | AlertmanagerConfigs holds configuration about how the Prometheus component should communicate with aditional Alertmanager instances. default: nil |
| enforcedSampleLimit | uint64 | EnforcedSampleLimit defines a global limit on the number of scraped samples that will be accepted. This overrides any SampleLimit set per ServiceMonitor or/and PodMonitor. It is meant to be used by admins to enforce the SampleLimit to keep the overall number of samples/series under the desired limit. Note that if SampleLimit is lower that value will be taken instead. default: 0 |
| enforcedTargetLimit | uint64 | EnforcedTargetLimit defines a global limit on the number of scraped targets. This overrides any TargetLimit set per ServiceMonitor or/and PodMonitor. It is meant to be used by admins to enforce the TargetLimit to keep the overall number of targets under the desired limit. Note that if TargetLimit is lower, that value will be taken instead, except if either value is zero, in which case the non-zero value will be used. If both values are zero, no limit is enforced. default: 0 |
| externalLabels | map[string]string | ExternalLabels defines labels to be added to any time series or alerts when communicating with external systems (federation, remote storage, Alertmanager). default: nil |
| logLevel | string | LogLevel defines the log level for Prometheus. Possible values are: error, warn, info, debug. default: info |
| nodeSelector | map[string]string | NodeSelector defines which Nodes the Pods are scheduled on. |
| queryLogFile | string | QueryLogFile specifies the file to which PromQL queries are logged. Suports both just a filename in which case they will be saved to an emptyDir volume at /var/log/prometheus, if a full path is given an emptyDir volume will be mounted at that location. Relative paths not supported, also not supported writing to linux std streams. default: "" |
| remoteWrite | array(remotewritespec) | RemoteWrite Holds the remote write configuration, everything from url, authorization to relabeling |
| resources | Resources define resources requests and limits for single Pods. | |
| retention | string | Retention defines the Time duration Prometheus shall retain data for. Must match the regular expression [0-9]+(ms|s|m|h|d|w|y) (milliseconds seconds minutes hours days weeks years). default: 15d |
| tolerations | array(v1.Toleration) | Tolerations defines the Pods tolerations. |
| volumeClaimTemplate | VolumeClaimTemplate defines persistent storage for Prometheus. It’s possible to configure storageClass and size of volume. |
14.11. RemoteWriteSpec
14.11.1. Description
RemoteWriteSpec is an almost identical copy of monv1.RemoteWriteSpec but with the BearerToken field removed. In the future other fields might be added here.
14.11.2. Required
-
url
Appears in: PrometheusK8sConfig, PrometheusRestrictedConfig
| Property | Type | Description |
|---|---|---|
| authorization | monv1.SafeAuthorization | Authorization defines the authorization section for remote write |
| basicAuth | BasicAuth defines configuration for basic authentication for the URL. | |
| bearerTokenFile | string | BearerTokenFile defines the file where the bearer token for remote write resides. |
| headers | map[string]string | Headers custom HTTP headers to be sent along with each remote write request. Be aware that headers that are set by Prometheus itself can’t be overwritten. |
| metadataConfig | MetadataConfig configures the sending of series metadata to remote storage. | |
| name | string | Name defines the name of the remote write queue, must be unique if specified. The name is used in metrics and logging in order to differentiate queues. |
| oauth2 | monv1.OAuth2 | OAuth2 configures OAuth2 authentication for remote write. |
| proxyUrl | string | ProxyURL defines an optional proxy URL |
| queueConfig | QueueConfig allows tuning of the remote write queue parameters. | |
| remoteTimeout | string | RemoteTimeout defines the timeout for requests to the remote write endpoint. |
| sigv4 | monv1.Sigv4 | Sigv4 allows to configures AWS’s Signature Verification 4 |
| tlsConfig | TLSConfig defines the TLS configuration to use for remote write. | |
| url | string | URL defines the URL of the endpoint to send samples to. |
| writeRelabelConfigs | array(monv1.RelabelConfig) | WriteRelabelConfigs defines the list of remote write relabel configurations. |
14.12. TLSConfig
14.12.1. Description
TLSConfig configures the options for TLS connections.
14.12.2. Required
-
insecureSkipVerify
Appears in: AdditionalAlertmanagerConfig
| Property | Type | Description |
|---|---|---|
| ca | CA defines the CA cert in the Prometheus container to use for the targets. | |
| cert | Cert defines the client cert in the Prometheus container to use for the targets. | |
| key | Key defines the client key in the Prometheus container to use for the targets. | |
| serverName | string | ServerName used to verify the hostname for the targets. |
| insecureSkipVerify | bool | InsecureSkipVerify disable target certificate validation. |
14.13. ThanosQuerierConfig
14.13.1. Description
ThanosQuerierConfig holds configuration related to Thanos Querier component.
Appears in: ClusterMonitoringConfiguration
| Property | Type | Description |
|---|---|---|
| enableRequestLogging | bool | EnableRequestLogging boolean flag to enable or disable request logging default: false |
| logLevel | string | LogLevel defines the log level for Thanos Querier. Possible values are: error, warn, info, debug. default: info |
| nodeSelector | map[string]string | NodeSelector defines which Nodes the Pods are scheduled on. |
| resources | Resources define resources requests and limits for single Pods. | |
| tolerations | array(v1.Toleration) | Tolerations defines the Pods tolerations. |
14.14. ThanosRulerConfig
14.14.1. Description
ThanosRulerConfig defines configuration for the Thanos Ruler instance for user-defined projects.
Appears in: UserWorkloadConfiguration
| Property | Type | Description |
|---|---|---|
| additionalAlertmanagerConfigs | array(additionalalertmanagerconfig) | AlertmanagerConfigs holds configuration about how the Thanos Ruler component should communicate with aditional Alertmanager instances. default: nil |
| logLevel | string | LogLevel defines the log level for Thanos Ruler. Possible values are: error, warn, info, debug. default: info |
| nodeSelector | map[string]string | NodeSelector defines which Nodes the Pods are scheduled on. |
| resources | Resources define resources requests and limits for single Pods. | |
| retention | string | Retention defines the time duration Thanos Ruler shall retain data for. Must match the regular expression [0-9]+(ms|s|m|h|d|w|y) (milliseconds seconds minutes hours days weeks years). default: 15d |
| tolerations | array(v1.Toleration) | Tolerations defines the Pods tolerations. |
| volumeClaimTemplate | VolumeClaimTemplate defines persistent storage for Thanos Ruler. It’s possible to configure storageClass and size of volume. |
14.15. UserWorkloadConfiguration
14.15.1. Description
UserWorkloadConfiguration defines configuration that allows users to customise the monitoring stack responsible for user-defined projects through the user-workload-monitoring-config ConfigMap in the openshift-user-workload-monitoring namespace
| Property | Type | Description |
|---|---|---|
| prometheus | Prometheus defines configuration for Prometheus component. | |
| prometheusOperator | PrometheusOperator defines configuration for prometheus-operator component. | |
| thanosRuler | ThanosRuler defines configuration for the Thanos Ruler component |