
Chapter 3. Day Two
3.1. Deploying applications on Red Hat OpenShift Service Mesh
When you deploy an application into the Service Mesh, there are several differences between the behavior of applications in the upstream community version of Istio and the behavior of applications within a Red Hat OpenShift Service Mesh installation.
Prerequisites
3.1.1. Creating control plane templates
You can create reusable configurations with ServiceMeshControlPlane templates. Individual users can extend the templates you create with their own configurations. Templates can also inherit configuration information from other templates. For example, you can create an accounting control plane for the accounting team and a marketing control plane for the marketing team. If you create a development template and a production template, members of the marketing team and the accounting team can extend the development and production templates with team specific customization.
When you configure control plane templates, which follow the same syntax as the ServiceMeshControlPlane, users inherit settings in a hierarchical fashion. The Operator is delivered with a default template with default settings for Red Hat OpenShift Service Mesh. To add custom templates you must create a ConfigMap named smcp-templates in the openshift-operators project and mount the ConfigMap in the Operator container at /usr/local/share/istio-operator/templates.
3.1.1.1. Creating the ConfigMap
Follow this procedure to create the ConfigMap.
Prerequisites
- An installed, verified Service Mesh Operator.
- An account with cluster administrator access.
- Location of the Operator deployment.
-
Access to the OpenShift Container Platform Command-line Interface (CLI) also known as
oc.
Procedure
- Log in to the OpenShift Container Platform CLI as a cluster administrator.
From the CLI, run this command to create the ConfigMap named
smcp-templatesin theopenshift-operatorsproject and replace<templates-directory>with the location of theServiceMeshControlPlanefiles on your local disk:$ oc create configmap --from-file=<templates-directory> smcp-templates -n openshift-operators
Locate the Operator ClusterServiceVersion name.
$ oc get clusterserviceversion -n openshift-operators | grep 'Service Mesh'
maistra.v1.0.0            Red Hat OpenShift Service Mesh   1.0.0                Succeeded
Edit the Operator cluster service version to instruct the Operator to use the
smcp-templatesConfigMap.$ oc edit clusterserviceversion -n openshift-operators maistra.v1.0.0
Add a volume mount and volume to the Operator deployment.
deployments: - name: istio-operator spec: template: spec: containers: volumeMounts: - name: discovery-cache mountPath: /home/istio-operator/.kube/cache/discovery - name: smcp-templates mountPath: /usr/local/share/istio-operator/templates/ volumes: - name: discovery-cache emptyDir: medium: Memory - name: smcp-templates configMap: name: smcp-templates ...- Save your changes and exit the editor.
You can now use the
templateparameter in theServiceMeshControlPlaneto specify a template.apiVersion: maistra.io/v1 kind: ServiceMeshControlPlane metadata: name: minimal-install spec: template: default
3.1.2. Red Hat OpenShift Service Mesh's sidecar injection
Red Hat OpenShift Service Mesh relies on a proxy sidecar within the application’s pod to provide Service Mesh capabilities to the application. You can enable automatic sidecar injection or manage it manually. Red Hat recommends automatic injection using the annotation with no need to label projects. This ensures that your application contains the appropriate configuration for the Service Mesh upon deployment. This method requires fewer privileges and does not conflict with other OpenShift capabilities such as builder pods.
The upstream version of Istio injects the sidecar by default if you have labeled the project. Red Hat OpenShift Service Mesh requires you to opt in to having the sidecar automatically injected to a deployment, so you are not required to label the project. This avoids injecting a sidecar if it is not wanted (for example, in build or deploy pods).
The webhook checks the configuration of pods deploying into all projects to see if they are opting in to injection with the appropriate annotation.
3.1.2.1. Enabling automatic sidecar injection
When deploying an application into the Red Hat OpenShift Service Mesh you must opt in to injection by specifying the sidecar.istio.io/inject annotation with a value of "true". Opting in ensures that the sidecar injection does not interfere with other OpenShift features such as builder pods used by numerous frameworks within the OpenShift ecosystem.
Prerequisites
- Identify the deployments for which you want to enable automatic sidecar injection.
- Locate the application’s YAML configuration file.
Procedure
- Open the application’s configuration YAML file in an editor.
Add
sidecar.istio.io/injectto the configuration YAML with a value of"true"as illustrated here:Sleep test application example
apiVersion: extensions/v1beta1 kind: Deployment metadata: name: sleep spec: replicas: 1 template: metadata: annotations: sidecar.istio.io/inject: "true" labels: app: sleep spec: containers: - name: sleep image: tutum/curl command: ["/bin/sleep","infinity"] imagePullPolicy: IfNotPresent- Save the configuration file.
3.1.3. Updating Mixer policy enforcement
In previous versions of Red Hat OpenShift Service Mesh, Mixer’s policy enforcement was enabled by default. Mixer policy enforcement is now disabled by default. You must enable it before running policy tasks.
Prerequisites
-
Access to the OpenShift Container Platform Command-line Interface (CLI) also known as
oc.
Procedure
- Log in to the OpenShift Container Platform CLI.
Run this command to check the current Mixer policy enforcement status:
$ oc get cm -n istio-system istio -o jsonpath='{.data.mesh}' | grep disablePolicyChecksIf
disablePolicyChecks: true, edit the Service Mesh ConfigMap:$ oc edit cm -n istio-system istio
-
Locate
disablePolicyChecks: truewithin the ConfigMap and change the value tofalse. - Save the configuration and exit the editor.
-
Re-check the Mixer policy enforcement status to ensure it is set to
false.
Next steps
- Deploy Bookinfo on Red Hat OpenShift Service Mesh.
3.2. Configuring your service mesh for distributed tracing
This section describes configuration that is performed in the CRD or in the CR file.
Prerequisites
- Access to an OpenShift Container Platform cluster with cluster-admin user privileges.
- Elasticsearch operator has been installed on the cluster
- Jaeger operator has been installed on the cluster.
3.2.1. Configuring the Elasticsearch index cleaner job
When the Service Mesh Operator creates the ServiceMeshControlPlane it also creates the custom resource (CR) for Jaeger. The Jaeger operator then uses this CR when creating Jaeger instances.
When using Elasticsearch storage, by default a job is created to clean old traces from it. To configure the options for this job, you edit the Jaeger custom resource (CR), to customize it for your use case. The relevant options are listed below.
  apiVersion: jaegertracing.io/v1
  kind: Jaeger
  spec:
    strategy: production
    storage:
      type: elasticsearch
      esIndexCleaner:
        enabled: false
        numberOfDays: 7
        schedule: "55 23 * * *"
Table 3.1. Elasticsearch index cleaner parameters
| Parameter | Values | Description |
|---|---|---|
| enabled | true/ false | Enable or disable the index cleaner job. |
| numberOfDays | integer value | Number of days to wait before deleting an index. |
| schedule | "55 23 * * *" | Cron expression for the job to run |
3.3. Example Application
The Bookinfo example application allows you to test your Red Hat OpenShift Service Mesh 1.0.10 installation on OpenShift Container Platform.
Red Hat does not provide support for the Bookinfo application.
3.3.1. Bookinfo application
The upstream Istio project has an example tutorial called Bookinfo, which is composed of four separate microservices used to demonstrate various Istio features. The Bookinfo application displays information about a book, similar to a single catalog entry of an online book store. Displayed on the page is a description of the book, book details (ISBN, number of pages, and other information), and book reviews.
The Bookinfo application consists of these microservices:
-
The
productpagemicroservice calls thedetailsandreviewsmicroservices to populate the page. -
The
detailsmicroservice contains book information. -
The
reviewsmicroservice contains book reviews. It also calls theratingsmicroservice. -
The
ratingsmicroservice contains book ranking information that accompanies a book review.
There are three versions of the reviews microservice:
-
Version v1 does not call the
ratingsService. -
Version v2 calls the
ratingsService and displays each rating as one to five black stars. -
Version v3 calls the
ratingsService and displays each rating as one to five red stars.
3.3.2. Installing the Bookinfo application
This tutorial walks you through creating a Bookinfo project, deploying the Bookinfo application, and running Bookinfo on OpenShift Container Platform with Service Mesh 1.0.10.
Prerequisites:
- OpenShift Container Platform 4.1 or higher installed.
- Red Hat OpenShift Service Mesh 1.0.10 installed.
-
Access to the OpenShift Container Platform Command-line Interface (CLI) also known as
oc.
Red Hat OpenShift Service Mesh implements auto-injection differently than the upstream Istio project, therefore this procedure uses a version of the bookinfo.yaml file annotated to enable automatic injection of the Istio sidecar for Red Hat OpenShift Service Mesh.
Procedure
- Log in to the OpenShift Container Platform web console as a user with cluster-admin rights.
- Click to Home → Projects.
- Click Create Project.
Enter
bookinfoas the Project Name, enter a Display Name, and enter a Description, then click Create.Alternatively, you can run this command from the CLI to create the
bookinfoproject.$ oc new-project bookinfo
- Click Catalog → Installed Operators.
-
Click the Project menu and use the control plane namespace. In this example, use
istio-system. - Click the Red Hat OpenShift Service Mesh Operator.
Click the Istio Service Mesh Member Roll link.
- If you have already created a Istio Service Mesh Member Roll, click the name, then click the YAML tab to open the YAML editor.
If you have not created a Istio Service Mesh Member Roll, click Create Service Mesh Member Roll.
NoteYou need cluster-admin rights to edit the Istio Service Mesh Member Roll.
Edit the default Service Mesh Member Roll YAML and add
bookinfoto the members list.Bookinfo ServiceMeshMemberRoll example
  apiVersion: maistra.io/v1
  kind: ServiceMeshMemberRoll
  metadata:
    name: default
  spec:
    members:
    - bookinfo
Alternatively, you can run this command from the CLI to add the
bookinfoproject to theServiceMeshMemberRoll. Replace<control plane project>with the name of your control plane project.$ oc -n <control plane project> patch --type='json' smmr default -p '[{"op": "add", "path": "/spec/members", "value":["'"bookinfo"'"]}]'
- Click Create to save the updated Service Mesh Member Roll.
From the CLI, deploy the Bookinfo application in the `bookinfo` project by applying the
bookinfo.yamlfile:$ oc apply -n bookinfo -f https://raw.githubusercontent.com/Maistra/bookinfo/maistra-1.0/bookinfo.yaml
Create the ingress gateway by applying the
bookinfo-gateway.yamlfile:$ oc apply -n bookinfo -f https://raw.githubusercontent.com/Maistra/bookinfo/maistra-1.0/bookinfo-gateway.yaml
Set the value for the
GATEWAY_URLparameter:NoteReplace
<control_plane_project>with the name of your control plane project.$ export GATEWAY_URL=$(oc -n <control_plane_project> get route istio-ingressgateway -o jsonpath='{.spec.host}')
3.3.3. Adding default destination rules
Before you can use the Bookinfo application, you have to add default destination rules. There are two preconfigured YAML files, depending on whether or not you enabled mutual transport layer security (TLS) authentication.
Procedure
To add destination rules, run one of the following commands:
If you did not enable mutual TLS:
$ oc apply -n bookinfo -f https://raw.githubusercontent.com/istio/istio/release-1.1/samples/bookinfo/networking/destination-rule-all.yaml
If you enabled mutual TLS:
$ oc apply -n bookinfo -f https://raw.githubusercontent.com/istio/istio/release-1.1/samples/bookinfo/networking/destination-rule-all-mtls.yaml
3.3.4. Verifying the Bookinfo installation
Before configuring your application, verify that it successfully deployed.
Prerequisites
- OpenShift Container Platform 4.1 or higher installed.
- Red Hat OpenShift Service Mesh 1.0.10 installed.
-
Access to the OpenShift Container Platform Command-line Interface (CLI) also known as
oc.
Procedure
- Log in to the OpenShift Container Platform CLI.
Run this command to confirm that Bookinfo is deployed:
$ curl -o /dev/null -s -w "%{http_code}\n" http://$GATEWAY_URL/productpage-
Alternatively, you can open
http://$GATEWAY_URL/productpagein your browser. You can also verify that all pods are ready with this command:
$ oc get pods -n bookinfo
-
Alternatively, you can open
3.3.5. Removing the Bookinfo application
Follow these steps to remove the Bookinfo application.
Prerequisites
- OpenShift Container Platform 4.1 or higher installed.
- Red Hat OpenShift Service Mesh 1.0.10 installed.
-
Access to the OpenShift Container Platform Command-line Interface (CLI) also known as
oc.
3.3.5.1. Delete the Bookinfo project
Procedure
- Log in to the OpenShift Container Platform web console.
- Click to Home → Projects.
-
Click on the
bookinfomenu , and then click Delete Project.
Type
bookinfoin the confirmation dialog box, and then click Delete.Alternatively, you can run this command from the CLI to create the
bookinfoproject.$ oc delete project bookinfo
3.3.5.2. Remove the Bookinfo project from the Service Mesh member roll
Procedure
- Log in to the OpenShift Container Platform web console.
- Click Catalog → Installed Operators.
-
Click the Project menu and choose
openshift-operatorsfrom the list. - Click the Istio Service Mesh Member Roll link under Provided APIS for the Red Hat OpenShift Service Mesh Operator.
-
Click the
ServiceMeshMemberRollmenu
and select Edit Service Mesh Member Roll.
Edit the default Service Mesh Member Roll YAML and remove
bookinfofrom the members list.Alternatively, you can run this command from the CLI to remove the
bookinfoproject from theServiceMeshMemberRoll. Replace<control plane project>with the name of your control plane project.$ oc -n <control plane project> patch --type='json' smmr default -p '[{"op": "remove", "path": "/spec/members", "value":["'"bookinfo"'"]}]'
- Click Save to update Service Mesh Member Roll.
3.4. Kiali tutorial
Kiali works with Istio to visualize your service mesh topology to provide visibility into features like circuit breakers, request rates, and more. Kiali offers insights about the mesh components at different levels, from abstract Applications to Services and Workloads. Kiali provides an interactive graph view of your Namespace in real time. It can display the interactions at several levels (applications, versions, workloads) with contextual information and charts on the selected graph node or edge.
This tutorial uses Service Mesh and the Bookinfo tutorial to demonstrate how you can use the Kiali console to view the topography and health of your service mesh.
The Bookinfo example application allows you to test your Red Hat OpenShift Service Mesh 1.0.10 installation on OpenShift Container Platform.
Red Hat does not provide support for the Bookinfo application.
3.4.1. Accessing the Kiali console
The Kiali console provides visualization and observability for your Service Mesh. The Kiali console has different views that provide insights into Service Mesh components at different levels, from Applications to Services to Workloads. It also provides validation for Istio configurations.
Prerequisites
- OpenShift Container Platform 4.1 or higher installed.
- Red Hat OpenShift Service Mesh 1.0.10 installed.
- Kiali enabled during the installation.
- Bookinfo demonstration application installed.
The installation process creates a route to access the Kiali console.
Procedure from the console
- In the OpenShift Container Platform console, navigate to Networking → Routes and search for the Kiali route.
Click the URL listed under Location.
The default login strategy is
openshiftwhich means that you should be automatically logged into the Kiali console using the same user name and password as you use to access the OpenShift Container Platform console. When you first log in you see the Overview page, which provides a quick overview of the health of the various Namespaces that are part of your Service Mesh.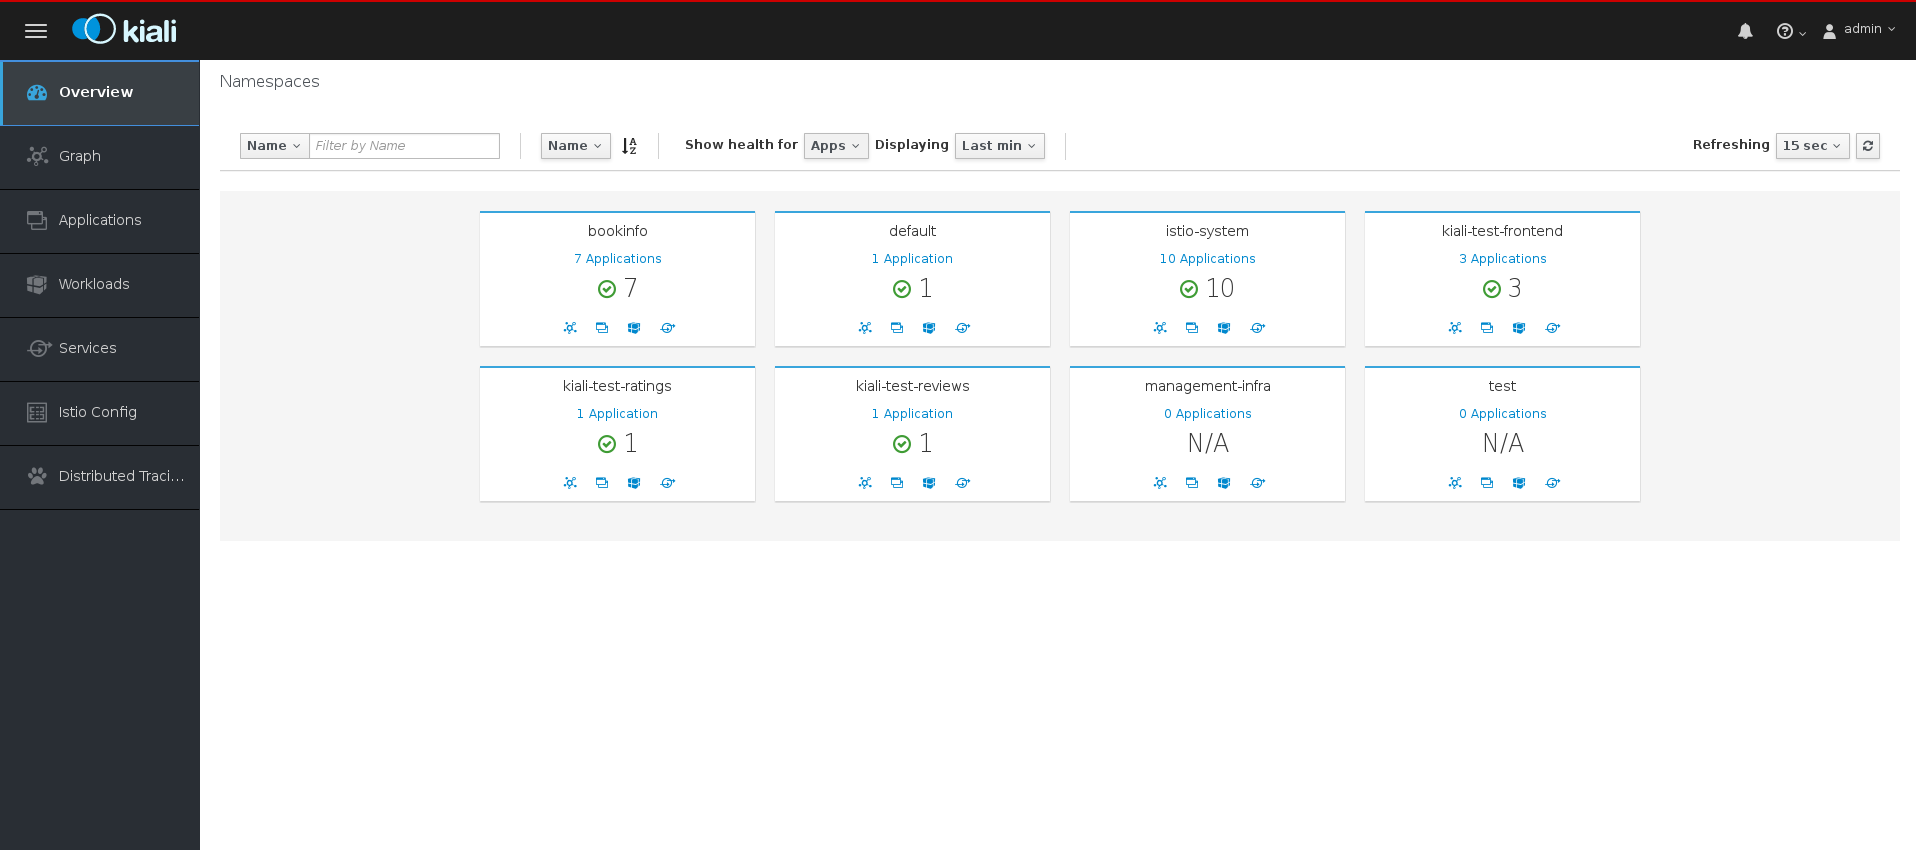
- Use the left navigation or click one of the Namespace icons to view your Applications, Workloads, or Services.
Procedure from the CLI
Run this command from the CLI to obtain the route and Kiali URL:
$ oc get routes
Sample CLI output showing routes
NAME                   HOST/PORT                                                PATH      SERVICES               PORT              TERMINATION   WILDCARD
grafana                grafana-openshift-operators.127.0.0.1.nip.io                          grafana                http                            None
istio-ingress          istio-ingress-openshift-operators.127.0.0.1.nip.io                    istio-ingress          http                            None
istio-ingressgateway   istio-ingressgateway-openshift-operators.127.0.0.1.nip.io             istio-ingressgateway   http                            None
jaeger-query           jaeger-query-openshift-operators.127.0.0.1.nip.io                     jaeger-query           jaeger-query      edge          None
kiali                  kiali-openshift-operators.127.0.0.1.nip.io                            kiali                  <all>                           None
prometheus             prometheus-openshift-operators.127.0.0.1.nip.io                       prometheus             http-prometheus                 None
tracing                tracing-openshift-operators.127.0.0.1.nip.io                          tracing                tracing           edge          None
-
Launch a browser and navigate to https://<KIALI_URL> (in the CLI output example, this is
kiali-openshift-operators.127.0.0.1.nip.io). You should see the Kiali console login screen. - Log in to the Kiali console using the user name and password that you use when logging into the OpenShift Container Platform console.
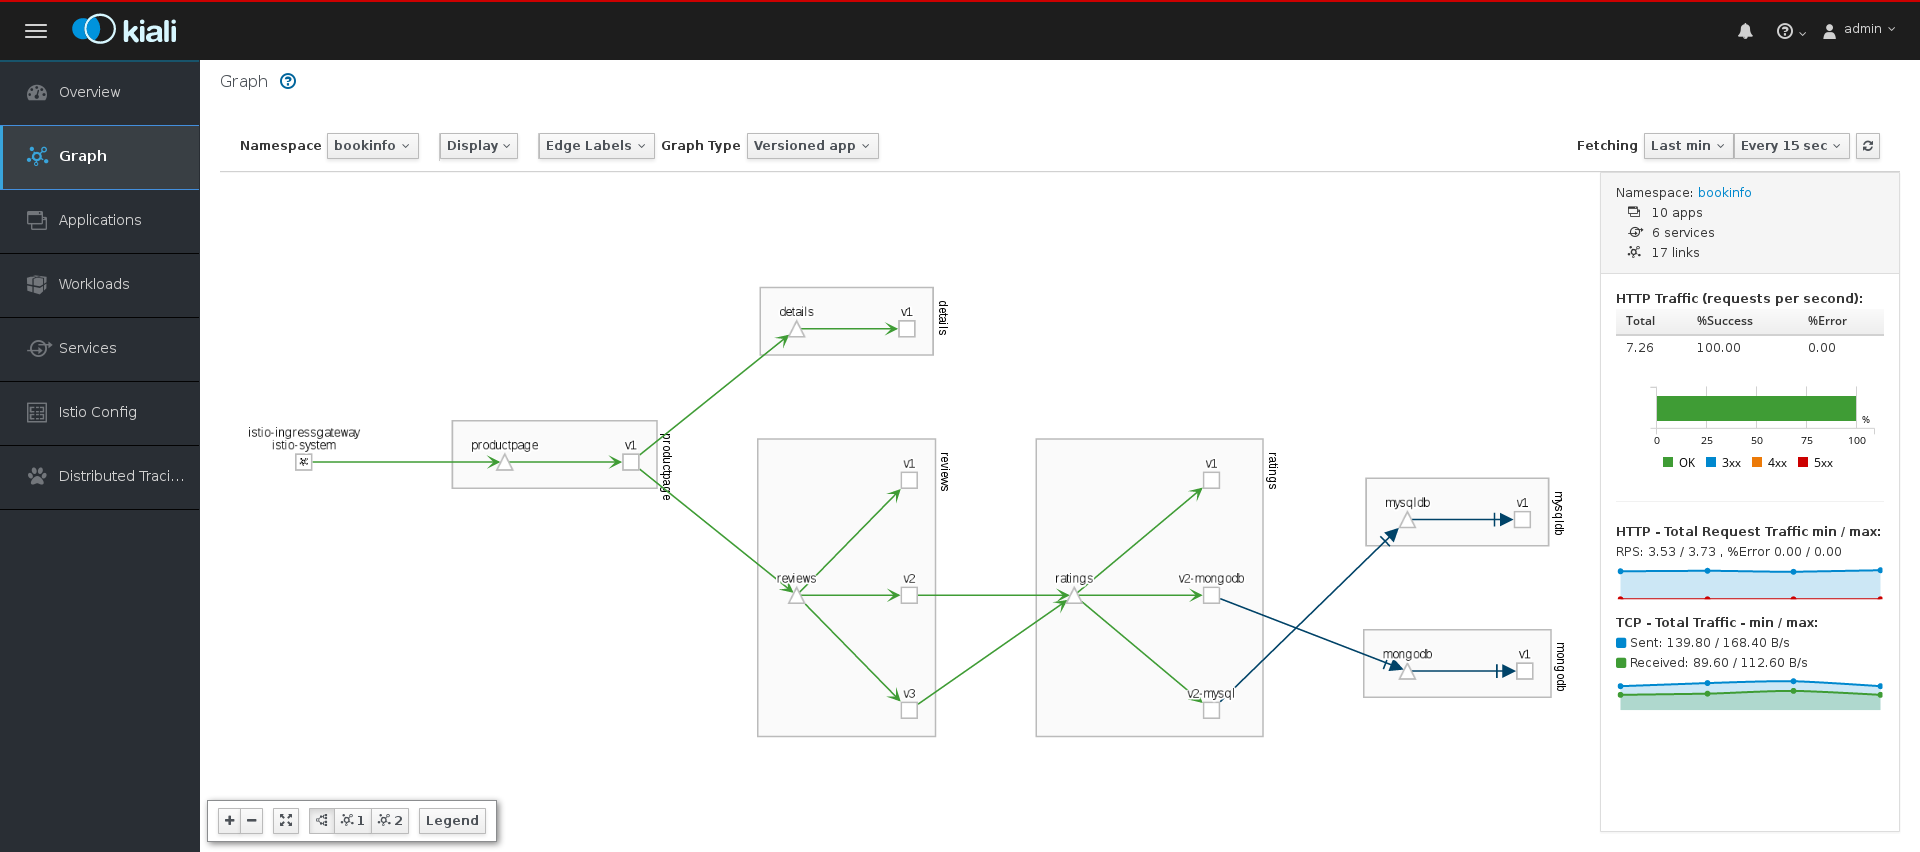
3.4.2. Exploring the Graph page
The Graph page shows a graph of microservices, which are connected by the requests going through them. On this page, you can see how Applications, Workloads, or Services interact with each other.
Procedure
In the Kiali console, click Graph in the left navigation.
-
If necessary, select
bookinfofrom the Namespace menu. The graph displays the applications in the Bookinfo application. - Click the question mark (?) under the Namespace menu to take the Graph Help Tour.
- Click Done to close the Help Tour.
Click Legend in the lower left corner. Kiali displays the graph legend.
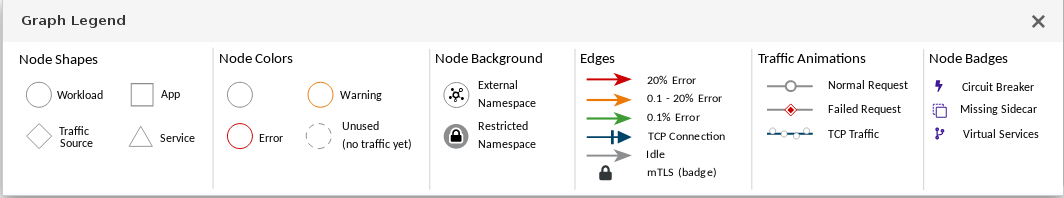
- Close the Graph Legend.
- Hover over the productpage Node. Note how the graph highlights only the incoming and outgoing traffic from the Node.
- Click the productpage Node. Note how the details on the right side of the page change to display the productpage details.
3.4.3. Exploring the Applications page
The Applications page lets you search for and view applications, their health, and other details.
Procedure
- In the Kiali console, click Applications in the left navigation.
-
If necessary, select
bookinfofrom the Namespace menu. The page displays the applications in the selected Namespace and their health. - Hover over the Health icon to view additional health details.
Click the
reviewsService to view the details for that application.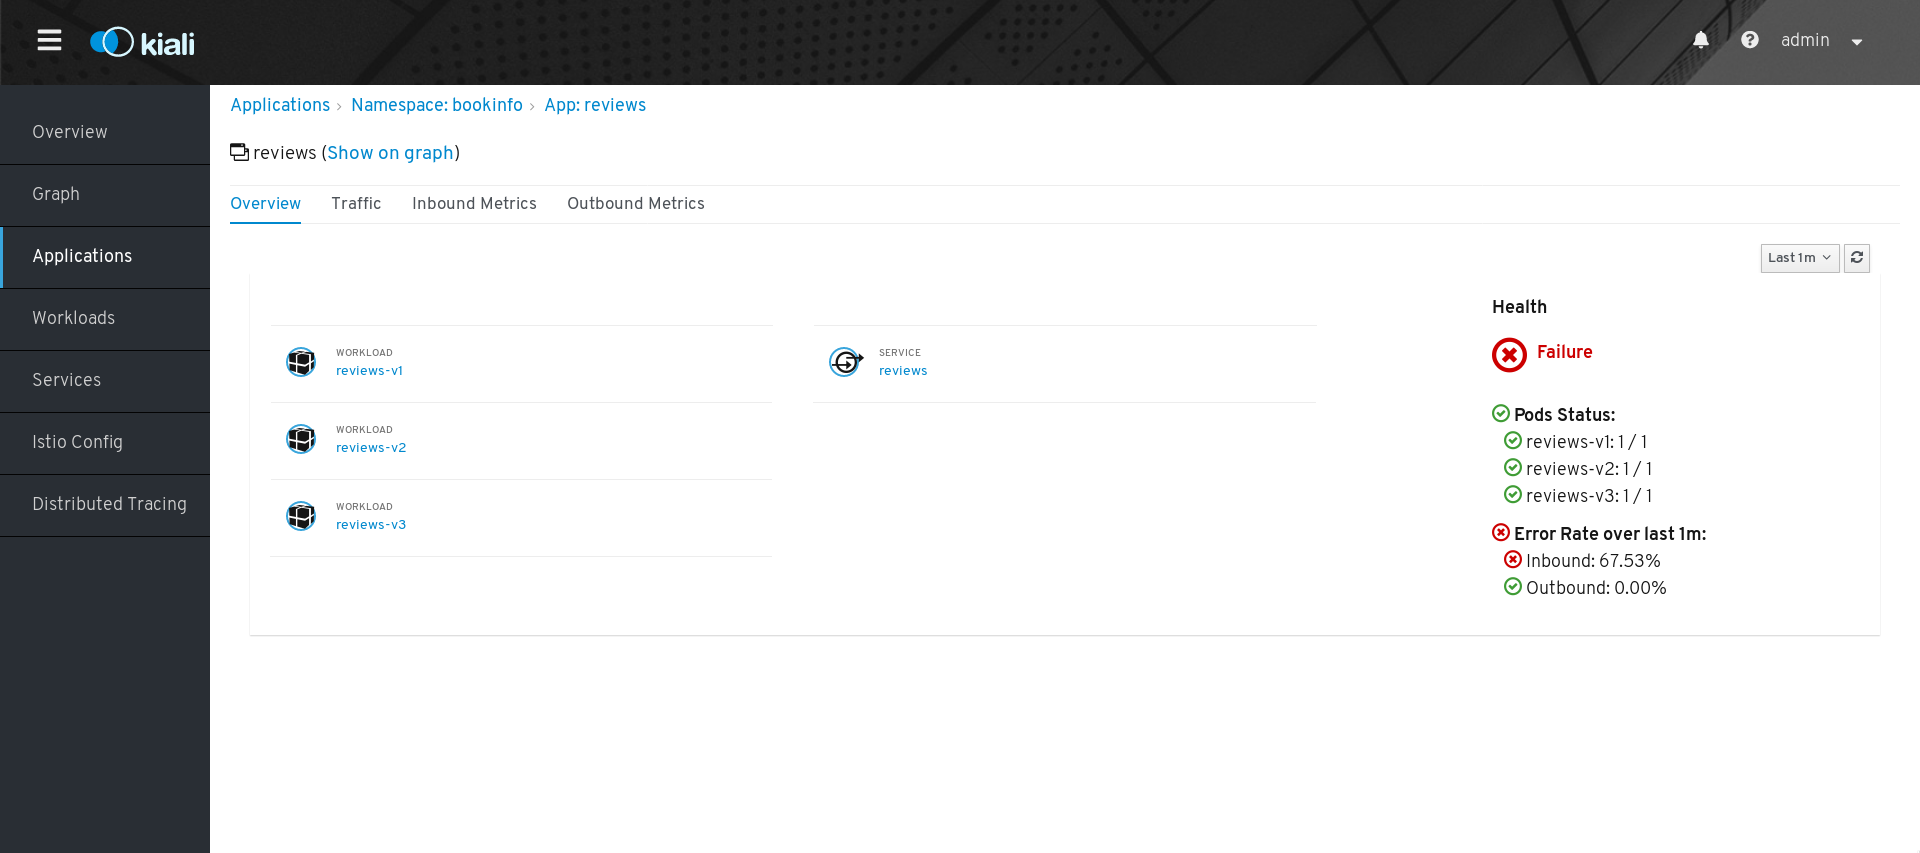
-
On the Applications Details page you can view more detailed health information, and drill down for further details about the three versions of the
reviewsService. - From the Application Details page you can also click tabs to view Traffic and Inbound and Outbound Metrics for the application.
3.4.4. Exploring the Workloads page
The Workloads page lets you search for and view Workloads, their health, and other details.
Procedure
- In the Kiali console, click Workloads in the left navigation.
-
If necessary, select
bookinfofrom the Namespace menu. The page displays the Workloads in the selected Namespace, their health, and labels. -
Click the
reviews-v1Workload to view the details for that Workload. On the Workload Details page you can view an overview of Pods and Services associated with the Workload.
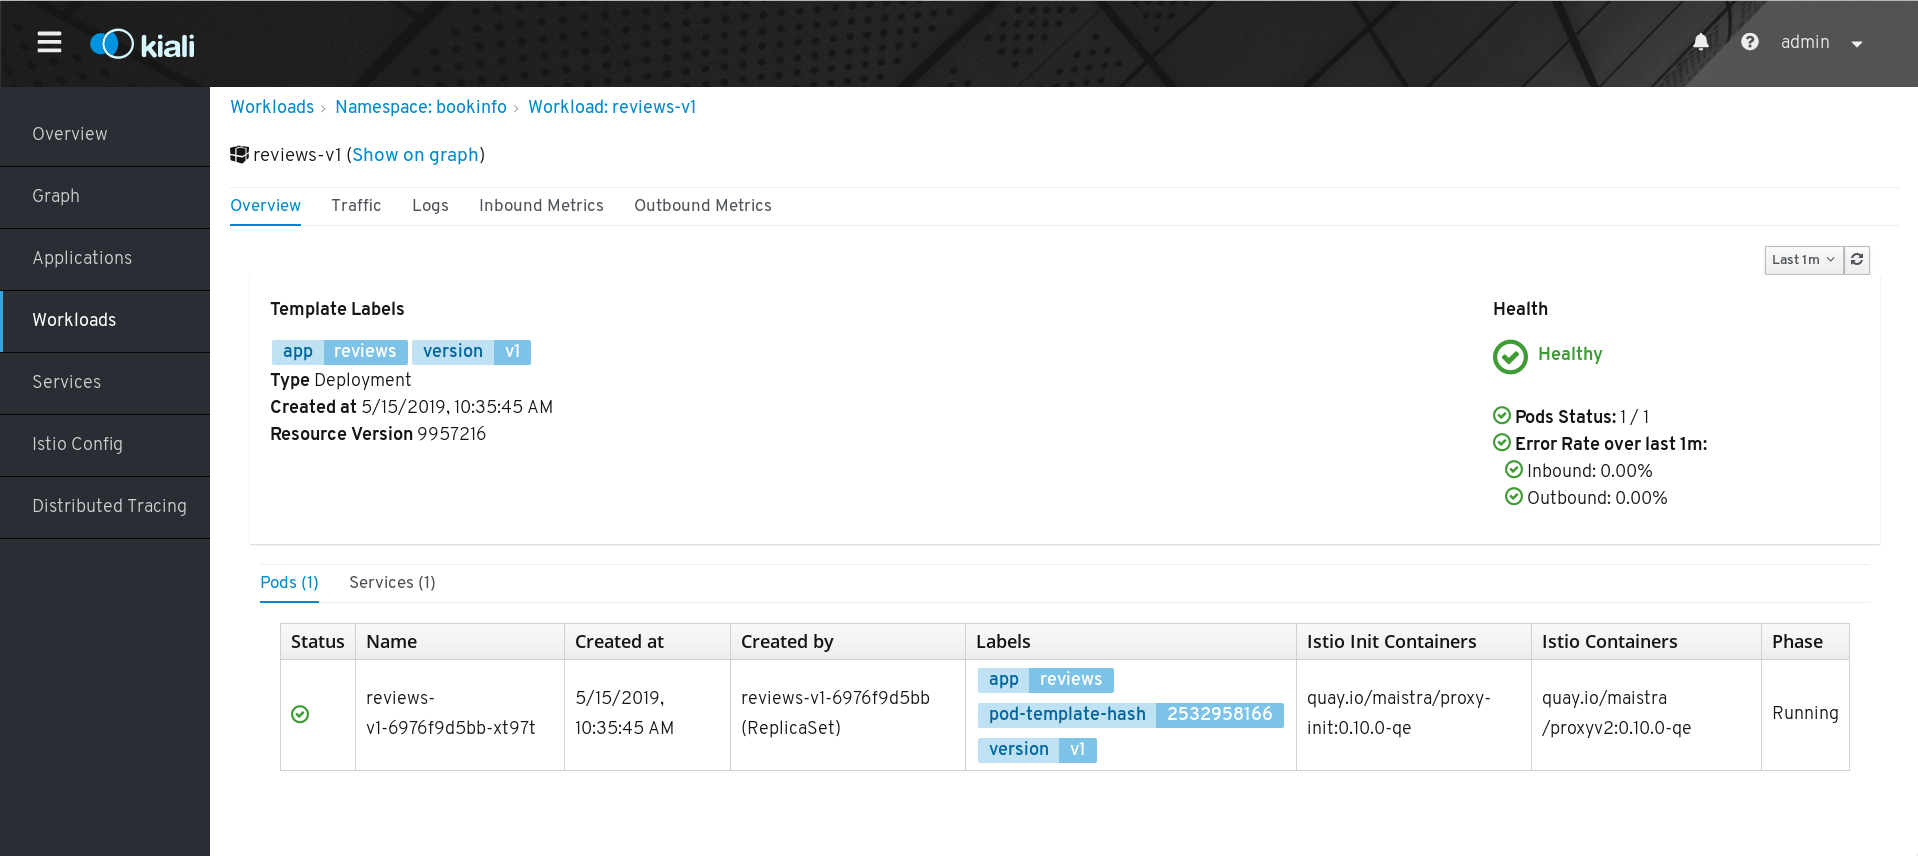
- From the Workload Details page you can also click tabs to view Traffic, Logs, and Inbound and Outbound Metrics for the Workload.
3.4.5. Exploring the Services page
The Services page lets you search for and view Services, their health, and other details.
Procedure
- In the Kiali console, click Services in the left navigation.
-
If necessary, select
bookinfofrom the Namespace menu. The page displays a listing of all the Services that are running in the selected Namespace and additional information about them, such as health status. - Hover over the health icon for any of the Services to view health information about the Service. A Service is considered healthy when it is online and responding to requests without errors.
Click the Reviews Service to view its details. Note that there are three different versions of this Service.
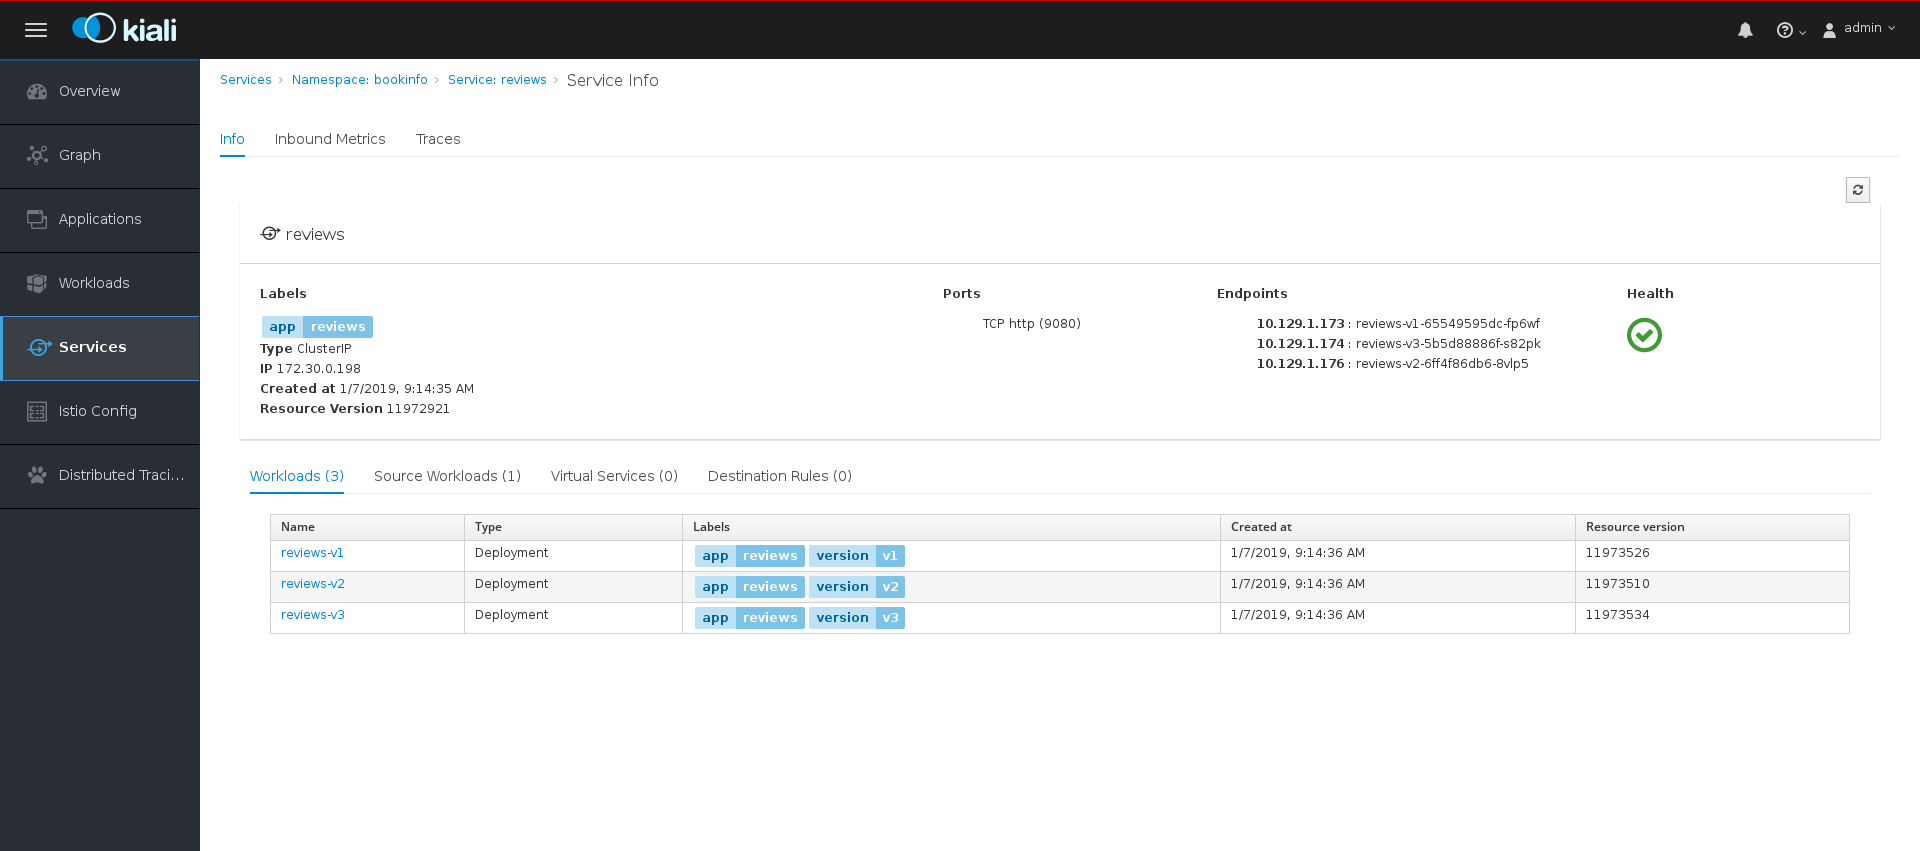
- On the Services Details page you can view an overview of Workloads, virtual Services, and destination rules associated with the Service.
- From the Services Details page you can also click tabs to view Traffic, Inbound Metrics, and Traces for the Service.
Click the Actions menu. From here you can perform the following actions:
- Create Weighted Routing
- Create Matching Routing
- Suspend Traffic
- Delete ALL Traffic Routing
- Click the name of one of the Services to view additional details about that specific version of the Service.
3.4.6. Exploring the Istio Config page
The Istio Config page lets you view all of the currently running configurations to your Service Mesh, such as Circuit Breakers, Destination Rules, Fault Injection, Gateways, Routes, Route Rules, and Virtual Services.
Procedure
- In the Kiali console, click Istio Config in the left navigation.
If necessary, select
bookinfofrom the Namespace menu. The page displays a listing of configurations running in the selected Namespace and validation status.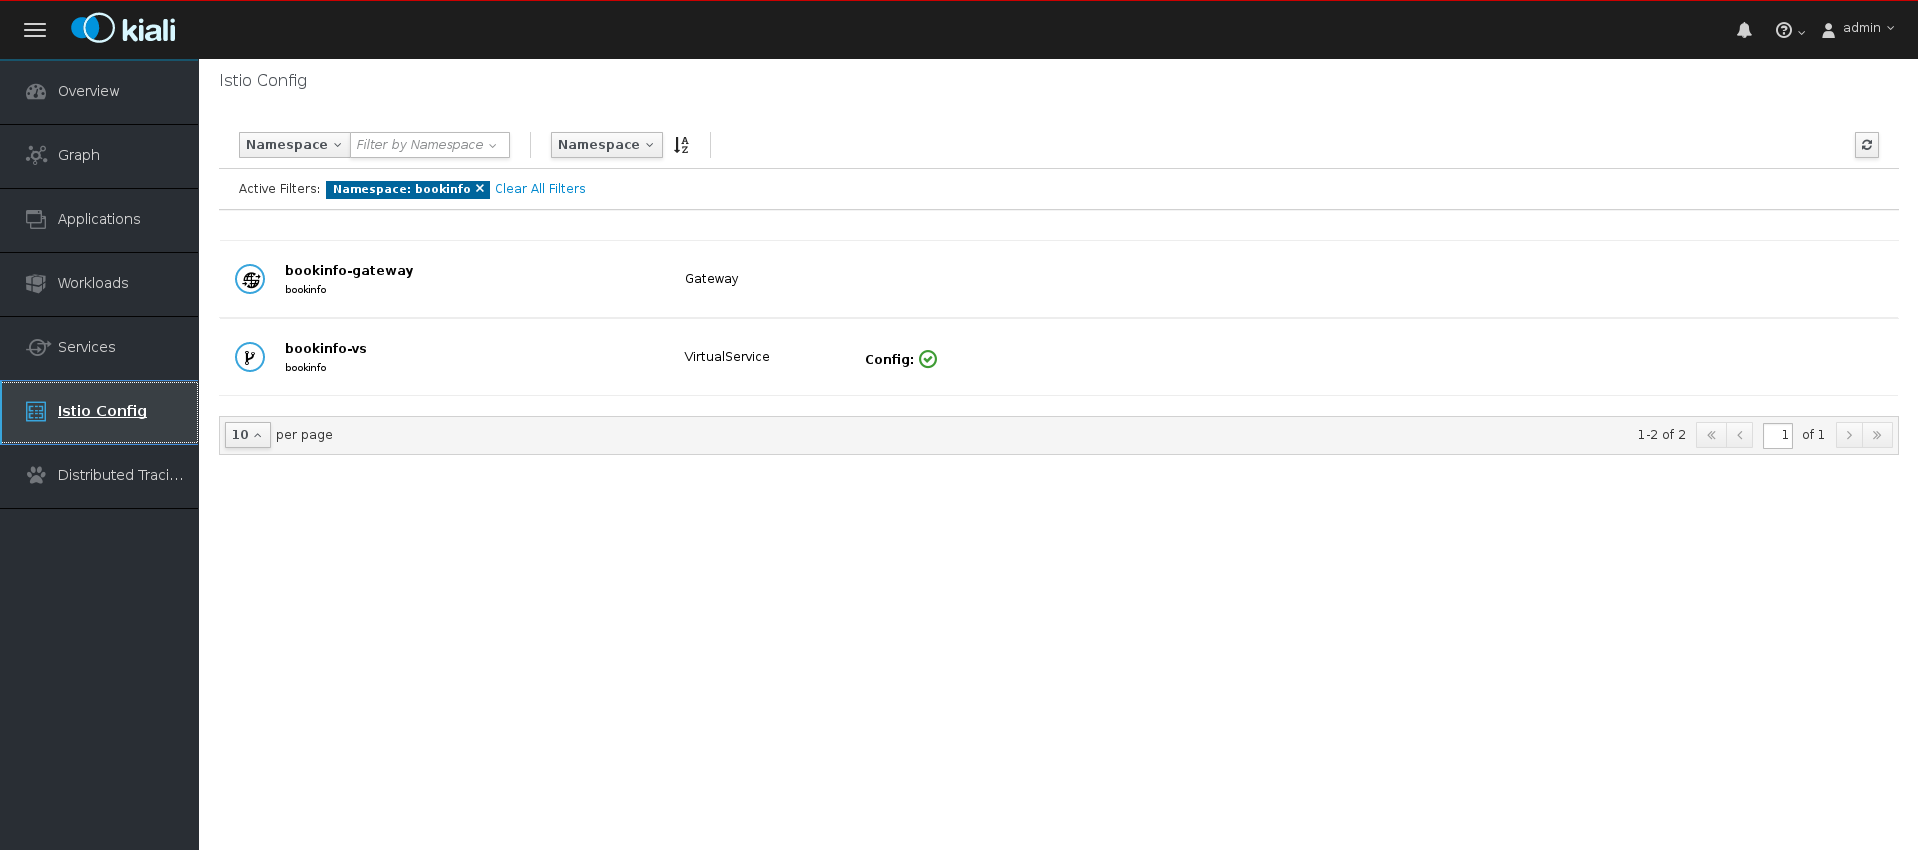
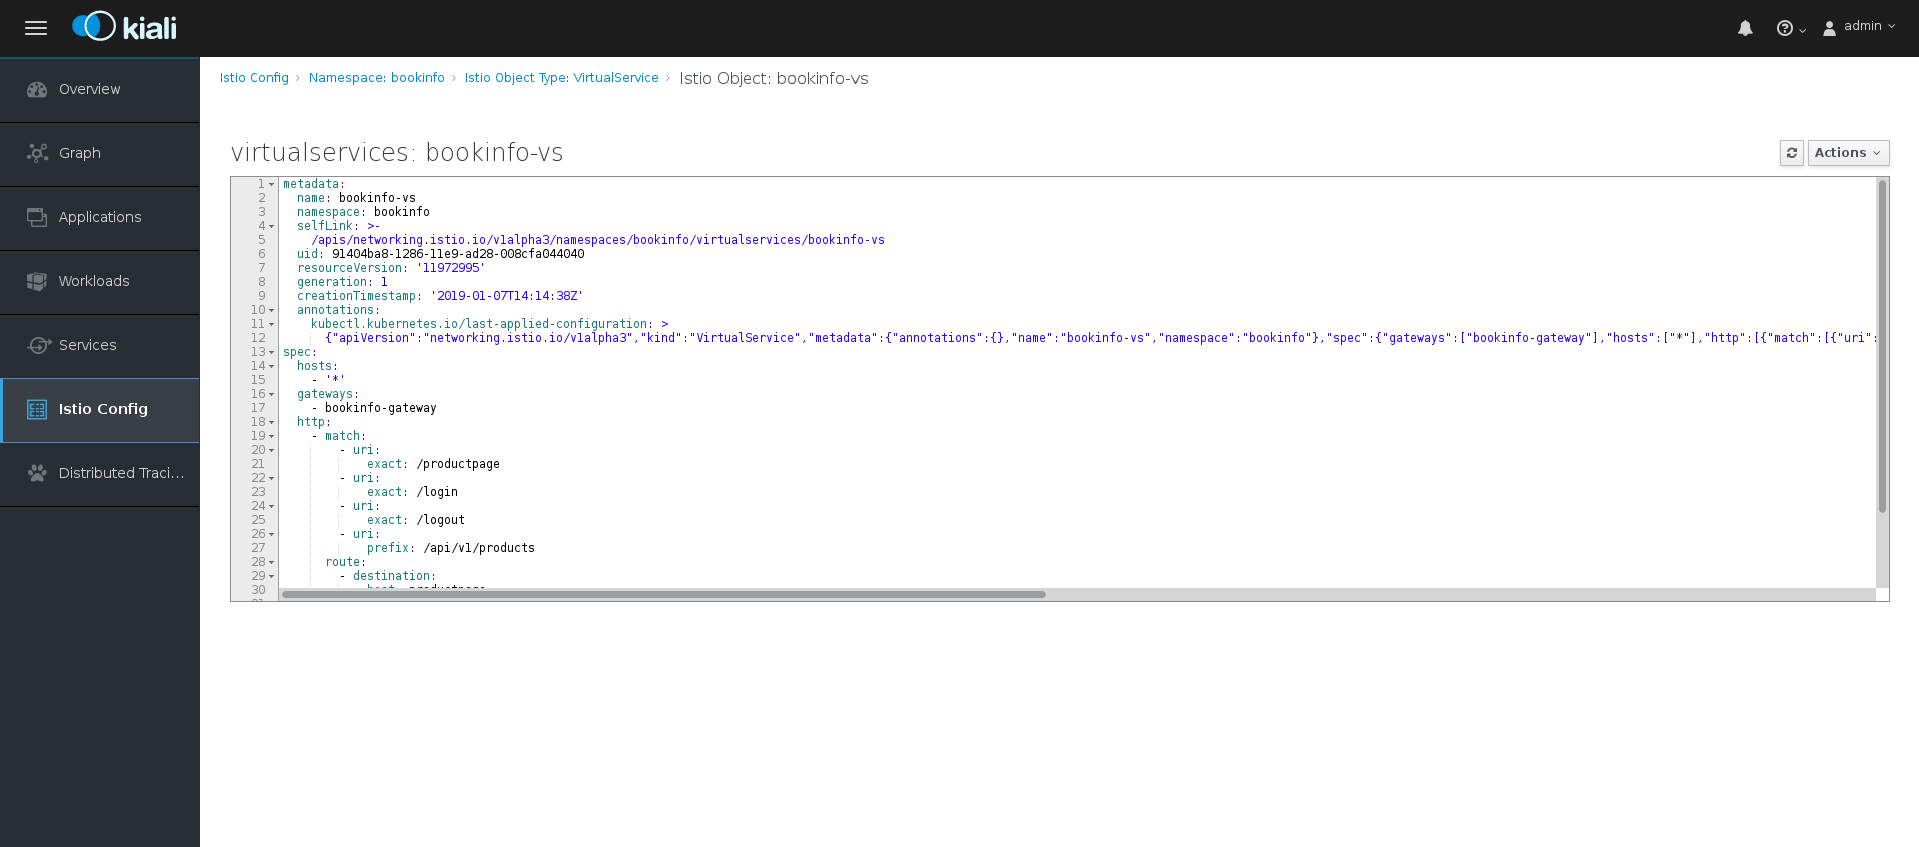
Click one of the configurations to view additional information about the configuration file.
3.5. Distributed tracing tutorial
Jaeger is an open source distributed tracing system. You use Jaeger for monitoring and troubleshooting microservices-based distributed systems. Using Jaeger you can perform a trace, which follows the path of a request through various microservices that make up an application. Jaeger is installed by default as part of the Service Mesh.
This tutorial uses Service Mesh and the bookinfo tutorial to demonstrate how you can use Jeager to perform distributed tracing.
The Bookinfo example application allows you to test your Red Hat OpenShift Service Mesh 1.0.10 installation on OpenShift Container Platform.
Red Hat does not provide support for the Bookinfo application.
3.5.1. Generating traces and analyzing trace data
This tutorial uses Service Mesh and the Bookinfo tutorial to demonstrate how you can perform a trace using the Jaeger component of Red Hat OpenShift Service Mesh.
Prerequisites:
- OpenShift Container Platform 4.1 or higher installed.
- Red Hat OpenShift Service Mesh 1.0.10 installed.
- Jaeger enabled during the installation.
- Bookinfo example application installed.
Procedure
- After you have deployed the Bookinfo application you will need to generate calls to the Bookinfo application so that you have some trace data to analyze. Access http://<GATEWAY_URL>/productpage and refresh the page a few times to generate some trace data.
The installation process creates a route to access the Jaeger console.
- In the OpenShift Container Platform console, navigate to Networking → Routes and search for the Jaeger route, which is the URL listed under Location.
Use the CLI to query for details of the route:
$ export JAEGER_URL=$(oc get route -n bookinfo jaeger-query -o jsonpath='{.spec.host}')
-
Launch a browser and navigate to
https://<JAEGER_URL>. - If necessary, log in using the same user name and password as you use to access the OpenShift Container Platform console.
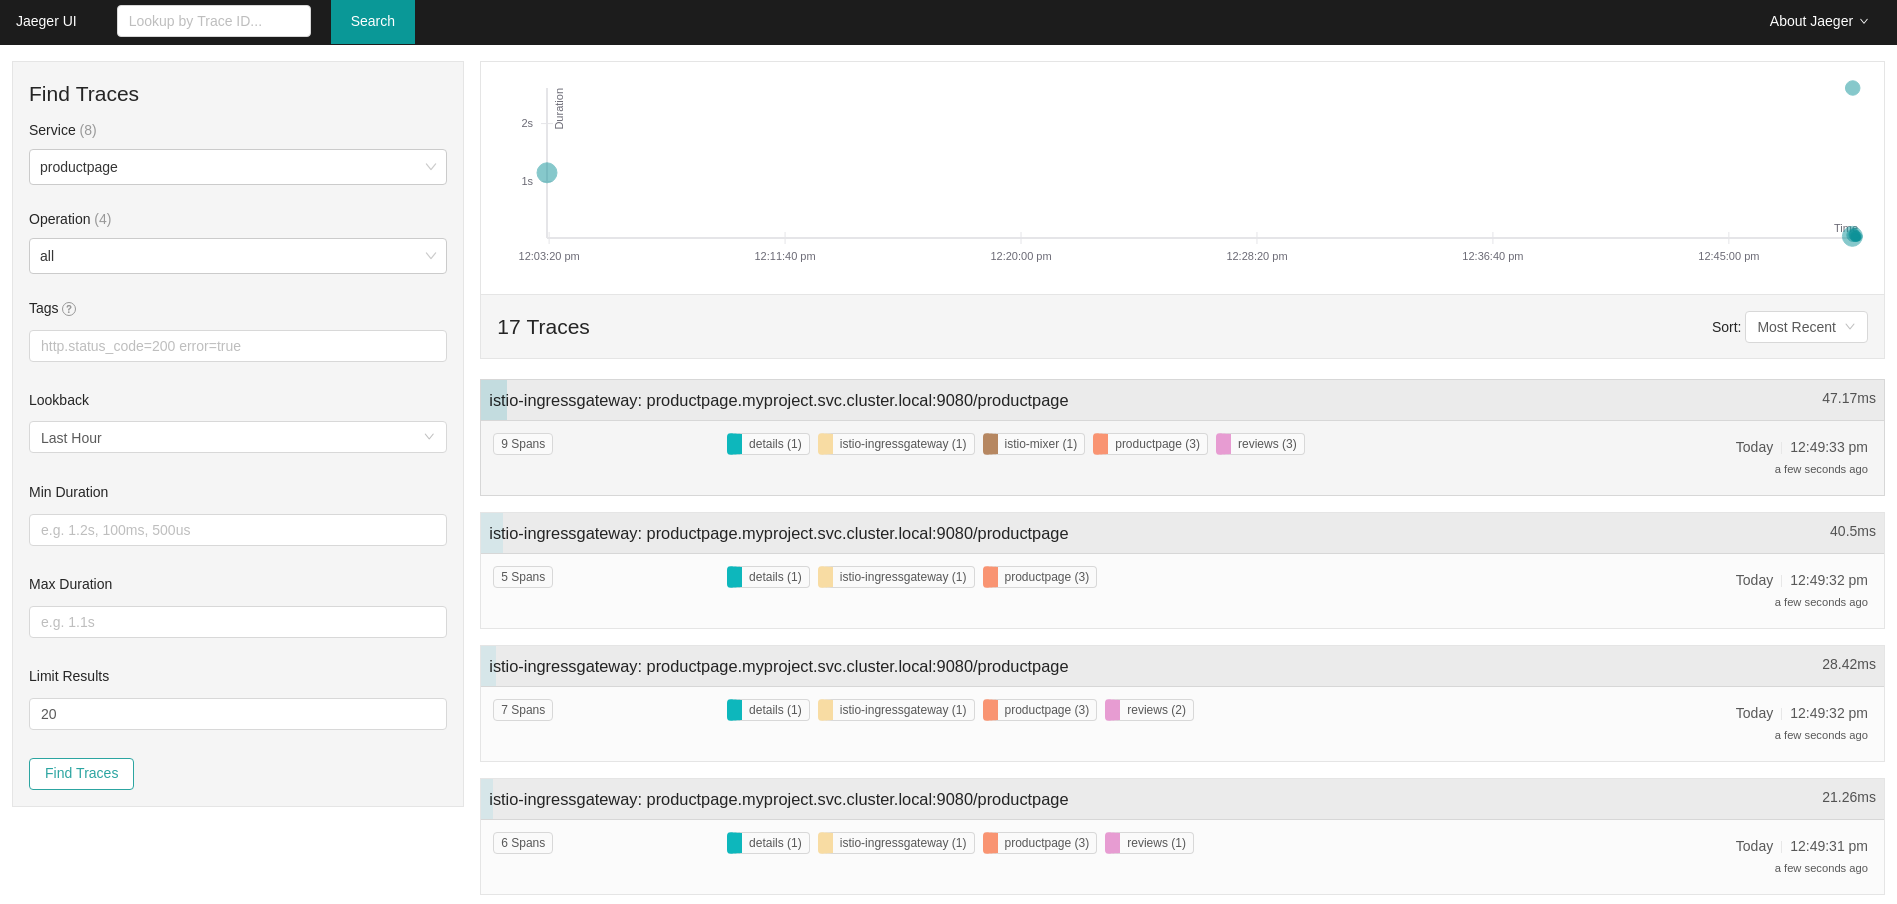
In the left pane of the Jaeger dashboard, from the Service menu, select "productpage" and click the Find Traces button at the bottom of the pane. A list of traces is displayed, as shown in the following image:
Click one of the traces in the list to open a detailed view of that trace. If you click on the top (most recent) trace, you see the details that correspond to the latest refresh of the
`/productpage.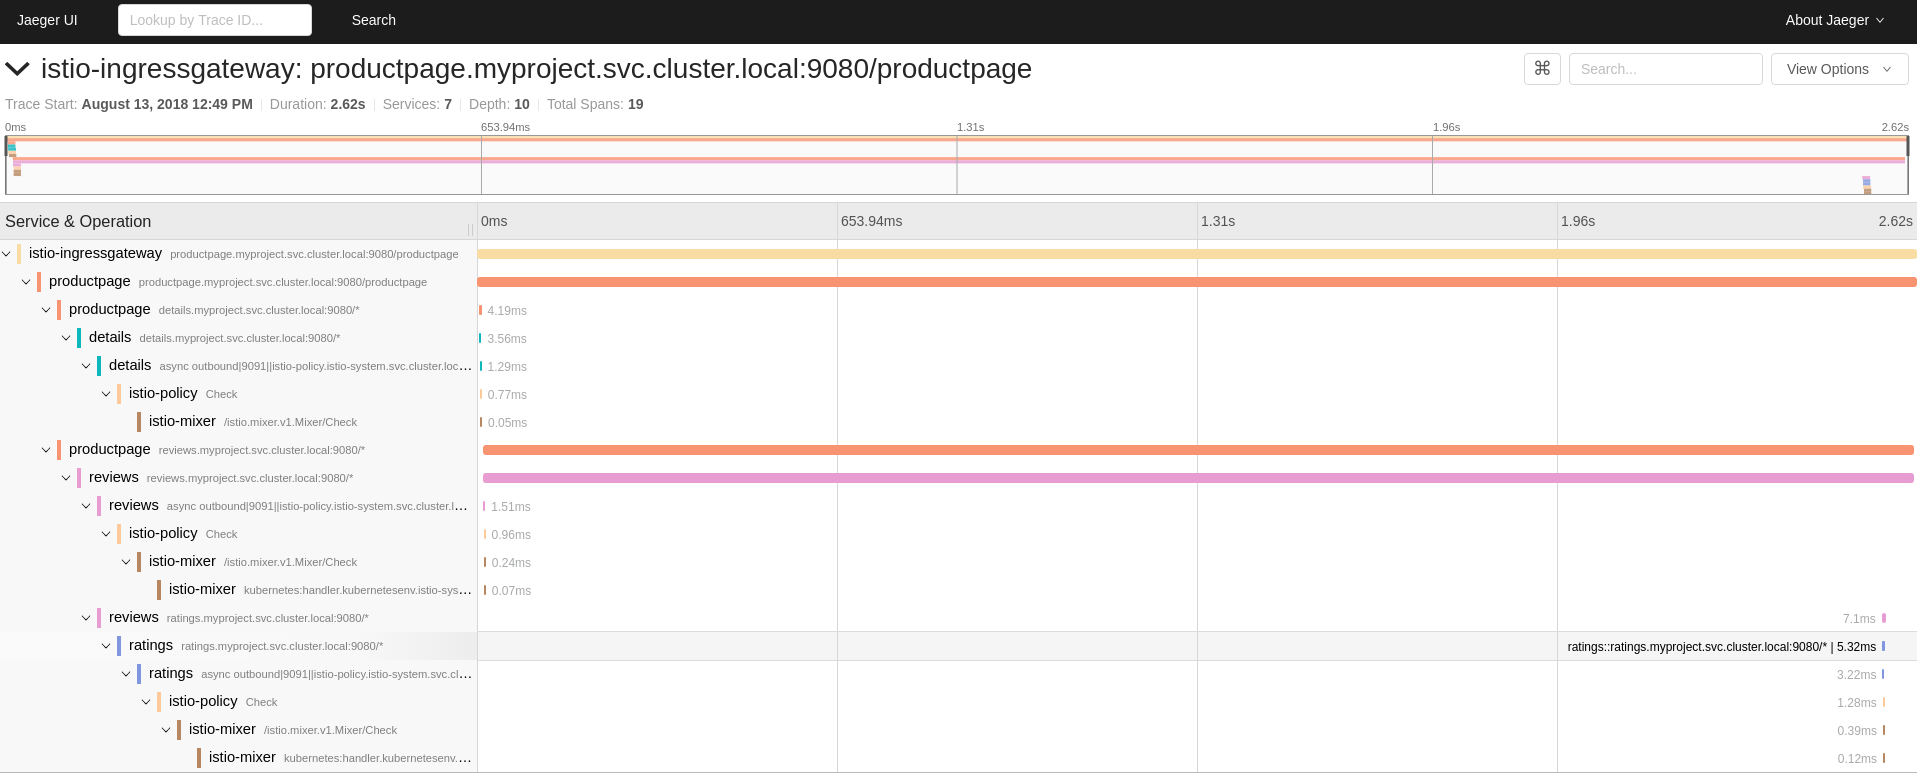
The trace in the previous figure consists of a few nested spans, each corresponding to a Bookinfo Service call, all performed in response to a
`/productpagerequest. Overall processing time was 2.62s, with the details Service taking 3.56ms, the reviews Service taking 2.6s, and the ratings Service taking 5.32ms. Each of the calls to remote Services is represented by a client-side and server-side span. For example, the details client-side span is labeledproductpage details.myproject.svc.cluster.local:9080. The span nested underneath it, labeleddetails details.myproject.svc.cluster.local:9080, corresponds to the server-side processing of the request. The trace also shows calls to istio-policy, which reflect authorization checks made by Istio.