
Red Hat Training
A Red Hat training course is available for OpenShift Container Platform
Monitoring
Configuring and using the Prometheus monitoring stack in OpenShift Container Platform 4.1
Abstract
Chapter 1. Cluster monitoring
1.1. About cluster monitoring
OpenShift Container Platform includes a pre-configured, pre-installed, and self-updating monitoring stack that is based on the Prometheus open source project and its wider eco-system. It provides monitoring of cluster components and includes a set of alerts to immediately notify the cluster administrator about any occurring problems and a set of Grafana dashboards. The cluster monitoring stack is only supported for monitoring OpenShift Container Platform clusters.
To ensure compatibility with future OpenShift Container Platform updates, configuring only the specified monitoring stack options is supported.
1.1.1. Stack components and monitored targets
The monitoring stack includes these components:
Table 1.1. Monitoring stack components
| Component | Description |
|---|---|
| Cluster Monitoring Operator | The OpenShift Container Platform Cluster Monitoring Operator (CMO) is the central component of the stack. It controls the deployed monitoring components and resources and ensures that they are always up to date. |
| Prometheus Operator | The Prometheus Operator (PO) creates, configures, and manages Prometheus and Alertmanager instances. It also automatically generates monitoring target configurations based on familiar Kubernetes label queries. |
| Prometheus | The Prometheus is the systems and service monitoring system, around which the monitoring stack is based. |
| Prometheus Adapter | The Prometheus Adapter exposes cluster resource metrics API for horizontal pod autoscaling. Resource metrics are CPU and memory utilization. |
| Alertmanager | The Alertmanager service handles alerts sent by Prometheus. |
|
|
The |
|
|
|
| Grafana | The Grafana analytics platform provides dashboards for analyzing and visualizing the metrics. The Grafana instance that is provided with the monitoring stack, along with its dashboards, is read-only. |
All the components of the monitoring stack are monitored by the stack and are automatically updated when OpenShift Container Platform is updated.
In addition to the components of the stack itself, the monitoring stack monitors:
- CoreDNS
- Elasticsearch (if Logging is installed)
- Etcd
- Fluentd (if Logging is installed)
- HAProxy
- Image registry
- Kubelets
- Kubernetes apiserver
- Kubernetes controller manager
- Kubernetes scheduler
- Metering (if Metering is installed)
- OpenShift apiserver
- OpenShift controller manager
- Operator Lifecycle Manager (OLM)
- Telemeter client
Each OpenShift Container Platform component is responsible for its monitoring configuration. For problems with a component’s monitoring, open a bug in Bugzilla against that component, not against the general monitoring component.
Other OpenShift Container Platform framework components might be exposing metrics as well. For details, see their respective documentation.
Next steps
1.2. Configuring the monitoring stack
Prior to OpenShift Container Platform 4, the Prometheus Cluster Monitoring stack was configured through the Ansible inventory file. For that purpose, the stack exposed a subset of its available configuration options as Ansible variables. You configured the stack before you installed OpenShift Container Platform.
In OpenShift Container Platform 4, Ansible is not the primary technology to install OpenShift Container Platform anymore. The installation program provides only a very low number of configuration options before installation. Configuring most OpenShift framework components, including the Prometheus Cluster Monitoring stack, happens post-installation.
This section explains what configuration is supported, shows how to configure the monitoring stack, and demonstrates several common configuration scenarios.
Prerequisites
- The monitoring stack imposes additional resource requirements. Consult the computing resources recommendations in Scaling the Cluster Monitoring Operator and verify that you have sufficient resources.
1.2.1. Maintenance and support
The supported way of configuring OpenShift Container Platform Monitoring is by configuring it using the options described in this document. Do not use other configurations, as they are unsupported. Configuration paradigms might change across Prometheus releases, and such cases can only be handled gracefully if all configuration possibilities are controlled. If you use configurations other than those described in this section, your changes will disappear because the cluster-monitoring-operator reconciles any differences. The operator reverses everything to the defined state by default and by design.
Explicitly unsupported cases include:
-
Creating additional
ServiceMonitorobjects in theopenshift-*namespaces. This extends the targets the cluster monitoring Prometheus instance scrapes, which can cause collisions and load differences that cannot be accounted for. These factors might make the Prometheus setup unstable. -
Creating unexpected
ConfigMapobjects orPrometheusRuleobjects. This causes the cluster monitoring Prometheus instance to include additional alerting and recording rules. - Modifying resources of the stack. The Prometheus Monitoring Stack ensures its resources are always in the state it expects them to be. If they are modified, the stack will reset them.
- Using resources of the stack for your purposes. The resources created by the Prometheus Cluster Monitoring stack are not meant to be used by any other resources, as there are no guarantees about their backward compatibility.
- Stopping the Cluster Monitoring Operator from reconciling the monitoring stack.
- Adding new alerting rules.
- Modifying the monitoring stack Grafana instance.
1.2.2. Creating cluster monitoring ConfigMap
To configure the Prometheus Cluster Monitoring stack, you must create the cluster monitoring ConfigMap.
Prerequisites
-
An installed
ocCLI tool - Administrative privileges for the cluster
Procedure
Check whether the
cluster-monitoring-configConfigMap object exists:$ oc -n openshift-monitoring get configmap cluster-monitoring-config
If it does not exist, create it:
$ oc -n openshift-monitoring create configmap cluster-monitoring-config
Start editing the
cluster-monitoring-configConfigMap:$ oc -n openshift-monitoring edit configmap cluster-monitoring-config
Create the
datasection if it does not exist yet:apiVersion: v1 kind: ConfigMap metadata: name: cluster-monitoring-config namespace: openshift-monitoring data: config.yaml: |
1.2.3. Configuring the cluster monitoring stack
You can configure the Prometheus Cluster Monitoring stack using ConfigMaps. ConfigMaps configure the Cluster Monitoring Operator, which in turn configures components of the stack.
Prerequisites
-
Make sure you have the
cluster-monitoring-configConfigMap object with thedata/config.yamlsection.
Procedure
Start editing the
cluster-monitoring-configConfigMap:$ oc -n openshift-monitoring edit configmap cluster-monitoring-config
Put your configuration under
data/config.yamlas key-value pair<component_name>: <component_configuration>:apiVersion: v1 kind: ConfigMap metadata: name: cluster-monitoring-config namespace: openshift-monitoring data: config.yaml: | component: configuration for the component
Substitute
<component>and<configuration for the component>accordingly.For example, create this ConfigMap to configure a Persistent Volume Claim (PVC) for Prometheus:
apiVersion: v1 kind: ConfigMap metadata: name: cluster-monitoring-config namespace: openshift-monitoring data: config.yaml: | prometheusK8s: volumeClaimTemplate: spec: storageClassName: fast volumeMode: filesystem resources: requests: storage: 40GiHere, prometheusK8s defines the Prometheus component and the following lines define its configuration.
- Save the file to apply the changes. The pods affected by the new configuration are restarted automatically.
1.2.4. Configurable monitoring components
This table shows the monitoring components you can configure and the keys used to specify the components in the ConfigMap:
Table 1.2. Configurable monitoring components
| Component | Key |
|---|---|
| Prometheus Operator |
|
| Prometheus |
|
| Alertmanager |
|
| kube-state-metrics |
|
| Grafana |
|
| Telemeter Client |
|
| Prometheus Adapter |
|
From this list, only Prometheus and Alertmanager have extensive configuration options. All other components usually provide only the nodeSelector field for being deployed on a specified node.
1.2.5. Moving monitoring components to different nodes
You can move any of the monitoring stack components to specific nodes.
Prerequisites
-
Make sure you have the
cluster-monitoring-configConfigMap object with thedata/config.yamlsection.
Procedure
Start editing the
cluster-monitoring-configConfigMap:$ oc -n openshift-monitoring edit configmap cluster-monitoring-config
Specify the
nodeSelectorconstraint for the component underdata/config.yaml:apiVersion: v1 kind: ConfigMap metadata: name: cluster-monitoring-config namespace: openshift-monitoring data: config.yaml: | component: nodeSelector: node key: node value node key: node value ...Substitute
<component>accordingly and substitute<node key>: <node value>with the map of key-value pairs that specifies the destination node. Often, only a single key-value pair is used.The component can only run on a node that has each of the specified key-value pairs as labels. The node can have additional labels as well.
For example, to move components to the node that is labeled
foo: bar, use:apiVersion: v1 kind: ConfigMap metadata: name: cluster-monitoring-config namespace: openshift-monitoring data: config.yaml: | prometheusOperator: nodeSelector: foo: bar prometheusK8s: nodeSelector: foo: bar alertmanagerMain: nodeSelector: foo: bar kubeStateMetrics: nodeSelector: foo: bar grafana: nodeSelector: foo: bar telemeterClient: nodeSelector: foo: bar k8sPrometheusAdapter: nodeSelector: foo: bar- Save the file to apply the changes. The components affected by the new configuration are moved to new nodes automatically.
Additional resources
-
See the Kubernetes documentation for details on the
nodeSelectorconstraint.
1.2.6. Configuring persistent storage
Running cluster monitoring with persistent storage means that your metrics are stored to a Persistent Volume and can survive a pod being restarted or recreated. This is ideal if you require your metrics or alerting data to be guarded from data loss. For production environments, it is highly recommended to configure persistent storage.
Prerequisites
- Dedicate sufficient persistent storage to ensure that the disk does not become full. How much storage you need depends on the number of pods. For information on system requirements for persistent storage, see Prometheus database storage requirements.
- Unless you enable dynamically-provisioned storage, make sure you have a Persistent Volume (PV) ready to be claimed by the Persistent Volume Claim (PVC), one PV for each replica. Since Prometheus has two replicas and Alertmanager has three replicas, you need five PVs to support the entire monitoring stack.
- Use the block type of storage.
1.2.6.1. Configuring a persistent volume claim
For the Prometheus or Alertmanager to use a persistent volume (PV), you first must configure a persistent volume claim (PVC).
Prerequisites
- Make sure you have the necessary storage class configured.
-
Make sure you have the
cluster-monitoring-configConfigMap object with thedata/config.yamlsection.
Procedure
Edit the
cluster-monitoring-configConfigMap:$ oc -n openshift-monitoring edit configmap cluster-monitoring-config
Put your PVC configuration for the component under
data/config.yaml:apiVersion: v1 kind: ConfigMap metadata: name: cluster-monitoring-config namespace: openshift-monitoring data: config.yaml: | component: volumeClaimTemplate: metadata: name: PVC name spec: storageClassName: storage class resources: requests: storage: 40GiSee the Kubernetes documentation on PersistentVolumeClaims for information on how to specify
volumeClaimTemplate.For example, to configure a PVC that claims any configured OpenShift Container Platform block PV as a persistent storage for Prometheus, use:
apiVersion: v1
kind: ConfigMap
metadata:
  name: cluster-monitoring-config
  namespace: openshift-monitoring
data:
  config.yaml: |
    prometheusK8s:
      volumeClaimTemplate:
        metadata:
          name: my-prometheus-claim
        spec:
          storageClassName: gluster-block
          resources:
            requests:
              storage: 40Gi
And to configure a PVC that claims any configured OpenShift Container Platform block PV as a persistent storage for Alertmanager, you can use:
apiVersion: v1 kind: ConfigMap metadata: name: cluster-monitoring-config namespace: openshift-monitoring data: config.yaml: | alertmanagerMain: volumeClaimTemplate: metadata: name: my-alertmanager-claim spec: storageClassName: gluster-block resources: requests: storage: 40Gi- Save the file to apply the changes. The pods affected by the new configuration are restarted automatically and the new storage configuration is applied.
1.2.6.2. Modifying retention time for Prometheus metrics data
By default, the Prometheus Cluster Monitoring stack configures the retention time for Prometheus data to be 15 days. You can modify the retention time to change how soon the data is deleted.
Prerequisites
-
Make sure you have the
cluster-monitoring-configConfigMap object with thedata/config.yamlsection.
Procedure
Start editing the
cluster-monitoring-configConfigMap:$ oc -n openshift-monitoring edit configmap cluster-monitoring-config
Put your retention time configuration under
data/config.yaml:apiVersion: v1 kind: ConfigMap metadata: name: cluster-monitoring-config namespace: openshift-monitoring data: config.yaml: | prometheusK8s: retention: time specificationSubstitute
<time specification>with a number directly followed byms(milliseconds),s(seconds),m(minutes),h(hours),d(days),w(weeks), ory(years).For example, to configure retention time to be 24 hours, use:
apiVersion: v1 kind: ConfigMap metadata: name: cluster-monitoring-config namespace: openshift-monitoring data: config.yaml: | prometheusK8s: retention: 24h- Save the file to apply the changes. The pods affected by the new configuration are restarted automatically.
1.2.7. Configuring Alertmanager
The Prometheus Alertmanager is a component that manages incoming alerts, including:
- Alert silencing
- Alert inhibition
- Alert aggregation
- Reliable deduplication of alerts
- Grouping alerts
- Sending grouped alerts as notifications through receivers such as email, PagerDuty, and HipChat
1.2.7.1. Alertmanager default configuration
The default configuration of the OpenShift Container Platform Monitoring Alertmanager cluster is this:
global:
  resolve_timeout: 5m
route:
  group_wait: 30s
  group_interval: 5m
  repeat_interval: 12h
  receiver: default
  routes:
  - match:
      alertname: Watchdog
    repeat_interval: 5m
    receiver: watchdog
receivers:
- name: default
- name: watchdog
OpenShift Container Platform monitoring ships with the Watchdog alert that always triggers by default to ensure the availability of the monitoring infrastructure.
1.2.7.2. Applying custom Alertmanager configuration
You can overwrite the default Alertmanager configuration by editing the alertmanager-main secret inside the openshift-monitoring namespace.
Prerequisites
-
An installed
jqtool for processing JSON data
Procedure
Print the currently active Alertmanager configuration into file
alertmanager.yaml:$ oc -n openshift-monitoring get secret alertmanager-main --template='{{ index .data "alertmanager.yaml" }}' |base64 -d > alertmanager.yamlChange the configuration in file
alertmanager.yamlto your new configuration:data: config.yaml: | global: resolve_timeout: 5m route: group_wait: 30s group_interval: 5m repeat_interval: 12h receiver: default routes: - match: alertname: Watchdog repeat_interval: 5m receiver: watchdog - match: service: _your service_ 1 routes: - match: _your matching rules_ 2 receiver: _receiver_ 3 receivers: - name: default - name: watchdog - name: _receiver_ _receiver configuration_For example, this listing configures PagerDuty for notifications:
data:
 config.yaml: |
  global:
    resolve_timeout: 5m
  route:
    group_wait: 30s
    group_interval: 5m
    repeat_interval: 12h
    receiver: default
    routes:
    - match:
        alertname: Watchdog
      repeat_interval: 5m
      receiver: watchdog
    - match: service: example-app routes: - match: severity: critical receiver: team-frontend-page
  receivers:
  - name: default
  - name: watchdog
  - name: team-frontend-page pagerduty_configs: - service_key: "your-key"
With this configuration, alerts of
criticalseverity fired by theexample-appservice are sent using theteam-frontend-pagereceiver, which means that these alerts are paged to a chosen person.Apply the new configuration in the file:
$ oc -n openshift-monitoring create secret generic alertmanager-main --from-file=alertmanager.yaml --dry-run -o=yaml | oc -n openshift-monitoring replace secret --filename=-
Additional resources
- See the PagerDuty official site for more information on PagerDuty.
-
See the PagerDuty Prometheus Integration Guide to learn how to retrieve the
service_key. - See Alertmanager configuration for configuring alerting through different alert receivers.
1.2.7.3. Alerting rules
OpenShift Container Platform Cluster Monitoring by default ships with a set of pre-defined alerting rules.
Note that:
- The default alerting rules are used specifically for the OpenShift Container Platform cluster and nothing else. For example, you get alerts for a persistent volume in the cluster, but you do not get them for persistent volume in your custom namespace.
- Currently you cannot add custom alerting rules.
- Some alerting rules have identical names. This is intentional. They are sending alerts about the same event with different thresholds, with different severity, or both.
- With the inhibition rules, the lower severity is inhibited when the higher severity is firing.
1.2.7.4. Listing acting alerting rules
You can list the alerting rules that currently apply to the cluster.
Procedure
Configure the necessary port forwarding:
$ oc -n openshift-monitoring port-forward svc/prometheus-operated 9090
Fetch the JSON object containing acting alerting rules and their properties:
$ curl -s http://localhost:9090/api/v1/rules | jq '[.data.groups[].rules[] | select(.type=="alerting")]'
[
  {
    "name": "ClusterOperatorDown",
    "query": "cluster_operator_up{job=\"cluster-version-operator\"} == 0",
    "duration": 600,
    "labels": {
      "severity": "critical"
    },
    "annotations": {
      "message": "Cluster operator {{ $labels.name }} has not been available for 10 mins. Operator may be down or disabled, cluster will not be kept up to date and upgrades will not be possible."
    },
    "alerts": [],
    "health": "ok",
    "type": "alerting"
  },
  {
    "name": "ClusterOperatorDegraded",
    ...
Additional resources
- See also the Alertmanager documentation.
Next steps
- Manage cluster alerts.
- Learn about Telemetry and, if necessary, opt out of it.
1.3. Managing cluster alerts
OpenShift Container Platform 4 provides a Web interface to the Alertmanager, which enables you to manage alerts. This section demonstrates how to use the Alerting UI.
1.3.1. Contents of the Alerting UI
This section shows and explains the contents of the Alerting UI, a Web interface to the Alertmanager.
The main two pages of the Alerting UI are the Alerts and the Silences pages.
The Alerts page is located in Monitoring → Alerts of the OpenShift Container Platform web console.
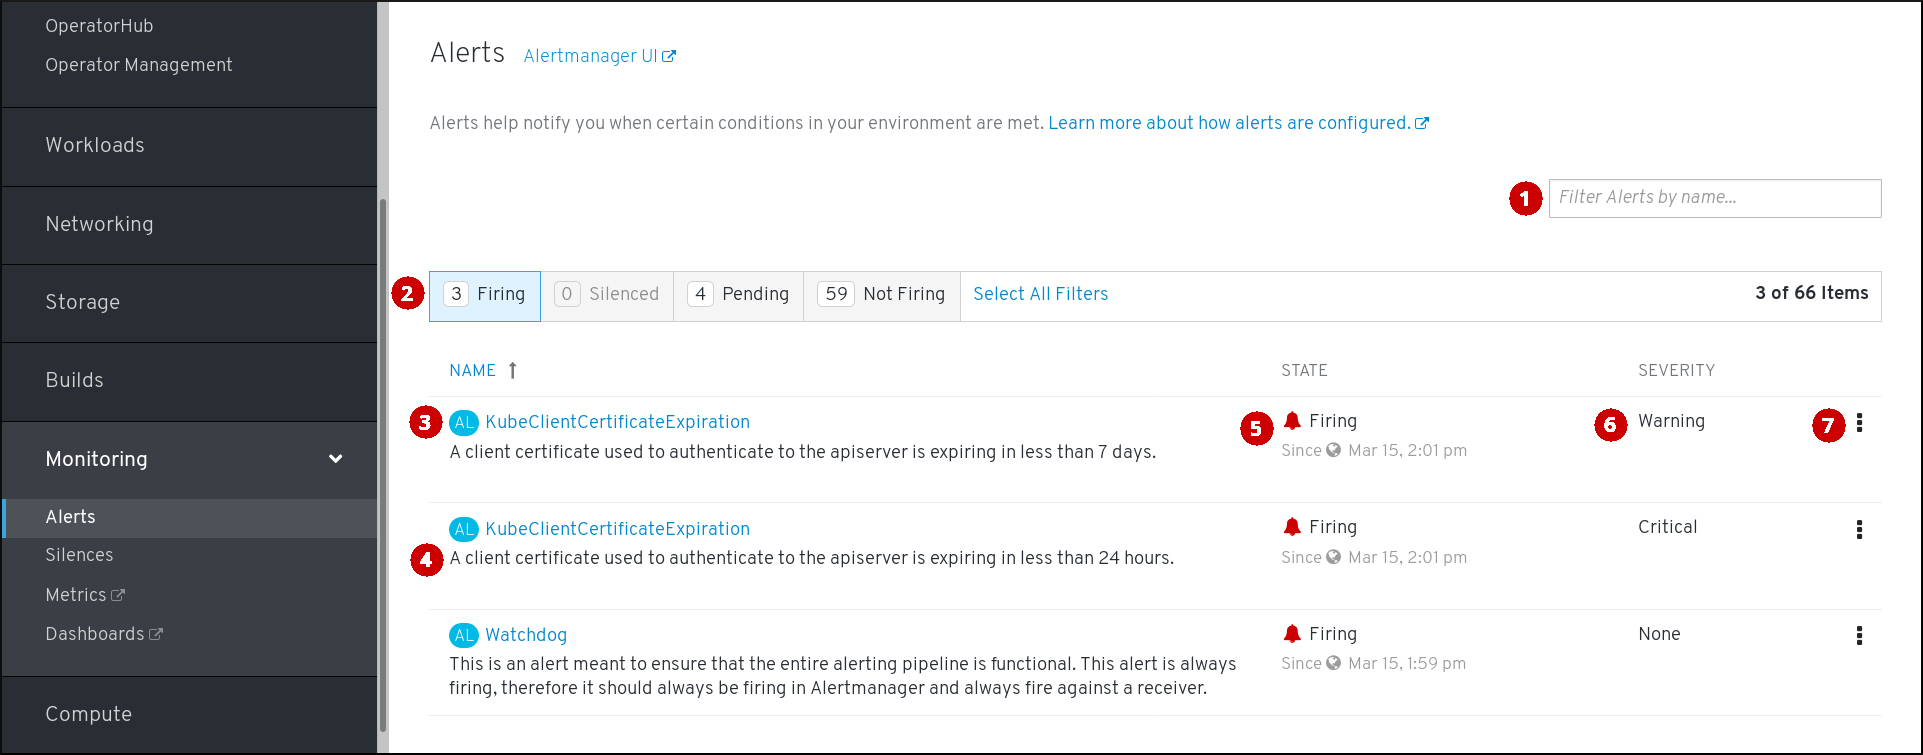
- Filtering alerts by their names.
- Filtering the alerts by their states. To fire, some alerts need a certain condition to be true for the duration of a timeout. If a condition of an alert is currently true, but the timeout has not been reached, such an alert is in the Pending state.
- Alert name.
- Description of an alert.
- Current state of the alert and when the alert went into this state.
- Value of the Severity label of the alert.
- Actions you can do with the alert.
The Silences page is located in Monitoring → Silences of the OpenShift Container Platform web console.
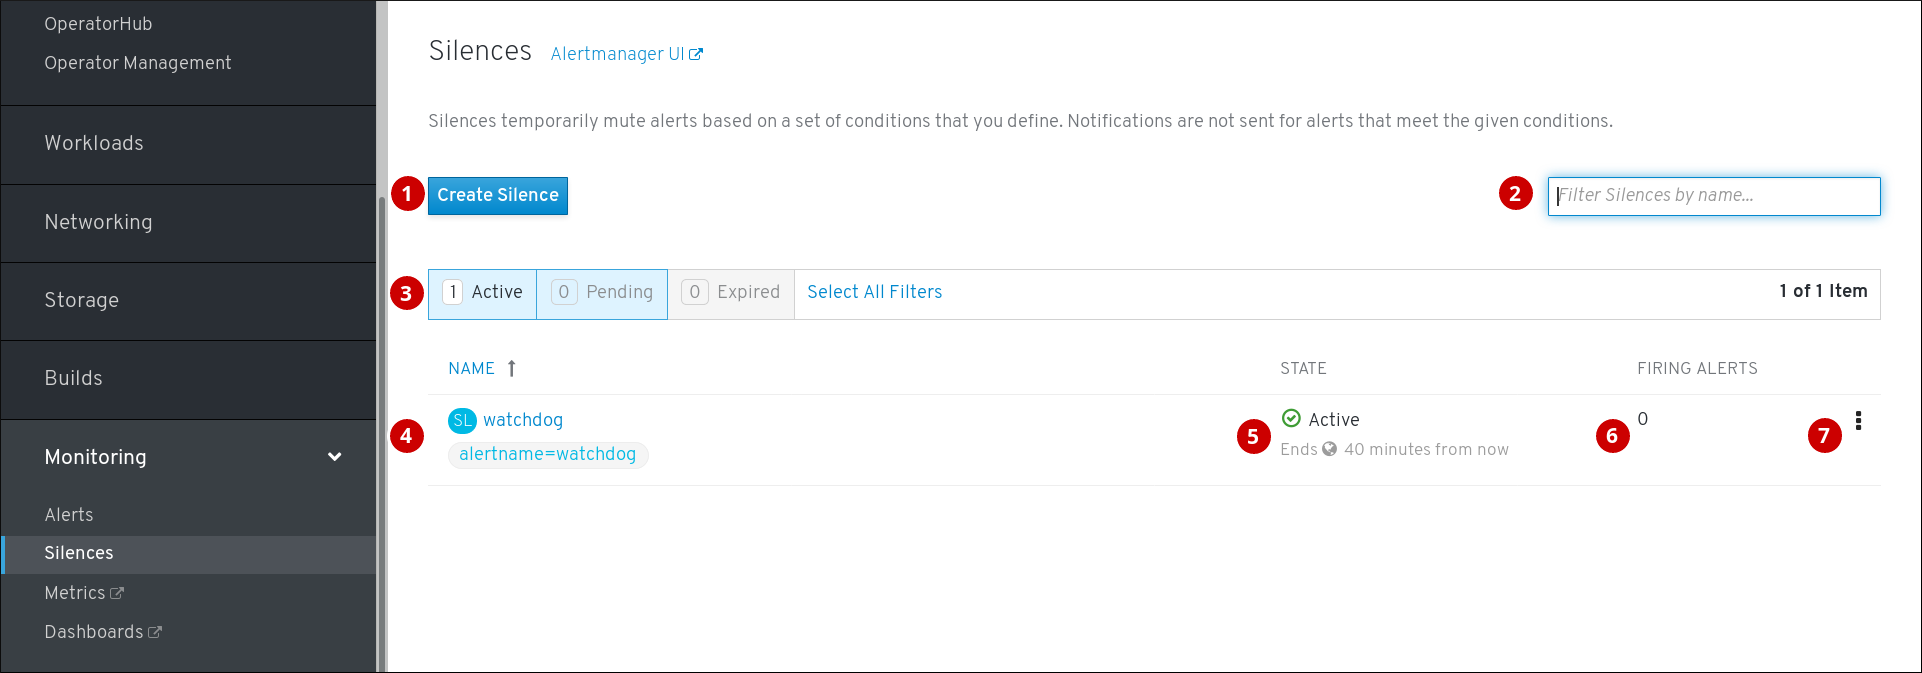
- Creating a silence for an alert.
- Filtering silences by their name.
- Filtering silences by their states. If a silence is pending, it is currently not active because it is scheduled to start at a later time. If a silence expired, it is no longer active because it has reached its end time.
- Description of a silence. It includes the specification of alerts that it matches.
- Current state of the silence. For active silences, it shows when it ends, and for pending silences, it shows when it starts.
- Number of alerts that are being silenced by the silence.
- Actions you can do with a silence.
Additionally, next to the title of each of these pages is a link to the old Alertmanager interface.
1.3.2. Getting information about alerts and alerting rules
You can find an alert and see information about it or its governing alerting rule.
Procedure
- Open the OpenShift Container Platform web console and navigate to Monitoring → Alerts.
- Optional: Filter the alerts by name using the Filter alerts by name field.
- Optional: Filter the alerts by state using one or more of the state buttons Firing, Silenced, Pending, Not firing.
- Optional: Sort the alerts by clicking one or more of the Name, State, and Severity column headers.
After you see the alert, you can see either details of the alert or details of its governing alerting rule.
To see alert details, click on the name of the alert. This is the page with alert details:

The page has the graph with timeseries of the alert. It also has information about the alert, including:
- A link to its governing alerting rule
- Description of the alert
To see alerting rule details, click the button in the last column and select View Alerting Rule. This is the page with alerting rule details:
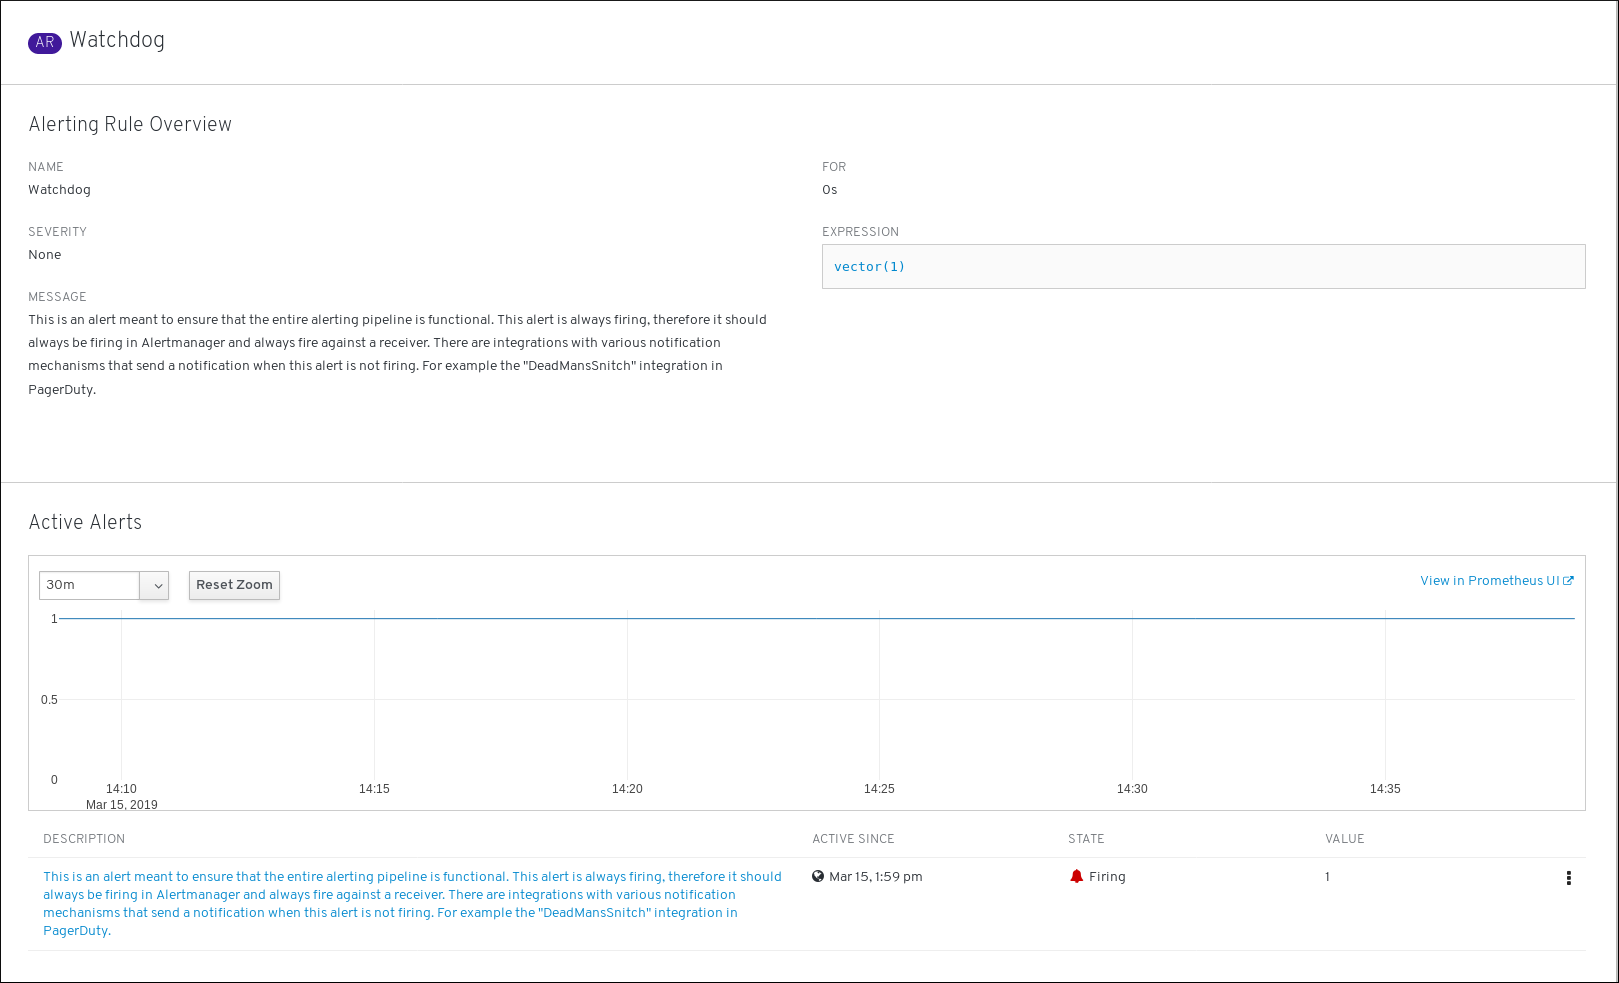
The page has information about the alerting rule, including:
- Alerting rule name, severity, and description
- The expression that defines the condition for firing the alert
- The time for which the condition should be true for an alert to fire
- Graph for each alert governed by the alerting rule, showing the value with which the alert is firing
- Table of all alerts governed by the alerting rule
1.3.3. Silencing alerts
You can either silence a specific alert or silence alerts that match a specification that you define.
Procedure
To silence a set of alerts by creating an alert specification:
- Navigate to the Monitoring → Silences page of the OpenShift Container Platform web console.
- Click Create Silence.
- Populate the Create Silence form.
- To create the silence, click Create.
To silence a specific alert:
- Navigate to the Monitoring → Alerts page of the OpenShift Container Platform web console.
- For the alert that you want to silence, click the button in the last column and click Silence Alert. The Create Silence form will appear with prepopulated specification of the chosen alert.
- Optional: Modify the silence.
- To create the silence, click Create.
1.3.4. Getting information about silences
You can find a silence and view its details.
Procedure
- Open the OpenShift Container Platform web console and navigate to Monitoring → Silences.
- Optional: Filter the silences by name using the Filter Silences by name field.
- Optional: Filter the silences by state using one or more of the state buttons Active, Pending, Expired.
- Optional: Sort the silences by clicking one or more of the Name, State, and Firing alerts column headers.
After you see the silence, you can click its name to see the details, including:
- Alert specification
- State
- Start time
- End time
- Number and list of firing alerts
1.3.5. Editing silences
You can edit a silence, which will expire the existing silence and create a new silence with the changed configuration.
Procedure
- Navigate to the Monitoring → Silences screen.
For the silence you want to modify, click the button in the last column and click Edit silence.
Alternatively, you can click Actions → Edit Silence in the Silence Overview screen for a particular silence.
- In the Edit Silence screen, enter your changes and click the Save button. This will expire the existing silence and create one with the chosen configuration.
1.3.6. Expiring silences
You can expire a silence. Expiring a silence deactivates it forever.
Procedure
- Navigate to the Monitoring → Silences page.
For the silence you want to expire, click the button in the last column and click Expire Silence.
Alternatively, you can click the Actions → Expire Silence button in the Silence Overview page for a particular silence.
- Confirm by clicking Expire Silence. This expires the silence.
1.4. Accessing Prometheus, Alertmanager, and Grafana
To work with data gathered by the monitoring stack, you might want to use the Prometheus, Alertmanager, and Grafana interfaces. They are available by default.
1.4.1. Accessing Prometheus, Alerting UI, and Grafana using the Web console
You can access Prometheus, Alerting UI, and Grafana web UIs using a Web browser through the OpenShift Container Platform Web console.
The Alerting UI accessed in this procedure is the new interface for Alertmanager.
Prerequisites
-
Authentication is performed against the OpenShift Container Platform identity and uses the same credentials or means of authentication as is used elsewhere in OpenShift Container Platform. You must use a role that has read access to all namespaces, such as the
cluster-monitoring-viewcluster role.
Procedure
- Navigate to the OpenShift Container Platform Web console and authenticate.
To access Prometheus, navigate to "Monitoring" → "Metrics".
To access the Alerting UI, navigate to "Monitoring" → "Alerts" or "Monitoring" → "Silences".
To access Grafana, navigate to "Monitoring" → "Dashboards".
1.4.2. Accessing Prometheus, Alertmanager, and Grafana directly
You can access Prometheus, Alertmanager, and Grafana web UIs using the oc tool and a Web browser.
The Alertmanager UI accessed in this procedure is the old interface for Alertmanager.
Prerequisites
-
Authentication is performed against the OpenShift Container Platform identity and uses the same credentials or means of authentication as is used elsewhere in OpenShift Container Platform. You must use a role that has read access to all namespaces, such as the
cluster-monitoring-viewcluster role.
Procedure
Run:
$ oc -n openshift-monitoring get routes
NAME                HOST/PORT                                                     ...
alertmanager-main   alertmanager-main-openshift-monitoring.apps.url.openshift.com ...
grafana             grafana-openshift-monitoring.apps.url.openshift.com           ...
prometheus-k8s      prometheus-k8s-openshift-monitoring.apps.url.openshift.com    ...
Prepend
https://to the address, you cannot access web UIs using unencrypted connection.For example, this is the resulting URL for Alertmanager:
https://alertmanager-main-openshift-monitoring.apps.url.openshift.com- Navigate to the address using a Web browser and authenticate.
Additional resources
- For documentation on the new interface for Alertmanager, see Managing cluster alerts.
Chapter 2. Exposing custom application metrics for autoscaling
You can export custom application metrics for the horizontal pod autoscaler.
2.1. Exposing custom application metrics for horizontal pod autoscaling
You can use the prometheus-adapter resource to expose custom application metrics for the horizontal pod autoscaler.
Prometheus Adapter is a Technology Preview feature only. Technology Preview features are not supported with Red Hat production service level agreements (SLAs) and might not be functionally complete. Red Hat does not recommend using them in production. These features provide early access to upcoming product features, enabling customers to test functionality and provide feedback during the development process.
For more information about the support scope of Red Hat Technology Preview features, see https://access.redhat.com/support/offerings/techpreview/.
Prerequisites
-
Make sure you have a custom Prometheus instance installed. In this example, it is presumed that Prometheus was installed in the
defaultnamespace. -
Make sure you configured monitoring for your application. In this example, it is presumed that the application and the service monitor for it were installed in the
defaultnamespace.
Procedure
-
Create a YAML file for your configuration. In this example, it is called
deploy.yaml. Add configuration for creating the service account, necessary roles, and role bindings for
prometheus-adapter:kind: ServiceAccount apiVersion: v1 metadata: name: custom-metrics-apiserver namespace: default --- apiVersion: rbac.authorization.k8s.io/v1 kind: ClusterRole metadata: name: custom-metrics-server-resources rules: - apiGroups: - custom.metrics.k8s.io resources: ["*"] verbs: ["*"] --- apiVersion: rbac.authorization.k8s.io/v1 kind: ClusterRole metadata: name: custom-metrics-resource-reader rules: - apiGroups: - "" resources: - namespaces - pods - services verbs: - get - list --- apiVersion: rbac.authorization.k8s.io/v1 kind: ClusterRoleBinding metadata: name: custom-metrics:system:auth-delegator roleRef: apiGroup: rbac.authorization.k8s.io kind: ClusterRole name: system:auth-delegator subjects: - kind: ServiceAccount name: custom-metrics-apiserver namespace: default --- apiVersion: rbac.authorization.k8s.io/v1 kind: RoleBinding metadata: name: custom-metrics-auth-reader namespace: kube-system roleRef: apiGroup: rbac.authorization.k8s.io kind: Role name: extension-apiserver-authentication-reader subjects: - kind: ServiceAccount name: custom-metrics-apiserver namespace: default --- apiVersion: rbac.authorization.k8s.io/v1 kind: ClusterRoleBinding metadata: name: custom-metrics-resource-reader roleRef: apiGroup: rbac.authorization.k8s.io kind: ClusterRole name: custom-metrics-resource-reader subjects: - kind: ServiceAccount name: custom-metrics-apiserver namespace: default --- apiVersion: rbac.authorization.k8s.io/v1 kind: ClusterRoleBinding metadata: name: hpa-controller-custom-metrics roleRef: apiGroup: rbac.authorization.k8s.io kind: ClusterRole name: custom-metrics-server-resources subjects: - kind: ServiceAccount name: horizontal-pod-autoscaler namespace: kube-system ---
Add configuration for the custom metrics for
prometheus-adapter:apiVersion: v1 kind: ConfigMap metadata: name: adapter-config namespace: default data: config.yaml: | rules: - seriesQuery: 'http_requests_total{namespace!="",pod!=""}' 1 resources: overrides: namespace: {resource: "namespace"} pod: {resource: "pod"} service: {resource: "service"} name: matches: "^(.*)_total" as: "${1}_per_second" 2 metricsQuery: 'sum(rate(<<.Series>>{<<.LabelMatchers>>}[2m])) by (<<.GroupBy>>)' ---Add configuration for registering
prometheus-adapteras an API service:apiVersion: v1 kind: Service metadata: annotations: service.alpha.openshift.io/serving-cert-secret-name: prometheus-adapter-tls labels: name: prometheus-adapter name: prometheus-adapter namespace: default spec: ports: - name: https port: 443 targetPort: 6443 selector: app: prometheus-adapter type: ClusterIP --- apiVersion: apiregistration.k8s.io/v1beta1 kind: APIService metadata: name: v1beta1.custom.metrics.k8s.io spec: service: name: prometheus-adapter namespace: default group: custom.metrics.k8s.io version: v1beta1 insecureSkipTLSVerify: true groupPriorityMinimum: 100 versionPriority: 100 ---Show the Prometheus Adapter image to use:
$ kubectl get -n openshift-monitoring deploy/prometheus-adapter -o jsonpath="{..image}"
quay.io/openshift-release-dev/ocp-v4.1-art-dev@sha256:76db3c86554ad7f581ba33844d6a6ebc891236f7db64f2d290c3135ba81c264c
Add configuration for deploying
prometheus-adapter:apiVersion: apps/v1 kind: Deployment metadata: labels: app: prometheus-adapter name: prometheus-adapter namespace: default spec: replicas: 1 selector: matchLabels: app: prometheus-adapter template: metadata: labels: app: prometheus-adapter name: prometheus-adapter spec: serviceAccountName: custom-metrics-apiserver containers: - name: prometheus-adapter image: openshift-release-dev/ocp-v4.1-art-dev 1 args: - --secure-port=6443 - --tls-cert-file=/var/run/serving-cert/tls.crt - --tls-private-key-file=/var/run/serving-cert/tls.key - --logtostderr=true - --prometheus-url=http://prometheus-operated.default.svc:9090/ - --metrics-relist-interval=1m - --v=4 - --config=/etc/adapter/config.yaml ports: - containerPort: 6443 volumeMounts: - mountPath: /var/run/serving-cert name: volume-serving-cert readOnly: true - mountPath: /etc/adapter/ name: config readOnly: true - mountPath: /tmp name: tmp-vol volumes: - name: volume-serving-cert secret: secretName: prometheus-adapter-tls - name: config configMap: name: adapter-config - name: tmp-vol emptyDir: {}- 1
image: openshift-release-dev/ocp-v4.1-art-devspecifies the Prometheus Adapter image found in the previous step.
Apply the configuration file to the cluster:
$ oc apply -f deploy.yaml
- Now the application’s metrics are exposed and can be used to configure horizontal pod autoscaling.
Additional resources