
Using JDK Flight Recorder with OpenJDK
Abstract
Making open source more inclusive
Red Hat is committed to replacing problematic language in our code, documentation, and web properties. We are beginning with these four terms: master, slave, blacklist, and whitelist. Because of the enormity of this endeavor, these changes will be implemented gradually over several upcoming releases. For more details, see our CTO Chris Wright’s message.
Providing feedback on Red Hat documentation
We appreciate your feedback on our documentation. To provide feedback, you can highlight the text in a document and add comments.
This section explains how to submit feedback.
Prerequisites
- You are logged in to the Red Hat Customer Portal.
- In the Red Hat Customer Portal, view the document in Multi-page HTML format.
Procedure
To provide your feedback, perform the following steps:
Click the Feedback button in the top-right corner of the document to see existing feedback.
NoteThe feedback feature is enabled only in the Multi-page HTML format.
- Highlight the section of the document where you want to provide feedback.
Click the Add Feedback pop-up that appears near the highlighted text.
A text box appears in the feedback section on the right side of the page.
Enter your feedback in the text box and click Submit.
A documentation issue is created.
- To view the issue, click the issue tracker link in the feedback view.
Chapter 1. Introduction to JDK Flight Recorder
JDK Flight Recorder (JFR) is a low overhead framework for monitoring and profiling Java applications. For more information, see JEP 328: Flight Recorder.
You can collect data from events originating within the JVM and the application code. Data is then written in memory. At first, to thread-local buffer and then promoted to fixed-size global ring buffer before being flushed to JFR files (*.jfr) on the disk. Other applications can consume these files for analysis. For example, the JDK Mission Control (JMC) tool.
1.1. JDK Flight Recorder (JFR) components
You can use JFR functionality to observe events that run inside a JVM, and then create recordings from data collected from these observed events.
The following list details key JFR functionality:
- Recordings
- You can manage system recordings. Each recording has a unique configuration. You can start or stop the recording, or save it to disk on demand.
- Events
You can use events or custom events to trace your Java application’s data and metadata, and then save the data and metadata from either event type in a JFR file. You can use various tools, such as Java Mission Control (JMC),
jcmd, and so on, to view and analyze information stored in a JFR file.The Java Virtual Machine (JVM) has many pre-existing events that are continuously added. An API is available for users to inject custom events into their applications.
You can enable or disable any event when recording to minimize overhead by supplying event configurations. These configurations take the form of
xmldocuments and are called JFR profiles (*.jfc). The OpenJDK comes with the following two profiles for the most common set of use cases:-
default: The default profile is a low-overhead configuration that is safe for continuous use in production environments. Typically, overhead is less than 1%. -
profile: The profile profile is a low-overhead configuration that is ideal for profiling. Typically, overhead is less than 2%.
-
1.2. Benefits of using JDK Flight Recorder
Some of the key benefits of using JDK Flight Recorder (JFR) are:
- JFR allows recording on a running JVM. It is ideal to use JFR in production environments where it is difficult to restart or rebuild the application.
- JFR allows for the definition of custom events and metrics to monitor.
- JFR is built into the JVM to achieve the minimum performance overhead (around 1%).
- JFR uses coherent data modeling to provide better cross-referencing of events and filtering of data.
- JFR allows for monitoring of third-party applications using APIs.
JFR helps in reducing the cost of ownership by:
- Spending less time diagnosing.
- Aiding in troubleshooting problems.
JFR reduces operating costs and business interruptions by:
- Providing faster resolution time.
- Identifying the performance issues which helps in improving system efficiency.
Chapter 2. Introduction to JDK Mission Control
JDK Mission Control (JMC) is a collection of tools to read and analyze JFR files. JMC includes detailed views and graphs that plot JFR events. With JFR analysis, JMC also consists of the following components:
- JMX Console MBean
-
Historical analysis via flight recordings and
hproffiles (as of JMC 7.1.0) - HPROF-dump analyzer
JMC is based on the Eclipse platform. You can extend JMC by adding plug-ins using the Eclipse RCP API and other specific APIs.
You can use JMC and its plug-ins on either Red Hat Enterprise Linux or Microsoft Windows.
For Red Hat Enterprise Linux, the CodeReady Linux Builder (CRB) repository with RHEL 9 provides the JMC package.
The CRB repository is also known as the Builder repository.
You must enable the CRB repository on RHEL 9, so that you can install JMC on RHEL. CRB packages are built with the Source Red Hat Package Manager (SRPM) as productized RHEL packages, so CRB packages receive regular updates.
The CRB is a developer repository that is disabled on RHEL by default. The CRB contains parts of the buildroot root file system that are shipped to your RHEL user account. The buildroot root file system contains developer-level build dependencies for building applications.
For more information about the CRB repository, see The CodeReady Linux Builder repository (Package manifest).
2.1. Downloading and installing JMC
Red Hat OpenJDK builds for Red Hat Enterprise Linux and Microsoft Windows include a version of JDK Mission Control (JMC).
For Red Hat Enterprise Linux, you can use the Red Hat Subscription Manager tool to download and install JMC on your local operating system.
On Microsoft Windows, the JMC package is included with the archive file that you can download from the Red Hat Customer Portal.
After you download and install OpenJDK 8 on Microsoft Windows, you can navigate to the directory that contains the jmc.exe file and then issue the jmc command.
2.1.1. Downloading and installing JMC on RHEL 9
You can download and install JDK Mission Control (JMC) on your local Red Hat Enterprise Linux (RHEL) 9 operating system by using the Red Hat Subscription Manager (RHSM) tool.
Prerequisites
- Downloaded and installed OpenJDK 8.0.372 on RHEL 9.
- Logged in as the root user on your operating system.
- Registered an account on the Red Hat Customer Portal.
- Registered an RHSM account that has an active subscription for providing you access to the OpenJDK 8 repository. For more information about registering your system to your RHSM account, see Registering a system using Red Hat Subscription Management (Using Red Hat Subscription Management).
Procedure
Enable the CodeReady Linux Builder (CRB) repository on RHEL, so that you can install the downloaded JMC package on RHEL. You can enable the CRB repository by completing the following actions:
To enable the CRB repository on RHEL, issue the following RHSM command:
# subscription-manager repos --enable codeready-builder-for-rhel-9-x86_64-rpms
To check the list of modules in the CRB repository, issue the following command:
# yum module list --disablerepo=* --enablerepo=codeready-builder-for-rhel-9-x86_64-rpms
The following example output shows a
javapackages-toolsmodule that is defined in thecommonprofile of the repository:# yum module list --disablerepo=* --enablerepo=codeready-builder-for-rhel-9-x86_64-rpms Updating Subscription Management repositories. Last metadata expiration check: 0:40:08 ago on Tue 02 May 2023 08:49:29 AM EDT. Red Hat CodeReady Linux Builder for RHEL 9 x86_64 (RPMs) Name Stream Profiles Summary javapackages-tools 201801 common Tools and macros for Java packaging support virt-devel rhel Virtualization module Hint: [d]efault, [e]nabled, [x]disabled, [i]nstalled
The previous example also shows a
virt-develmodule that is not assigned to any profile.Install your target package. For example, to install a package called
xz-java, issue the following command and ensure that you follow any CLI command prompts:# yum install xz-java
To start the JMC console on your operating system, choose one of the following options:
Navigate to the directory that contains the JMC executable file, and then issue the following command:
$ jmc -vm /usr/lib/jvm/java-11/bin/java
-
Use your system’s file explorer application to navigate to the JDK Mission Control directory, such as
/usr/bin/jmc, and then double-click the JMC executable file.
2.1.2. Downloading and installing JMC on RHEL 7 or RHEL 8
You can download and install JDK Mission Control (JMC) on your local Red Hat Enterprise Linux(RHEL) 7 or RHEL 8 operating system by using the Red Hat Subscription Manager (RHSM) tool.
Prerequisites
- Downloaded and installed OpenJDK 8.0.372 on your version of RHEL (either RHEL 7 or RHEL 8).
- Logged in as the root user on your operating system.
- Registered an account on the Red Hat Customer Portal.
- Registered an RHSM account that has an active subscription for providing you access to the OpenJDK 8 repository. For more information about registering your system to your RHSM account, see Registering a system using Red Hat Subscription Management (Using Red Hat Subscription Management).
Procedure
To download the JMC package on your version of RHEL, issue the following command.
RHEL 8:
# sudo yum module install jmc:rhel8/common
RHEL 7:
# sudo yum module install jmc:rhel7/common
The previous command uses the Red Hat Subscription Management tool to download the JMC package to your RHEL operating system. This JMC package is available in the
jmcmodule stream of the Red Hat Subscription Management service.
To start the JMC console on your operating system, choose one of the following options:
Navigate to the directory that contains the JMC executable file and then issue the following command:
$ jmc -vm /usr/lib/jvm/java-11/bin/java
-
Use your system’s file explorer application to navigate to the JDK Mission Control directory, such as
/usr/bin/jmc, and then double-click the JMC executable file.
2.2. JDK Mission Control (JMC) Agent
You can use the JMC Agent to add JDK Flight Recorder (JFR) functionality to a running application. You can also use the JMC Agent to add a custom flight recorder event into a running Java Virtual Machine (JVM).
The JMC Agent includes the following capabilities:
- Better control of enabling or disabling generated events when using JFR templates.
-
Efficient timestamp capturing when using the
Timestampclass. - Low memory consumption when generating flight recordings.
The OpenJDK 8.0.372 installation files for Red Hat Enterprise Linux and Microsoft Windows do not include the JMC Agent with the JMC package. You must download and install a third-party version of the JMC Agent, and then check its compatibility with the JMC package for the Red Hat build of OpenJDK on your chosen platform.
Third-party applications, such as the JMC Agent, are not supported by Red Hat. Before you decide to use any third-party applications with Red Hat products, ensure you test the security and trustworthiness of the downloaded software.
The graphical user interface (GUI) for the JMC Agent displays similarly on both Red Hat Enterprise Linux and Microsoft Windows, except for graphical changes introduced by the Standard Widget Toolkit (SWT) for Java that is specific to either platform.
When you have built the JMC Agent, and you have a JMC Agent JAR file, you can access the JMC Agent Plugin in the JVM Browser panel of your JMC console. With this plug-in you can use the JMC Agent functionality on the JMC console, such as configuring the JMC Agent or managing how the JMC Agent interacts with JFR data.
2.3. Starting the JDK Mission Control (JMC) Agent
You can start the JMC Agent by using the JMC Agent Plugin. Red Hat Enterprise Linux and Microsoft Windows support the use of this plug-in.
After you start your JMC Agent, you can configure the agent or manage how the agent interacts with your JFR data.
Prerequisites
-
Downloaded and installed the
jmcpackage on either Red Hat Enterprise Linux or Microsoft Windows - Downloaded the Eclipse Adoptium Agent JAR file. See adoptium/jmc-build (GitHub).
-
Started your Java application with the
--add-opens=java.base/jdk.internal.misc=ALL-UNNAMEDflag. For example,./<your_application> --add-opens=java.base/jdk.internal.misc=ALL-UNNAMED.
Eclipse Adoptium is a community-supported project. Using the agent.jar file from Eclipse Adoptium is not supported with Red Hat production service level agreements (SLAs).
Procedure
Depending on your operating system, choose one of the following methods to start your JMC console:
-
On Red Hat Enterprise Linux, navigate to the directory that contains the executable file, and then issue the
./jmccommand. On Microsoft Windows, navigate to the directory that contains the
jmc.exefile, and then issue thejmccommand.NoteYou can also start your JMC application on either operating system by using your system’s file explorer application to navigate to the JDK Mission Control directory, and then double-click the JMC executable file.
-
On Red Hat Enterprise Linux, navigate to the directory that contains the executable file, and then issue the
- Navigate to the JVM Browser navigation panel. On this panel, you can view any available JVM connections.
-
Expand your target JVM instance, such as
[11.0.13] The JVM Running Mission Control, in the JVM Browser panel. A list of items displays under your target JVM instance. Double-click the JMC Agent item in the navigation panel. A Start JMC Agent window opens in your JMC console:
Figure 2.1. Start JMC Agent window
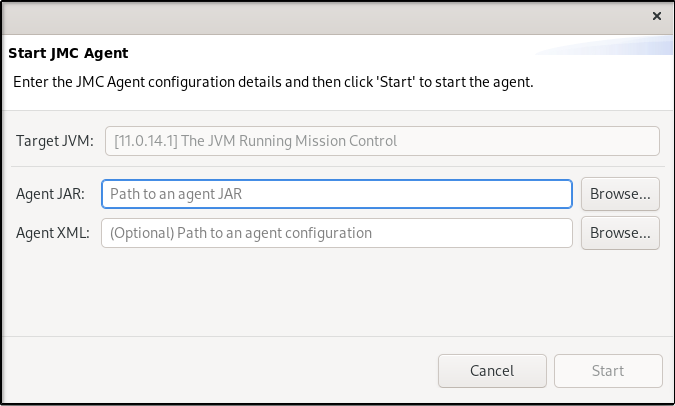
Use the Browse button to add your JMC Agent’s JAR file to the Agent JAR field. The Agent XML field is optional.
NoteYou do not need to enter a value in the Target JVM field, because JMC automatically adds a value based on your selected target JVM instance.
Click the Start button.
JMC adds the Agent Plugin item under your target JVM instance in the JVM Browser navigation panel. The JMC console automatically opens the Agent Live Config pane.
Figure 2.2. Agent Live Config pane
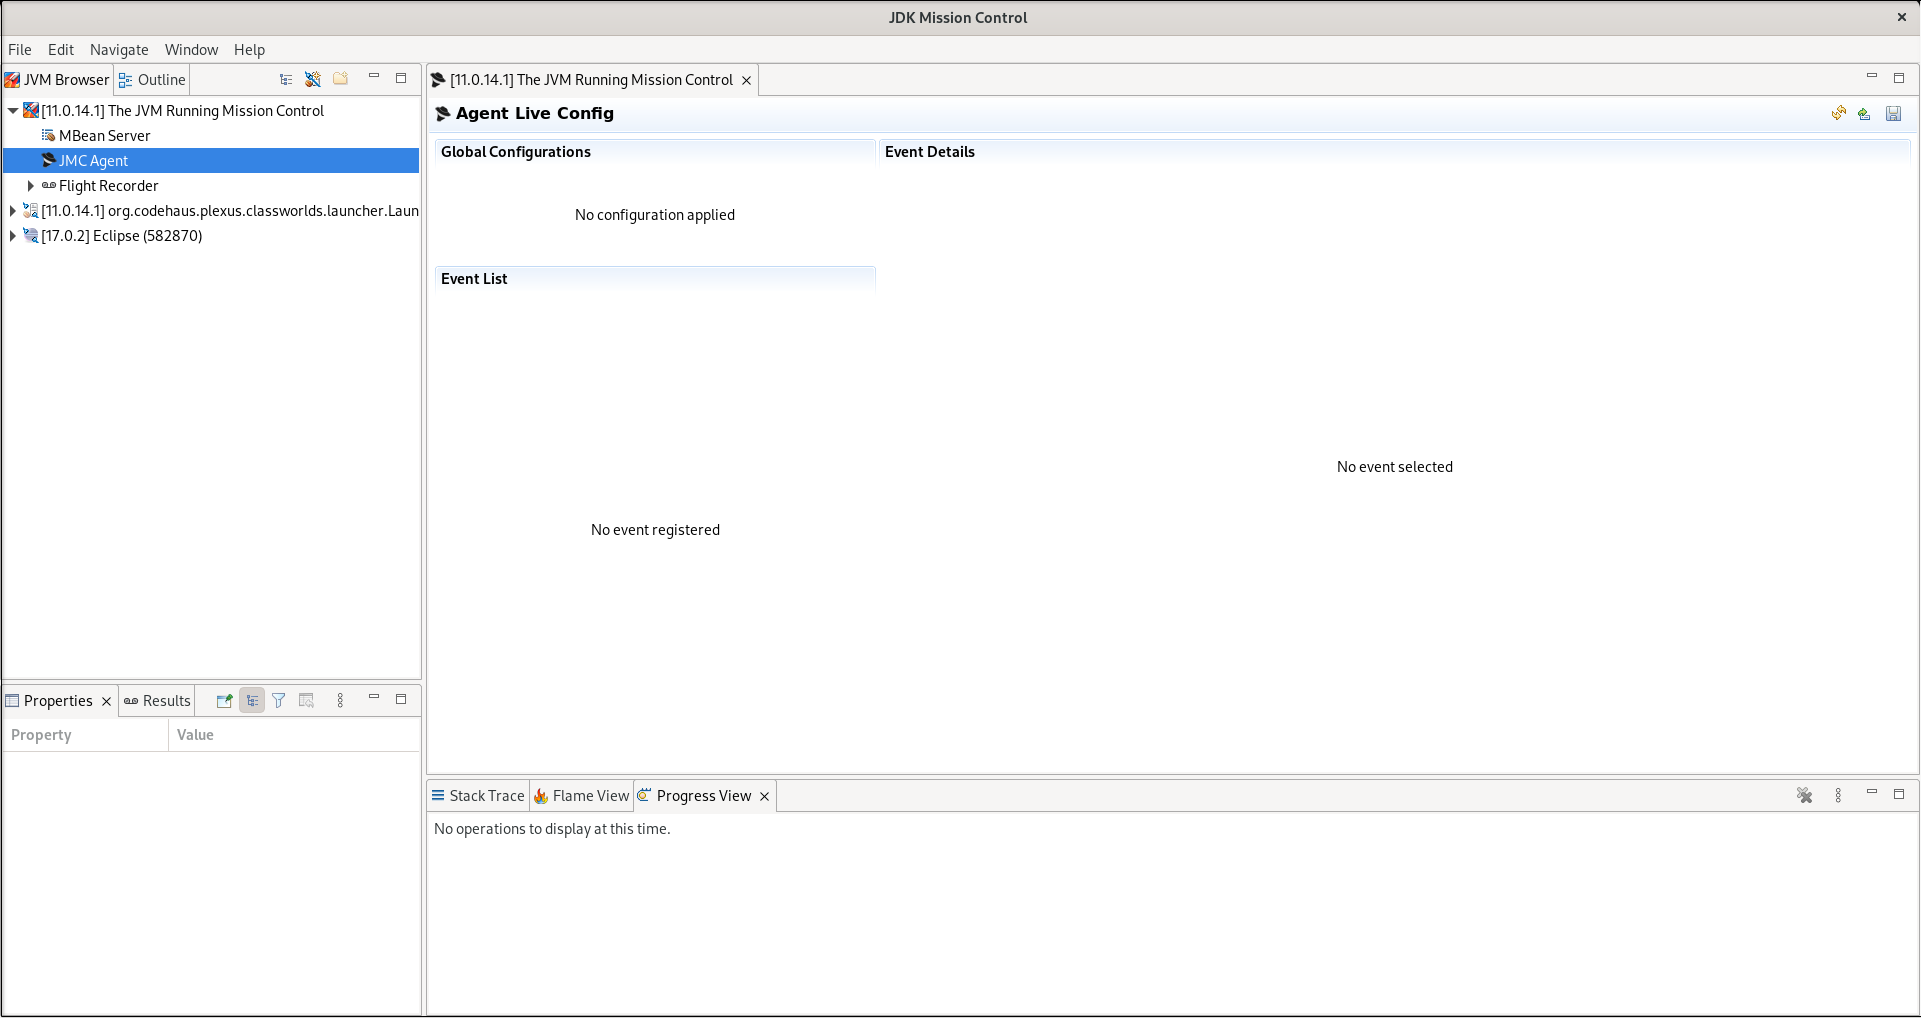
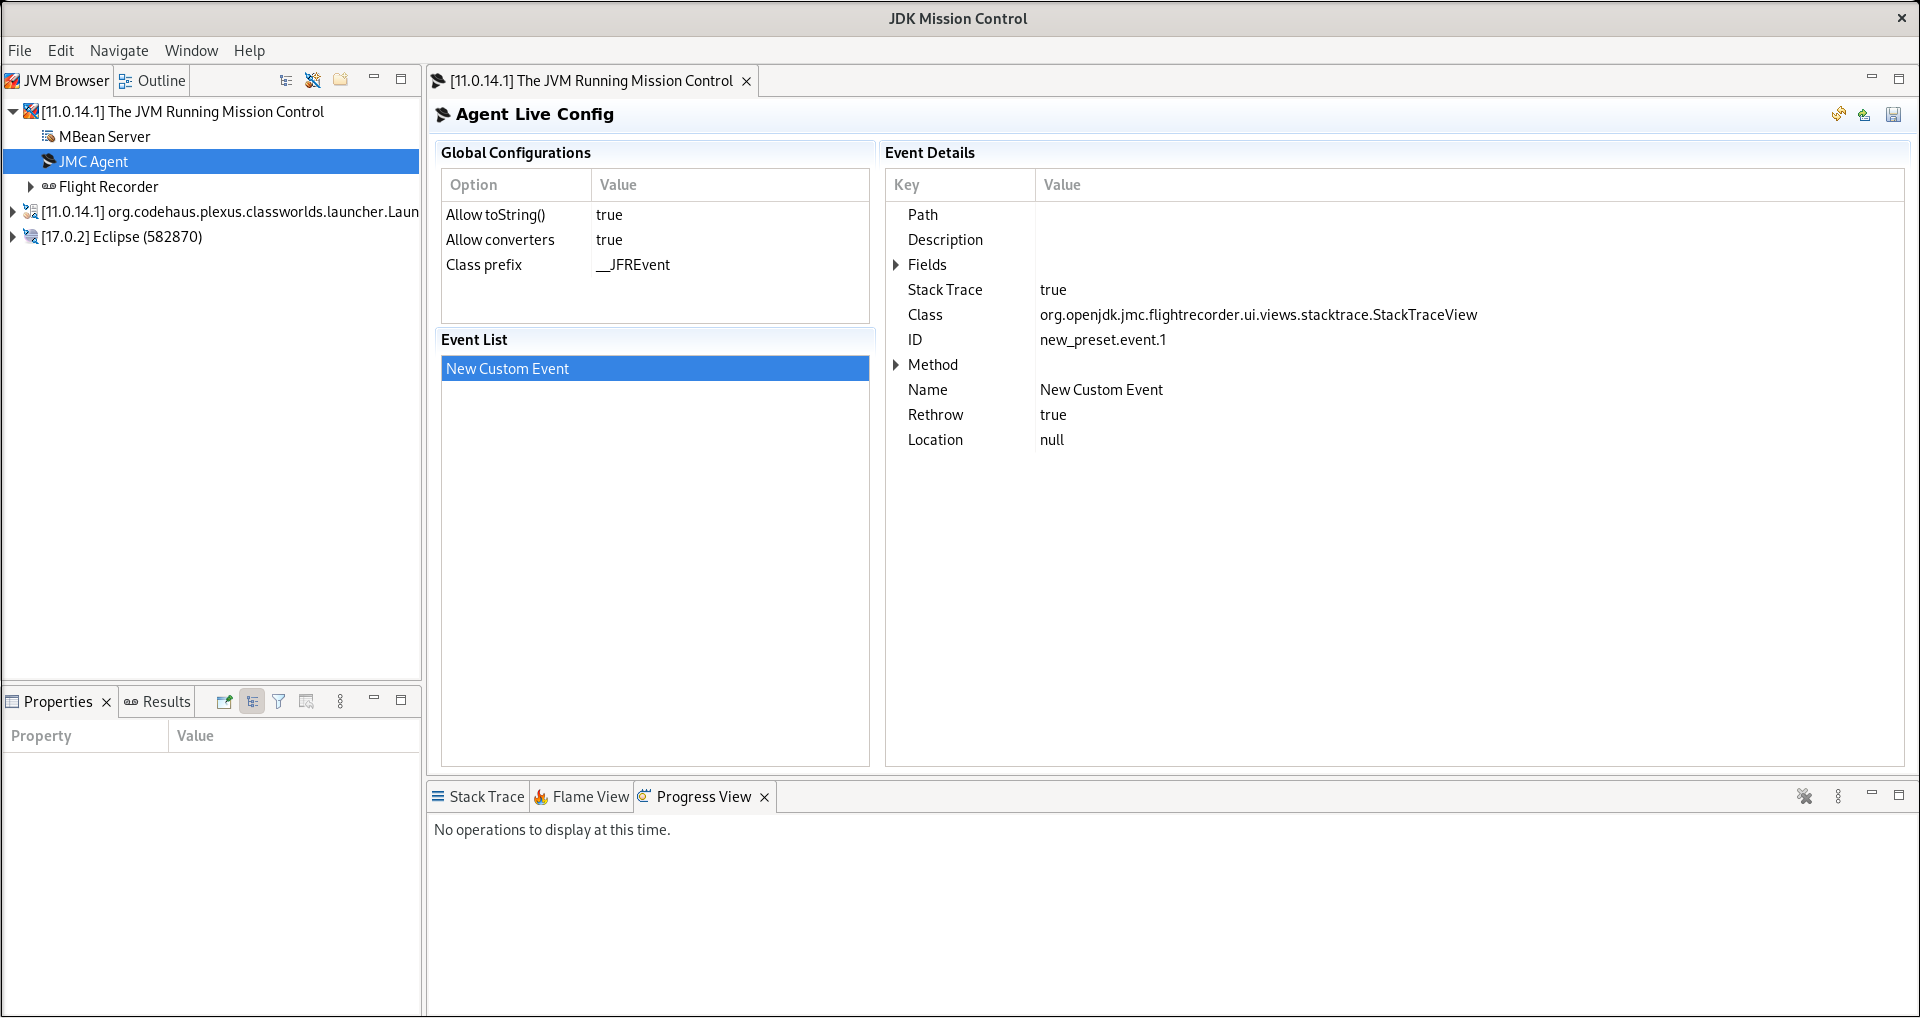
You can now configure your JMC Agent or manage interactions between the JMC Agent and your JFR data. After you generate an XML configuration and then upload it to the JMC console, the Agent Live Config pane displays metadata associated with that XML file.
Figure 2.3. Example of an XML configuration file that has been added to the JMC console
2.4. Creating presets with the JMC Agent
You can configure your JMC Agent instance in the JMC console.
The JMC console provides the following JMC Agent configuration options, to name but a few:
- Create customized presets with the Agent Preset Manager option.
- Import XML configurations into your JMC Agent preset.
-
Use the
defineEventProbesfunction to add an XML description of custom JFR events. - Store active custom JFR events as a preset, so you can retrieve them at a later stage.
Prerequisites
- Started a JMC Agent instance on your JMC console.
Procedure
- You can create a new preset by clicking Window from the menu bar, and then clicking the JMC Agent Preset Manager menu item. A JMC Agent Configuration Preset Manager wizard opens in your JMC console.
Click the Add button to access the Edit Preset Global Configurations window.
Figure 2.4. Edit Preset Global Configurations window
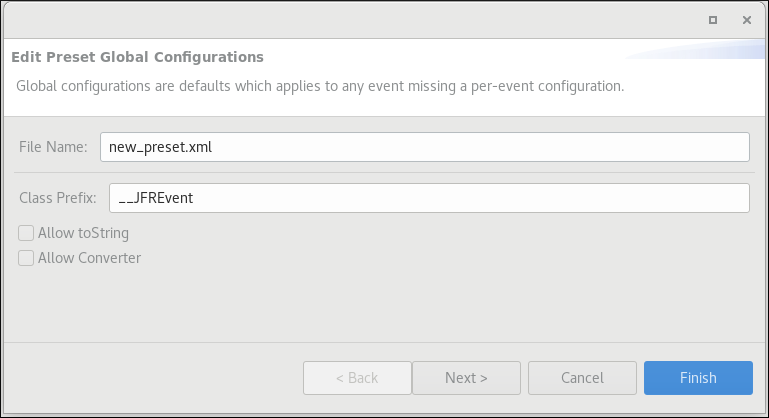
From this window, you can enter a name for your preset. Optionally, you can enter a class prefix for any events that you want to inject into your target JVM. You can also select the AllowtoString check box and the Allow Converter check box.
Click the Next button. An Add or Remove Preset Events window opens. From this window, you can add new events, edit events, or remove events for your preset.
Figure 2.5. Add or Remove Preset Events
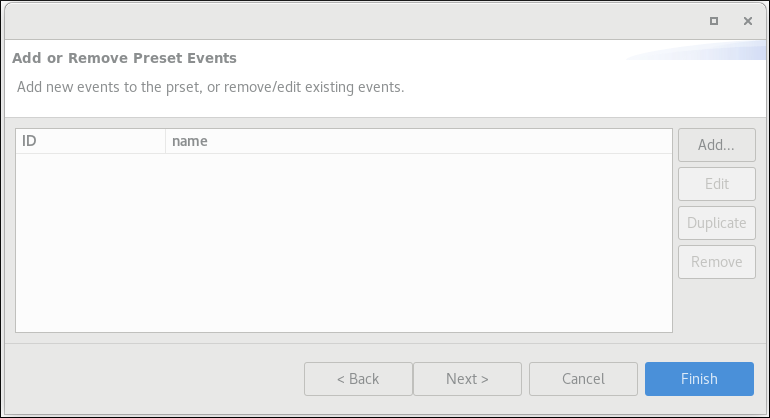
Follow the wizard’s instructions, where you can complete the following steps:
- Edit Event Configurations
- Edit a Parameter or Return Value step
Edit a Parameter or Return Value Capturing
TipYou can select any of the available buttons on each wizard step to complete your desired configuration, such as Add, Remove, and so on. You can click the Back button at any stage to edit a previous wizard step.
- Click the Finish button to return to the Add or Remove Preset Events window.
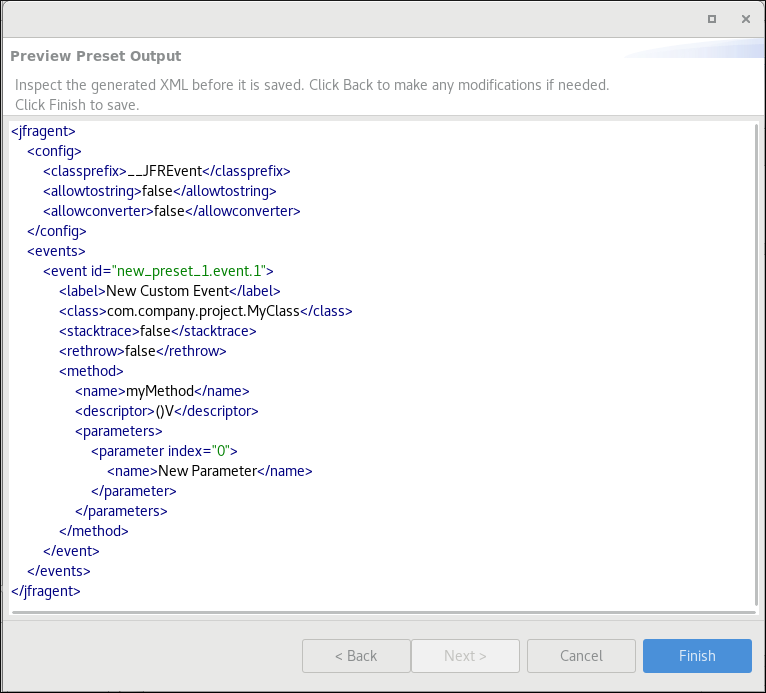
- Click Next. A Preview Preset Output window opens.
Review the generated XML data before clicking the Finish button:
Figure 2.6. Preview Preset Output
- Click the Load preset button on the top-right side of the JMC console window, and then upload your preset to the JMC application.
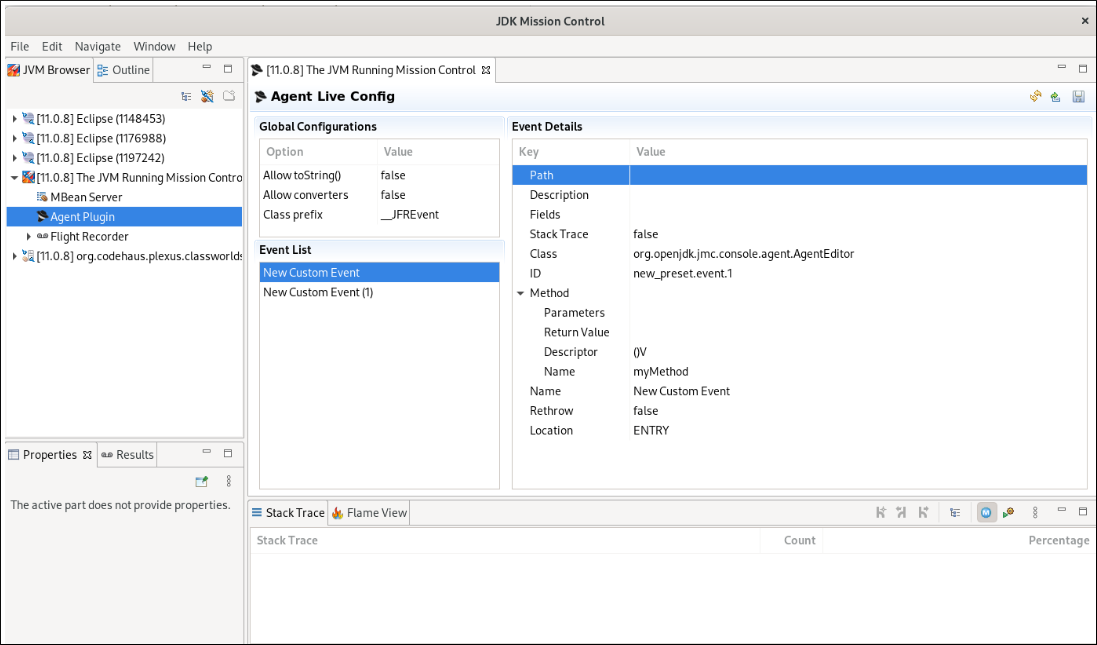
On the JMC Agent Configuration Preset Manager window, click the OK button to load your preset into your target JVM. The Agent Live Present panel on your JMC console shows your active agent configuration and any of its injected events. For example:
Figure 2.7. Example output on the Agent Live Present pane
Additional resources
- For information about JMC XML attributes, see JMC Agent Plugin attributes.
2.5. JMC Agent Plugin attributes
The JMC console supports many attributes in the form of buttons, drop-down lists, text fields, and so on. You can use specific JMC Agent attributes to configure your agent.
The following tables outline categories of attributes that you can use to configure your JMC Agent, so that you can use the agent to monitor JFR data specific to your needs.
Table 2.1. List of configuration attributes for use with your JMC Agent.
| Attribute | Description |
|---|---|
|
| Determines if the JMC Agent can use converters. With converters enabled, you can convert custom data types or objects to JFR content types. JFR can then record these types alongside the custom events. |
|
| Determines if the JMC Agent can record arrays and object parameters as strings.
Note: Check that the |
|
|
Determines the prefix for injected events. For example: |
|
| Contains the configuration options for the JMC Agent. |
|
|
Begins the event definition. The |
Table 2.2. List of event type attributes for use with your JMC Agent.
| Attribute | Description |
|---|---|
|
| Defines the class that receives event types from the method. |
|
| Describes the event type. |
|
| Lists the set of events that the agent injects into a defined method.The event tag requires an ID. The JFR uses the event tag for the custom event. |
|
| Defines the name of the event type. |
|
|
Determines the location in the method that receives injected events. For example: |
|
| Path that points to the location that stores custom events. This path relates to any events listed under the JVM Browser navigation panel on the JMC console. |
|
|
Defines the method that receives injected events. The
|
|
| Determines whether the event type records a stack trace. |
Table 2.3. List of custom caption attributes for use with your JMC Agent.
| Attribute | Description |
|---|---|
|
| Qualified name of the converter class that converts an attribute to a JFR data type. |
|
| Defines the JFR content type that the converter attribute receives. |
|
| The description of the custom caption attribute. |
|
| Optional attribute. Lists method parameters based on the index value assigned to a parameter tag. |
|
| The name of the custom caption attribute. |
Table 2.4. List of field capturing attributes for use with your JMC Agent.
| Attribute | Description |
|---|---|
|
| The description of the field that you want to capture. |
|
| Defines an expression that the agent analyzes to locate a defined field. |
|
| Determines class field values that the JMC Agent captures and emits with any defined event types. |
|
| The name of the class field capturing attribute . |
Chapter 3. Starting JDK Flight Recorder
3.1. Starting JDK Flight Recorder when JVM starts
You can start the JDK Flight Recorder (JFR) when a Java process starts. You can modify the behavior of the JFR by adding optional parameters.
Procedure
Run the
javacommand using the--XXoption.$java -XX:StartFlightRecording Demowhere Demo is the name of the Java application.
The JFR starts with the Java application.
Example
The following command starts a Java process (Demo) and with it initiates an hour-long flight recording which is saved to a file called demorecording.jfr:
$ java -XX:StartFlightRecording=duration=1h,filename=demorecording.jfr Demo
Additional resources
- For a detailed list of JFR options, see Java tools reference.
3.2. Starting JDK Flight Recorder on a running JVM
You can use the jcmd utility to send diagnostic command requests to a running JVM. jcmd includes commands for interacting with JFR, with the most basic commands being start, dump, and stop.
To interact with a JVM, jcmd requires the process id (pid) of the JVM. You can retrieve the by using the jcmd -l command which displays a list of the running JVM process ids, as well as other information such as the main class and command-line arguments that were used to launch the processes.
The jcmd utility is located under $JAVA_HOME/bin.
Procedure
Start a flight recording using the following command:
$jcmd <pid> JFR.start <options>For example, the following command starts a recording named
demorecording, which keeps data from the last four hours, and has size limit of 400 MB:$jcmd <pid> JFR.start name=demorecording maxage=4h maxsize=400MB
Additional resources
-
For a detailed list of
jcmdoptions, see jcmd Tools Reference.
3.3. Starting the JDK Flight Recorder on JVM by using the JDK Mission Control application
The JDK Mission Control (JMC) application has a Flight Recording Wizard that allows for a streamlined experience of starting and configuring flight recordings.
Procedure
Open the JVM Browser.
$JAVA_HOME/bin/jmcRight-click a JVM in JVM Browser view and select
Start Flight Recording.The Flight Recording Wizard opens.
Figure 3.1. JMC JFR Wizard
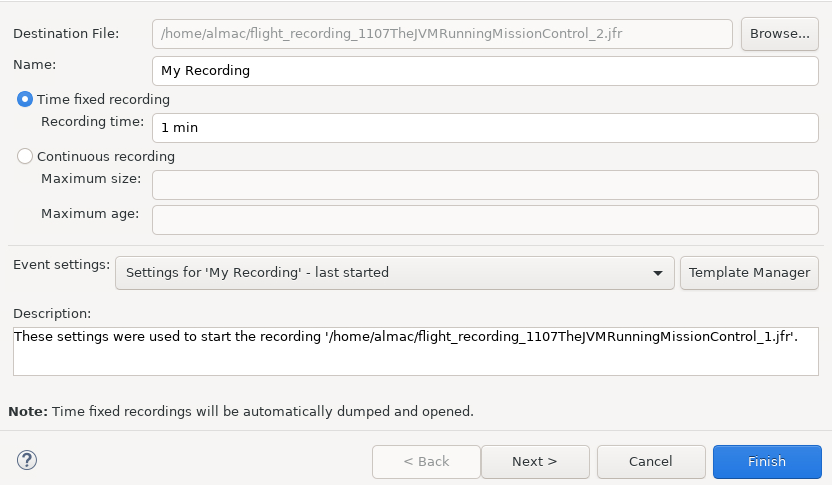
The JDK Flight Recording Wizard has three pages:
The first page of the wizard contains general settings for the flight recording including:
- Name of the recording
- Path and filename to which the recording is saved
- Whether the recording is a fixed-time or continuous recording, which event template will be used
- Description of the recording
- The second page contains event options for the flight recording. You can configure the level of detail that Garbage Collections, Memory Profiling, and Method Sampling and other events record.
- The third page contains settings for the event details. You can turn events on or off, enable the recording of stack traces, and alter the time threshold required to record an event.
- Edit the settings for the recording.
Click
Finish.The wizard exits and the flight recording starts.
3.4. Defining and using the custom event API
The JDK Flight Recorder (JFR) is an event recorder that includes the custom event API. The custom event API, stored in the jdk.jfr module, is the software interface that enables your application to communicate with the JFR.
The JFR API includes classes that you can use to manage recordings and create custom events for your Java application, JVM, or operating system.
Before you use the custom event API to monitor an event, you must define a name and metadata for your custom event type.
You can define a JFR base event, such as a Duration, Instant, Requestable, or Time event, by extending the Event class. Specifically, you can add fields, such as duration values, to the class that matches data types defined by the application payload attributes. After you define an Event class, you can create event objects.
This procedure demonstrates how to use a custom event type with JFR and JDK Mission Control (JMC) to analyze the runtime performance of a simple example program.
Procedure
In your custom event type, in the
Eventclass, use the@nameannotation to name the custom event. This name displays in the JMC graphical user interface (GUI).Example of defining a custom event type name in the
Eventclass@Name(“SampleCustomEvent”) public class SampleCustomEvent extends Event {...}Define the metadata for your
Eventclass and its attributes, such as name, category, and labels. Labels display event types for a client, such as JMC.NoteLarge recording files might cause performance issues, and this might affect how you would like to interact with the files. Make sure you correctly define the number of event recording annotations you need. Defining unnecessary annotations might increase the size of your recording files.
Example of defining annotations for a sample
Eventclass@Name(“SampleCustomEvent”) 1 @Label("Sample Custom Event") @Category("Sample events") @Description("Custom Event to demonstrate the Custom Events API") @StackTrace(false) 2 public class SampleCustomEvent extends Event { @Label("Method") 3 public String method; @Label("Generated Number") public int number; @Label("Size") @DataAmount 4 public int size; }
- 1
- Details annotations, such as
@Name, that define metadata for how the custom event displays on the JMC GUI. - 2
- The
@StackTraceannotation increases the size of a flight recording. By default, the JFR does not include thestackTraceof the location that was created for the event. - 3
- The
@Labelannotations define parameters for each method, such as resource methods for HTTP requests. - 4
- The
@DataAmountannotation includes an attribute that defines the data amount in bits of bytes. JMC automatically renders the data amount in other units, such as megabytes (MB).
Define contextual information in your
Eventclass. This information sets the request handling behavior of your custom event type, so that you configure an event type to collect specific JFR data.Example of defining a simple
mainclass and an event looppublic class Main { private static int requestsSent; public static void main(String[] args) { // Register the custom event FlightRecorder.register(SampleCustomEvent.class); // Do some work to generate the events while (requestsSent <= 1000) { try { eventLoopBody(); Thread.sleep(100); } catch (Exception e) { e.printStackTrace(); } } } private static void eventLoopBody() { // Create and begin the event SampleCustomEvent event = new SampleCustomEvent(); event.begin(); // Generate some data for the event Random r = new Random(); int someData = r.nextInt(1000000); // Set the event fields event.method = "eventLoopBody"; event.number = someData; event.size = 4; // End the event event.end(); event.commit(); requestsSent++; }In the preceding example, the simple
mainclass registers events, and the event loop populates the event fields and then emits the custom events.Examine an event type in the application of your choice, such as the JMC or the JFR tool.
Figure 3.2. Example of examining an event type in JMC
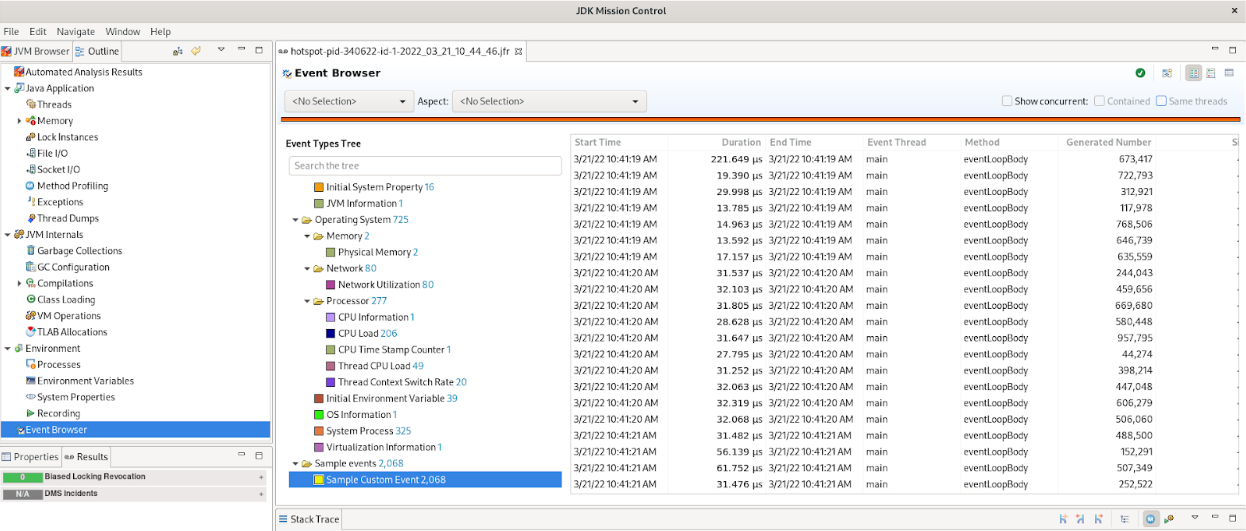
A JFR recording can include different event types. You can examine each event type in your application.
Additional resources
- For more information about JMC, see Introduction to JDK Mission Control.
Chapter 4. Configuration options for JDK Flight Recorder
You can configure JDK Flight Recorder (JFR) to capture various sets of events using the command line or diagnostic commands.
4.1. Configure JDK Flight Recorder using the command line
You can configure JDK Flight Recorder (JFR) from the command line using the following options:
4.1.1. Start JFR
Use -XX:StartFlightRecording option to start a JFR recording for the Java application. For example:
java -XX:StartFlightRecording=delay=5s,disk=false,dumponexit=true,duration=60s,filename=myrecording.jfr <<YOUR_JAVA_APPLICATION>>
You can set the following parameter=value entries when starting a JFR recording:
- delay=time
- Use this parameter to specify the delay between the Java application launch time and the start of the recording. Append s to specify the time in seconds, m for minutes, h for hours, or d for days. For example, specifying 10m means 10 minutes. By default, there is no delay, and this parameter is set to 0.
- disk={true|false}
-
Use this parameter to specify whether to write data to disk while recording. By default, this parameter is
true. - dumponexit={true|false}
-
Use this parameter to specify if the running recording is dumped when the JVM shuts down. If the parameter is enabled and a file name is not set, the recording is written to a file in the directory where the recording progress has started. The file name is a system-generated name that contains the process ID, recording ID, and current timestamp. For example, hotspot-pid-47496-id-1-2018_01_25_19_10_41.jfr. By default, this parameter is
false. - duration=time
- Use this parameter to specify the duration of the recording. Append s to specify the time in seconds, m for minutes, h for hours, or d for days. For example, if you specify duration as 5h, it indicates 5 hours. By default, this parameter is set to 0, which means there is no limit set on the recording duration.
- filename=path
Use this parameter to specify the path and name of the recording file. The recording is written to this file when stopped. For example:
· recording.jfr
· /home/user/recordings/recording.jfr
- name=identifier
- Use this parameter to specify both the name and the identifier of a recording.
- maxage=time
- Use this parameter to specify the maximum number of days the recording should be available on the disk. This parameter is valid only when the disk parameter is set to true. Append s to specify the time in seconds, m for minutes, h for hours, or d for days. For example, when you specify 30s, it indicates 30 seconds. By default, this parameter is set to 0, which means there is no limit set.
- maxsize=size
-
Use this parameter to specify the maximum size of disk data to keep for the recording. This parameter is valid only when the disk parameter is set to true. The value must not be less than the value for the
maxchunksizeparameter set with-XX:FlightRecorderOptions. Append m or M to specify the size in megabytes, or g or G to specify the size in gigabytes. By default, the maximum size of disk data isn’t limited, and this parameter is set to 0. - path-to-gc-roots={true|false}
Use this parameter to specify whether to collect the path to garbage collection (GC) roots at the end of a recording. By default, this parameter is set to false.
The path to GC roots is useful for finding memory leaks. For OpenJDK 8, you can enable the
OldObjectSampleevent which is a more efficient alternative than using heap dumps. You can also use theOldObjectSampleevent in production. Collecting memory leak information is time-consuming and incurs extra overhead. You should enable this parameter only when you start recording an application that you suspect has memory leaks. If the JFR profile parameter is set to profile, you can trace the stack from where the object is leaking. It is included in the information collected.- settings=path
- Use this parameter to specify the path and name of the event settings file (of type JFC). By default, the default.jfc file is used, which is located in JAVA_HOME/lib/jfr. This default settings file collects a predefined set of information with low overhead, so it has minimal impact on performance and can be used with recordings that run continuously. The second settings file is also provided, profile.jfc, which provides more data than the default configuration, but can have more overhead and impact performance. Use this configuration for short periods of time when more information is needed.
You can specify values for multiple parameters by separating them with a comma. For example, -XX:StartFlightRecording=disk=false,name=example-recording.
4.1.2. Control behavior of JFR
Use -XX:FlightRecorderOptions option to sets the parameters that control the behavior of JFR. For example:
java -XX:FlightRecorderOptions=duration=60s,filename=myrecording.jfr -XX:FlightRecorderOptions=stackdepth=128,maxchunksize=2M <<YOUR_JAVA_APPLICATION>>
You can set the following parameter=value entries to control the behavior of JFR:
- globalbuffersize=size
-
Use this parameter to specify the total amount of primary memory used for data retention. The default value is based on the value specified for
memorysize. You can change thememorysizeparameter to alter the size of global buffers. - maxchunksize=size
- Use this parameter to specify the maximum size of the data chunks in a recording. Append m or M to specify the size in megabytes (MB), or g or G to specify the size in gigabytes (GB). By default, the maximum size of data chunks is set to 12 MB. The minimum size allowed is 1 MB.
- memorysize=size
-
Use this parameter to determine how much buffer memory should be used. The parameter sets the
globalbuffersizeandnumglobalbuffersparameters based on the size specified. Append m or M to specify the size in megabytes (MB), or g or G to specify the size in gigabytes (GB). By default, the memory size is set to 10 MB. - numglobalbuffers=number
-
Use this parameter to specify the number of global buffers used. The default value is based on the size specified in the
memorysizeparameter. You can change thememorysizeparameter to alter the number of global buffers. - old-object-queue-size=number-of-objects
- Use this parameter to track the maximum number of old objects. By default, the number of objects is set to 256.
- repository=path
- Use this parameter to specify the repository for temporary disk storage. By default, it uses system temporary directory.
- retransform={true|false}
-
Use this parameter to specify if event classes should be retransformed using JVMTI. If set to
false, instrumentation is added to loaded event classes. By default, this parameter is set totruefor enabling class retransformation. - samplethreads={true|false}
-
Use this parameter to specify whether thread sampling is enabled. Thread sampling only occurs when the sampling event is enabled and this parameter is set to
true. By default, this parameter is set totrue. - stackdepth=depth
- Use this parameter to set the stack depth for stack traces. By default, the stack depth is set to 64 method calls. You can set the maximum stack depth to 2048. Values greater than 64 could create significant overhead and reduce performance.
- threadbuffersize=size
- Use this parameter to specify the local buffer size for a thread. By default, the local buffer size is set to 8 kilobytes, with a minimum value of 4 kilobytes. Overriding this parameter could reduce performance and is not recommended.
You can specify values for multiple parameters by separating them with a comma.
4.2. Configuring JDK Flight Recorder using diagnostic command (JCMD)
You can configure JDK Flight Recorder (JFR) using Java diagnostic command. The simplest way to execute a diagnostic command is to use the jcmd tool which is located in the Java installation directory. To use a command, you have to pass the process identifier of the JVM or the name of the main class, and the actual command as arguments to jcmd. You can retrieve the JVM or the name of the main class by running jcmd without arguments or by using jps. The jps(Java Process Status) tool lists JVMs on a target system to which it has access permissions.
To see a list of all running Java processes, use the jcmd command without any arguments. To see a complete list of commands available for a running Java application, specify help as the diagnostic command after the process identifier or the name of the main class.
Use the following diagnostic commands for JFR:
4.2.1. Start JFR
Use JFR.start diagnostic command to start a flight recording. For example:
jcmd <PID> JFR.start delay=10s duration=10m filename=recording.jfr
Table 4.1. The following table lists the parameters you can use with this command:
| Parameter | Description | Data type | Default value |
|---|---|---|---|
| name | Name of the recording | String | - |
| settings | Server-side template | String | - |
| duration | Duration of recording | Time | 0s |
| filename | Resulting recording file name | String | - |
| maxage | Maximum age of buffer data | Time | 0s |
| maxsize | Maximum size of buffers in bytes | Long | 0 |
| dumponexit | Dump running recording when JVM shuts down | Boolean | - |
| path-to-gc-roots | Collect path to garbage collector roots | Boolean | False |
4.2.2. Stop JFR
Use JFR.stop diagnostic command to stop running flight recordings. For example:
jcmd <PID> JFR.stop name=output_file
Table 4.2. The following table lists the parameters you can use with this command.
| Parameter | Description | Data type | Default value |
|---|---|---|---|
| name | Name of the recording | String | - |
| filename | Copy recording data to the file | String | - |
4.2.3. Check JFR
Use JFR.check command to show information about the recordings which are in progress. For example:
jcmd <PID> JFR.check
Table 4.3. The following table lists the parameters you can use with this command.
| Parameter | Description | Data type | Default value |
|---|---|---|---|
| name | Name of the recording | String | - |
| filename | Copy recording data to the file | String | - |
| maxage | Maximum duration to dump file | Time | 0s |
| maxsize | Maximum amount of bytes to dump | Long | 0 |
| begin | Starting time to dump data | String | - |
| end | Ending time to dump data | String | - |
| path-to-gc-roots | Collect path to garbage collector roots | Boolean | false |
4.2.4. Dump JFR
Use JFR.dump diagnostic command to copy the content of a flight recording to a file. For example:
jcmd <PID> JFR.dump name=output_file filename=output.jfr
Table 4.4. The following table lists the parameters you can use with this command.
| Parameter | Description | Data type | Default value |
|---|---|---|---|
| name | Name of the recording | String | - |
| filename | Copy recording data to the file | String | - |
| maxage | Maximum duration to dump file | Time | 0s |
| maxsize | Maximum amount of bytes to dump | Long | 0 |
| begin | Starting time to dump data | String | - |
| end | Ending time to dump data | String | - |
| path-to-gc-roots | Collect path to garbage collector roots | Boolean | false |
4.2.5. Configure JFR
Use JFR.configure diagnostic command to configure the flight recordings. For example:
jcmd <PID> JFR.configure repositorypath=/home/jfr/recordings
Table 4.5. The following table lists the parameters you can use with this command.
| Parameter | Description | Data type | Default value |
|---|---|---|---|
| repositorypath | Path to repository | String | - |
| dumppath | Path to dump | String | - |
| stackdepth | Stack depth | Jlong | 64 |
| globalbuffercount | Number of global buffers | Jlong | 32 |
| globalbuffersize | Size of a global buffer | Jlong | 524288 |
| thread_buffer_size | Size of a thread buffer | Jlong | 8192 |
| memorysize | Overall memory size | Jlong | 16777216 |
| maxchunksize | Size of an individual disk chunk | Jlong | 12582912 |
| Samplethreads | Activate thread sampling | Boolean | true |
Revised on 2023-05-11 17:05:07 UTC