
Chapter 1. Features
Open Liberty 21.0.0.6 brings improvements to the MicroProfile Metrics feature, allowing for information gathered via the Request Timing feature to be displayed on the metrics endpoint, plus a number of significant bug fixes.
In Open Liberty 21.0.0.6:
1.1. Run your apps using 21.0.0.6
If you’re using Maven, here are the coordinates:
<dependency>
    <groupId>io.openliberty</groupId>
    <artifactId>openliberty-runtime</artifactId>
    <version>21.0.0.6</version>
    <type>zip</type>
</dependency>
Or for Gradle:
dependencies {
    libertyRuntime group: 'io.openliberty', name: 'openliberty-runtime', version: '[21.0.0.6,)'
}
Or if you’re using Docker:
FROM open-liberty
1.1.1. Request Timing now supported by MicroProfile Metrics
The request timing feature (requestTiming-1.0) is used to keep track of the slow and hung requests for servlet requests with a RequestTimingStats MXBean. The Microprofile Metrics features (mpMetrics-X.X) on the other hand provides vendor metrics that are distinct to the Open Liberty runtime.
Starting with the Open Liberty 21.0.0.6 the RequestTimingStats MXBean will now have its data retrieved by the MicroProfile Metrics feature for reporting on the /metrics (or /metrics/vendor) endpoint. This functionality is compatible with both the 2.X and 3.X MicroProfile Metrics features.
The following example shows a sample output of the new request timing metrics:
# TYPE vendor_requestTiming_activeRequestCount gauge
# HELP vendor_requestTiming_activeRequestCount The number of servlet requests currently running.
vendor_requestTiming_activeRequestCount 1

# TYPE vendor_requestTiming_requestCount_total counter
# HELP vendor_requestTiming_requestCount_total The number of servlet requests since the server started.
vendor_requestTiming_requestCount_total 3

# TYPE vendor_requestTiming_hungRequestCount gauge
# HELP vendor_requestTiming_hungRequestCount The number of servlet requests that are currently running but are hung.
vendor_requestTiming_hungRequestCount 0

# TYPE vendor_requestTiming_slowRequestCount gauge
# HELP vendor_requestTiming_slowRequestCount The number of servlet requests that are currently running but are slow.
vendor_requestTiming_slowRequestCount 0
To be able to retrieve request timing metrics from /metrics you must enable both the requestTiming-1.0 feature in combination with one of the following MicroProfile Metric features: mpMetrics-2.0, mpMetrics-2.2 or mpMetrics-2.3 or mpMetric-3.0.
The metrics you receive depend on the configuration of the request timing thresholds for slow or hung requests. The following example demonstrates enabling request timing metrics for mpMetrics-3.0, with a sample threshold configuration for both slow and hung servlet requests.
<featureManager>
<feature>mpMetrics-3.0</feature>
<feature>requestTiming-1.0</feature>
<!-- other features omitted for brevity -->
</featureManager>
<requestTiming sampleRate="1" slowRequestThreshold="10s">
<servletTiming
slowRequestThreshold="2s"
hungRequestThreshold="10s"/>
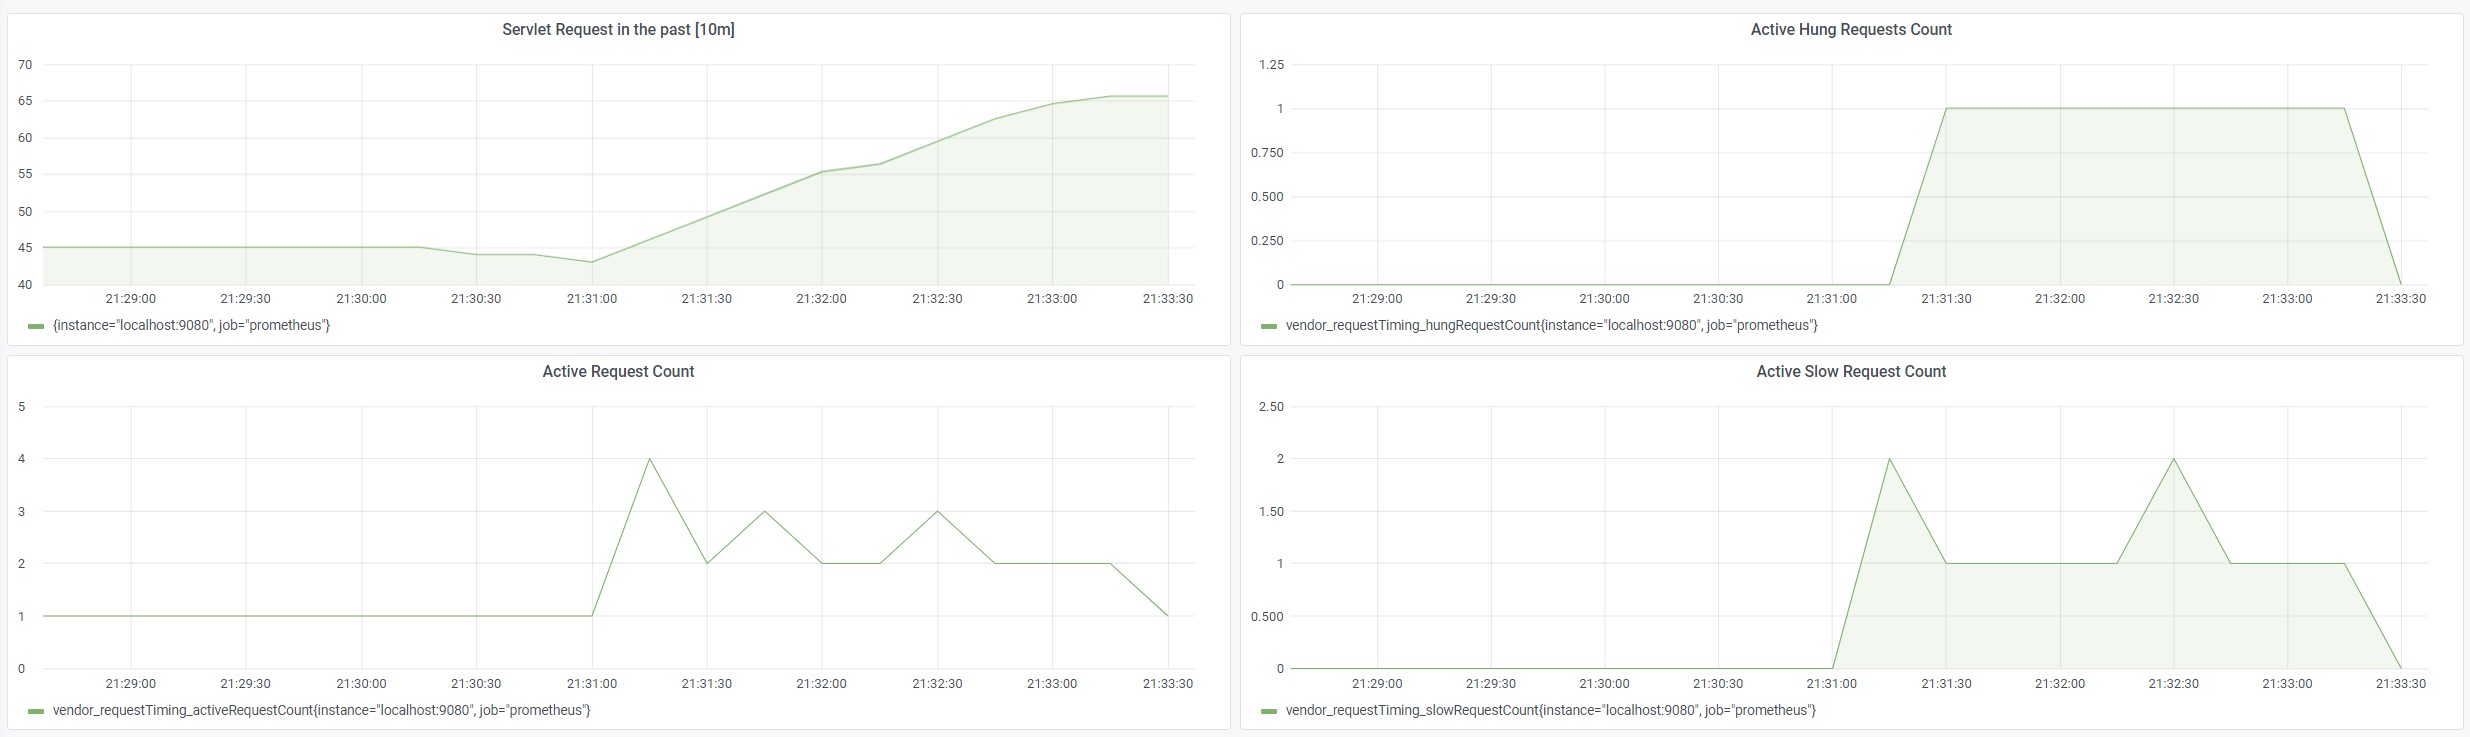
</requestTiming>The following screenshot illustrates the four new metrics in Grafana.
For more information about Request Timing with MicroProfile Metrics, see the following links: