
Chapter 3. Analyzing applications with the web console
In order to use the web console to analyze applications, you must create a project. Each project is a way to group applications for analysis and specifies the settings to use during the analysis of its applications. The analysis process generates reports that provide information about the changes necessary for a migration or modernization effort.
Follow these steps to use the web console to analyze your applications and review the results.
- Add a project.
- Add applications to the project.
- Specify the analysis configuration.
- Execute the analysis.
- View the results of the analysis.
Click the Projects link at the top of the web console to return to the project list at any time. Visit the help menu for an About page and a link to the MTA documentation.
3.1. Adding a project
When you first access the web console, you will be prompted to set up a new project.
Figure 3.1. Home
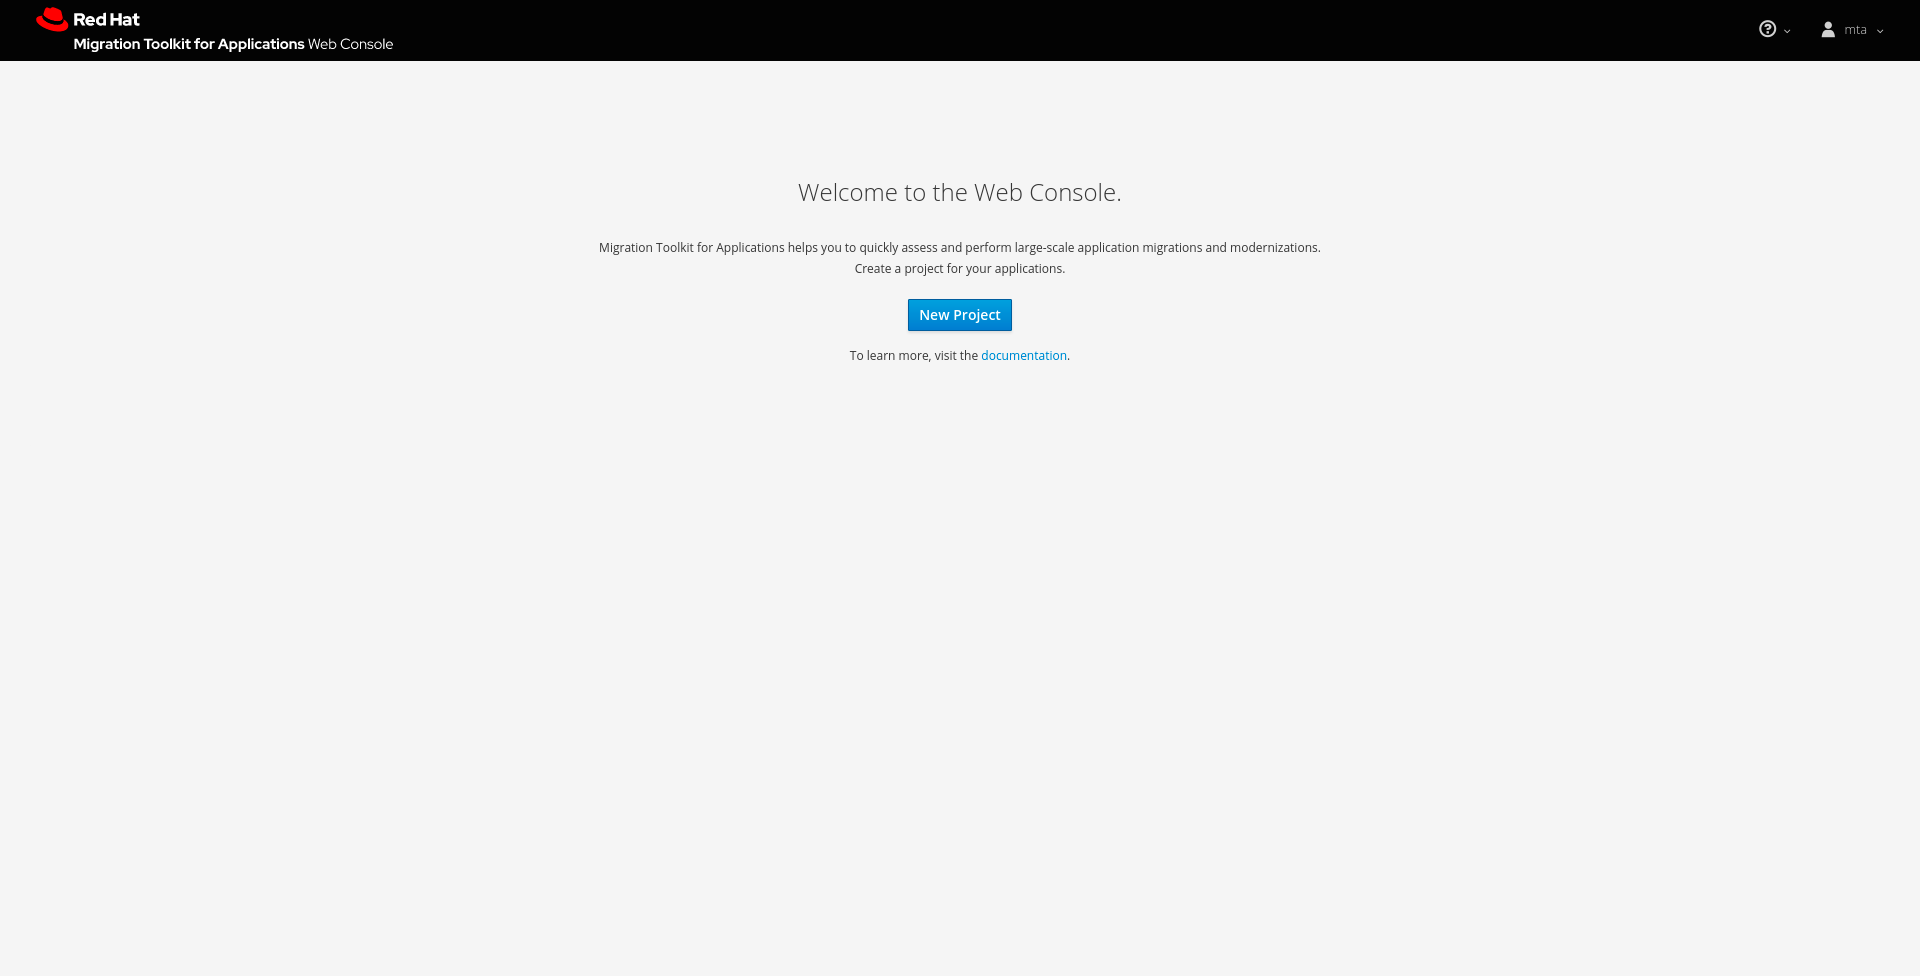
Click the New Project button to launch the wizard to set up a new migration project.
Figure 3.2. Adding a project
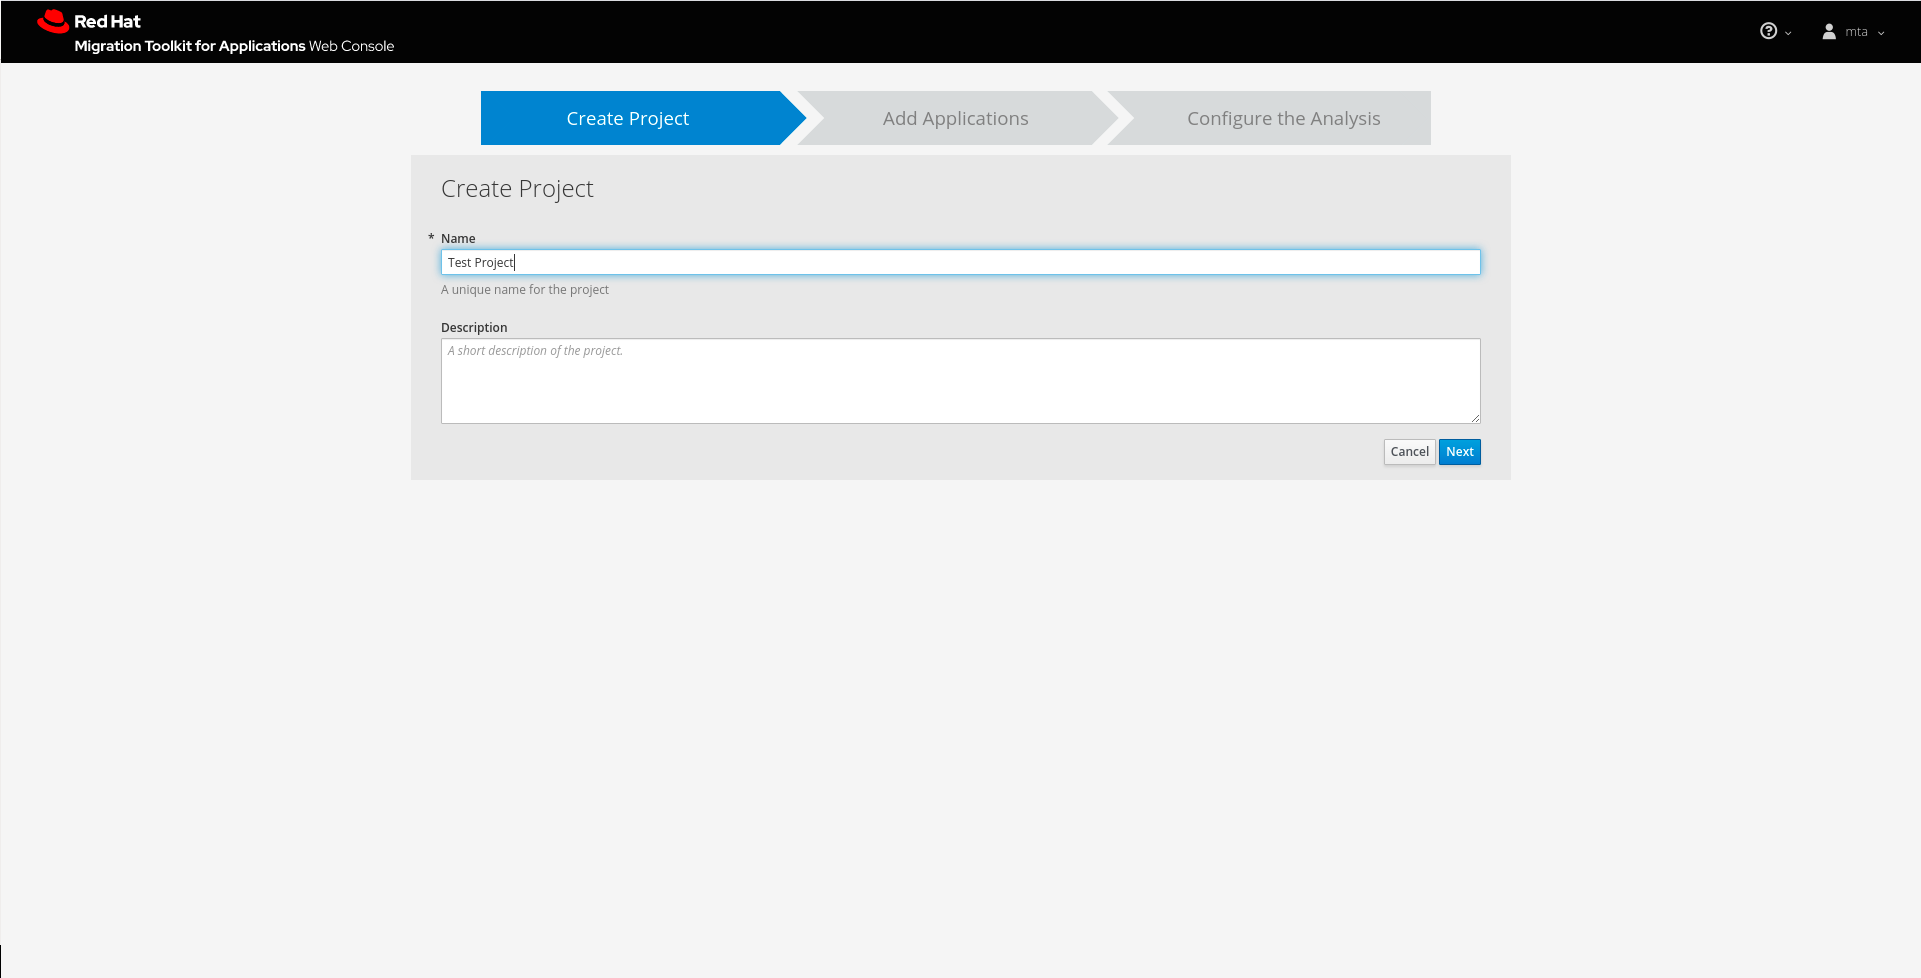
Specify a name and an optional description for this project and click Next to continue.
3.2. Adding applications to a project
Specify the applications to add to this project. You can upload applications or register a server path that contains applications.
Figure 3.3. Adding applications
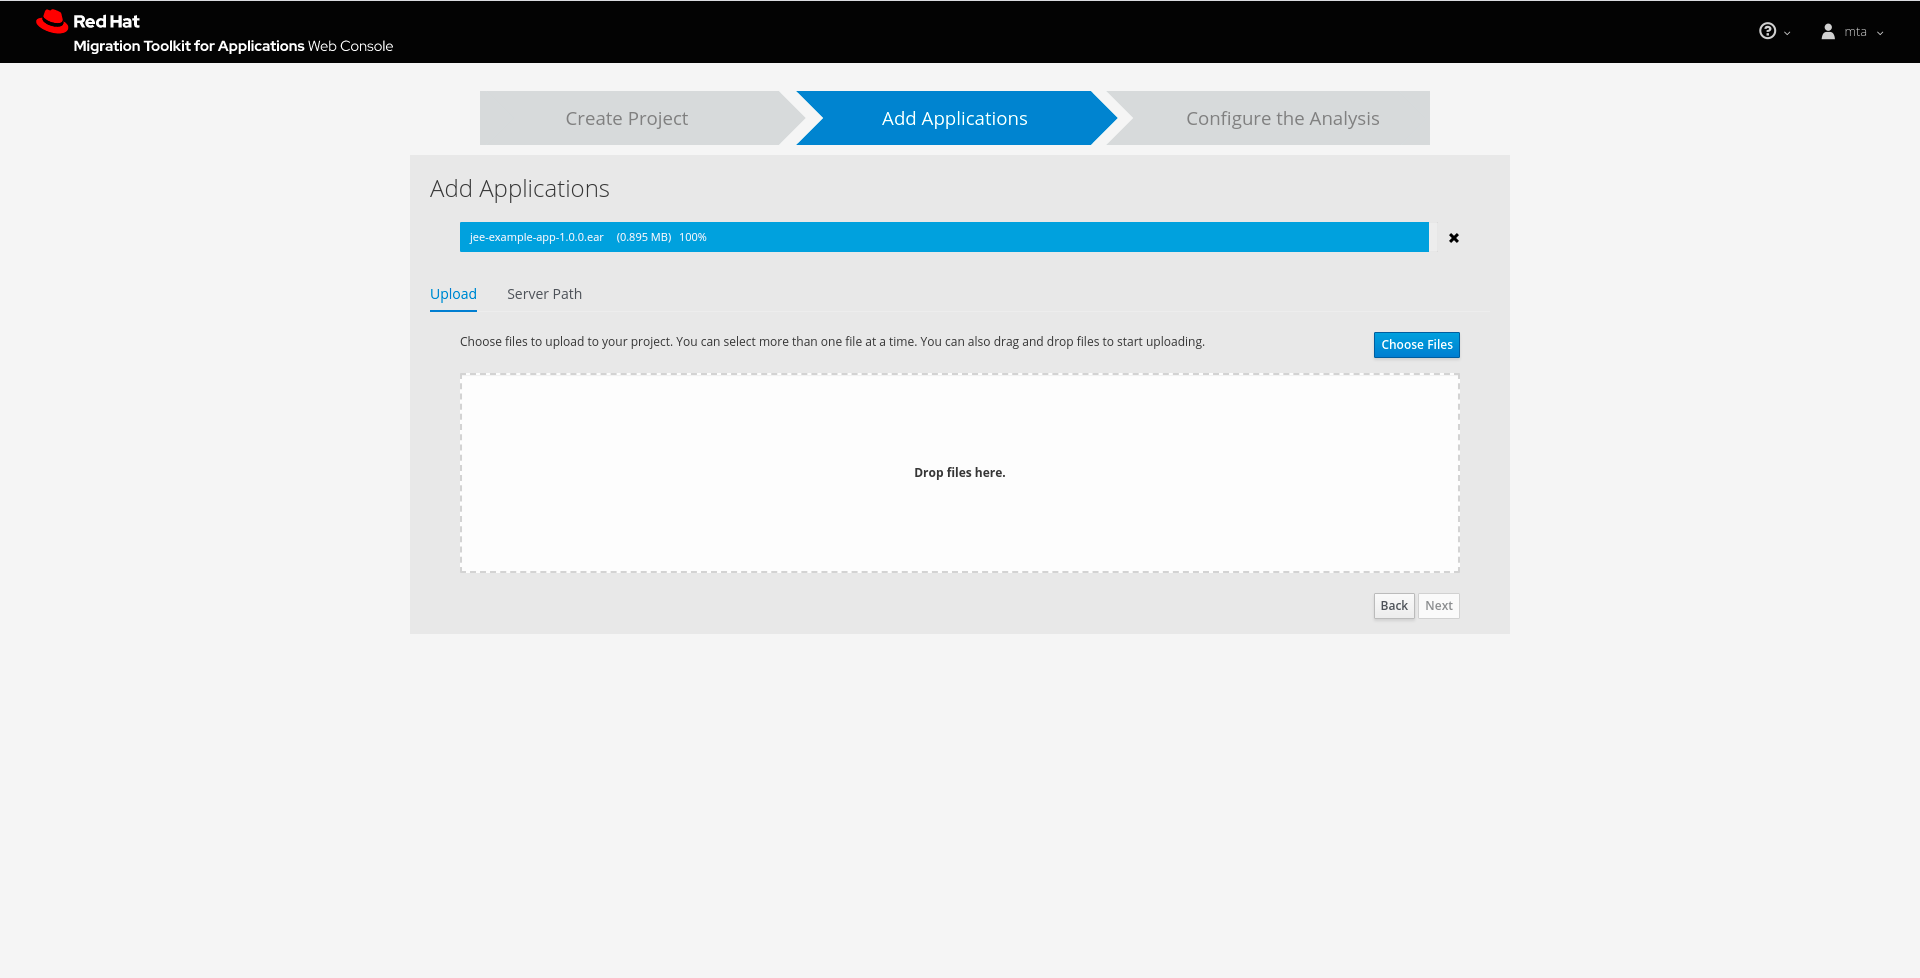
- Uploading applications
- You can use the Choose Files button to select applications, or you can drag and drop applications into the area provided. This uploads the selected applications to the MTA server.
- Registering a server path
Select the Server Path tab and enter a path on the server that contains applications to be included in this project. This does not copy the files to the MTA server, but instead evaluates the applications in the specified location.
This is useful for the following cases:
- You want to register an existing directory on the server that contains applications, for example, from a nightly automatic build process. This way, the MTA server will analyze the latest versions of applications.
- You want to register an application as an exploded Java archive. In this case, be sure to check the Directory is an exploded Java application archive checkbox.
Once you have specified one or more applications for this project, click Next to continue.
3.3. Configuring an analysis
Configure the settings for the analysis, such as the transformation path, packages, and other advanced options.
Figure 3.4. Configuring an analysis
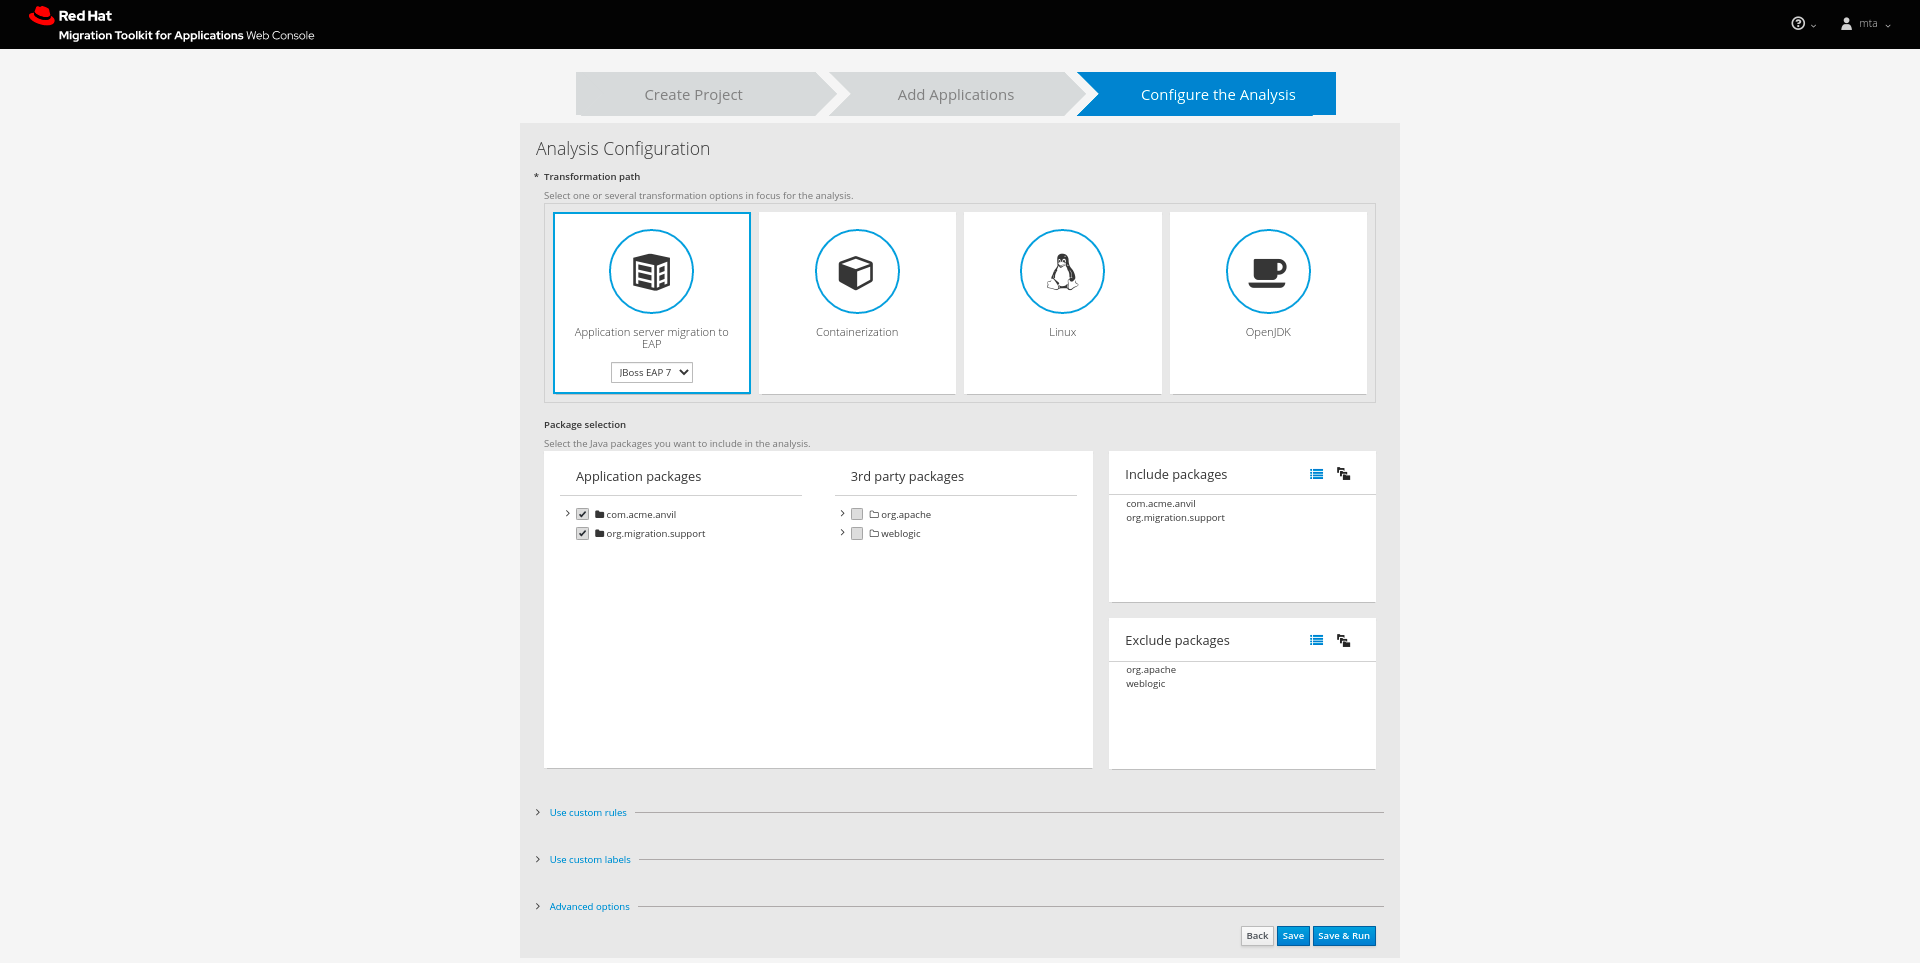
- Transformation path
Select the transformation path for your applications. The targets displayed under the Transformation Path heading are the most commonly used options:
-
JBoss EAP 7 (
eap:7) -
JBoss EAP 6 (
eap:6) -
Containerization (
cloud-readiness) -
Linux (
linux) -
Open JDK (
openjdk)
-
JBoss EAP 7 (
Other available targets can be selected using the Advanced Options dialogue.
- Include packages
- Select which packages to analyze. If none are selected, all packages will be decompiled and analyzed.
- Exclude packages
- Select which packages to exclude from analysis.
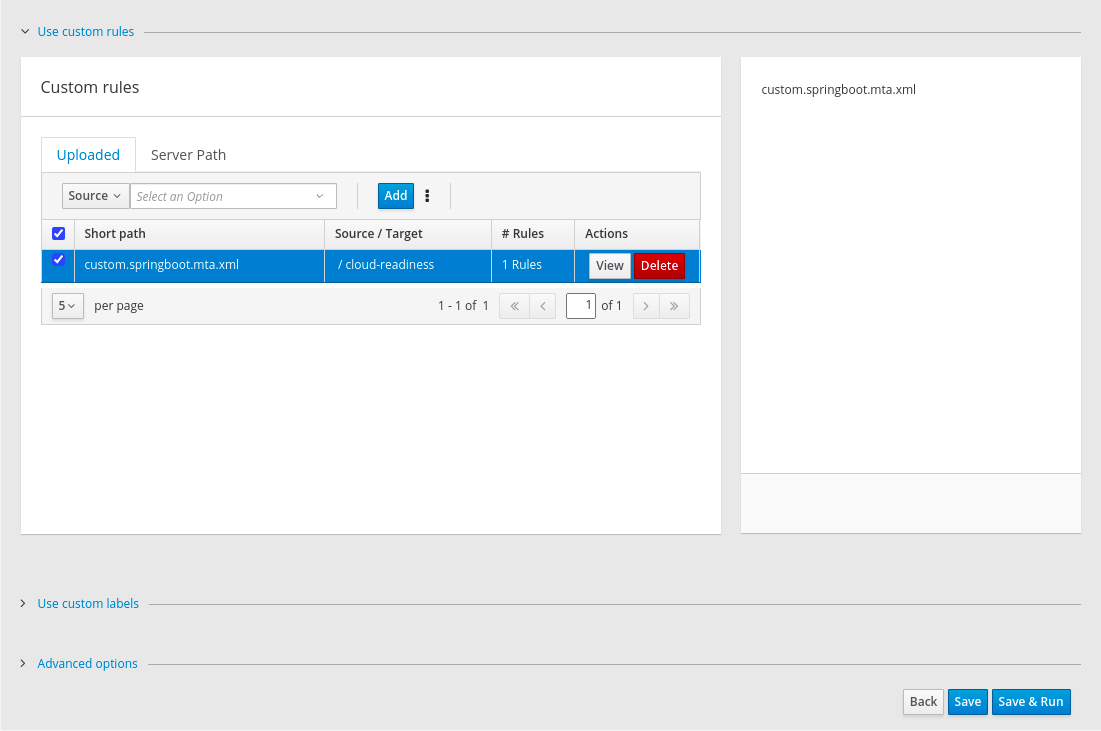
- Use custom rules
- Select which custom rulesets to use during analysis.
Custom rules can be maintained for the current MTA project (project scope) or for all MTA projects (global scope).
Project custom rules are maintained using the controls below.
The Add button allows the user to select the rules files (.windup.xml or .mta.xml). Selected (checked) rules are shown in the right-hand panel and will be executed during the analysis.
Figure 3.5. Custom rules
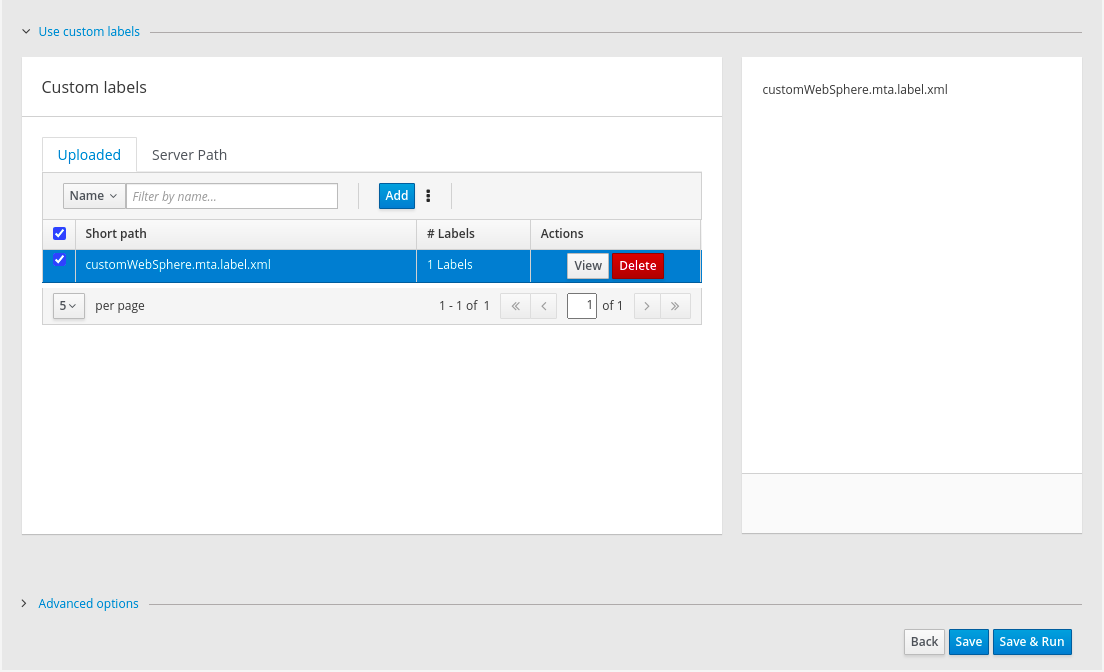
- Use custom labels
- Select which custom labels to use during analysis.
Custom labels can be maintained for the current MTA project (project scope) or for all MTA projects (global scope).
Project custom labels are maintained using the controls below.
The Add button allows the user to select the label files (.windup.label.xml or .mta.label.xml). Selected (checked) labels are shown in the right-hand panel and will be executed during the analysis.
Figure 3.6. Custom labels
- Advanced options
- Click Save to save the analysis configuration, or click Save & Run to save and execute the analysis using these settings.
3.4. Running an analysis
From the analysis configuration page, click the Save & Run button to execute the analysis.
On the Analysis page, the progress of the analysis that is currently executing is shown. Completed, queued, and in-progress executions are listed in the table. Click the Run Analysis to run the analysis again with the latest configuration.
3.5. Viewing analysis results
Once you have executed MTA analysis on a project, the analysis is listed in a table that provides the analysis ID, status, and date started. Each row includes actions available for that analysis, including viewing the analysis details and generated reports, as well as canceling or deleting the analysis.
Figure 3.7. Analysis list
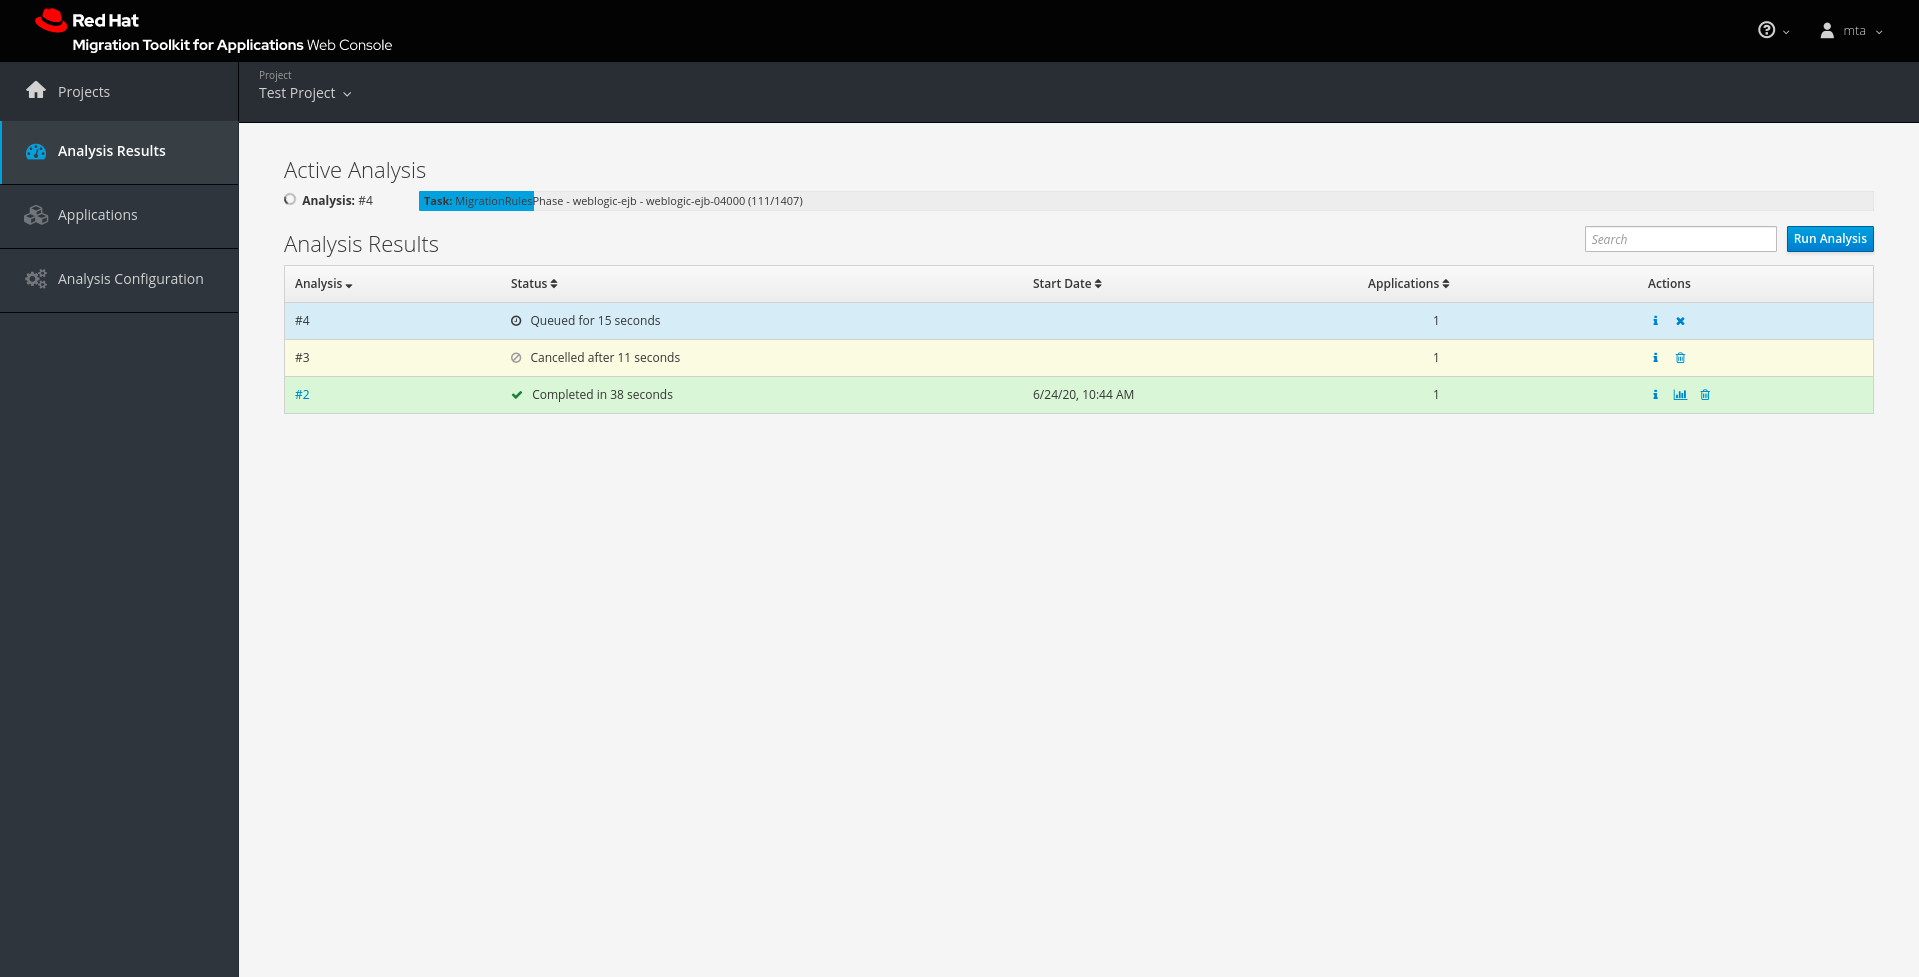
Click the link in the Analysis column to view the reports or click the information icon in the Actions column to view the analysis details.
3.5.1. Viewing analysis details
The details of an analysis can be viewed by clicking the information icon in the Actions column of the Analysis Results table.
Figure 3.8. Analysis details
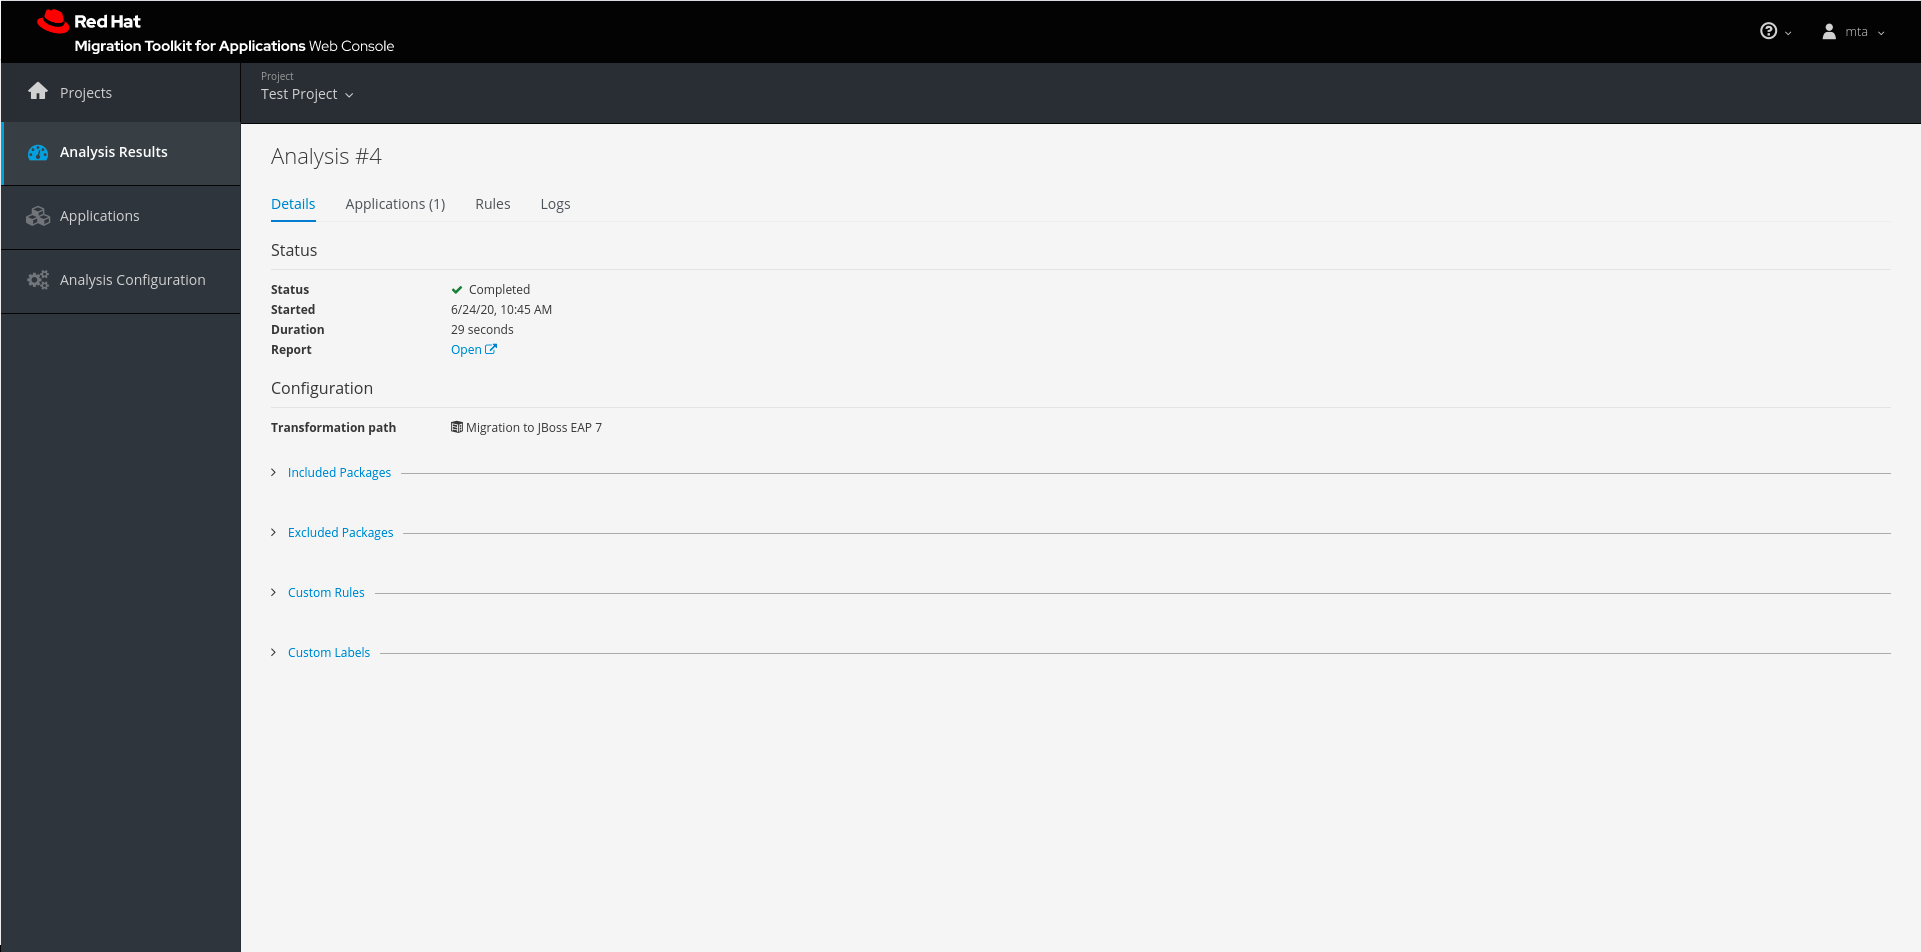
This page provides the following tabs with information about this analysis.
- Details
- This tab shows the status, start date, and duration of the analysis as well as the configuration settings that were used for this analysis.
- Applications
- This tab lists the applications that were included in this analysis.
- Rules
This tab lists the rules that were evaluated during this analysis.
NoteYou can view all system and custom rules by selecting Rules Configuration from the user drop down.
- Logs
- This tabs shows the output from this MTA analysis engine execution.
3.5.2. Reviewing reports
From the analysis table, click the report link in the Actions column to view the reports for this analysis. This opens a new window with the generated MTA reports.