
Web Console Guide
Use the Migration Toolkit for Applications web console to group your applications into projects for analysis.
Abstract
Making open source more inclusive
Red Hat is committed to replacing problematic language in our code, documentation, and web properties. We are beginning with these four terms: master, slave, blacklist, and whitelist. Because of the enormity of this endeavor, these changes will be implemented gradually over several upcoming releases. For more details, see our CTO Chris Wright’s message.
Chapter 1. Introduction
1.1. About the Web Console Guide
This guide is for engineers, consultants, and others who want to use the Migration Toolkit for Applications (MTA) to migrate Java applications or other components. It describes how to install and use the web console to manage migration projects and analyze applications.
1.2. About the Migration Toolkit for Applications
What is the Migration Toolkit for Applications?
The Migration Toolkit for Applications (MTA) is an extensible and customizable rule-based tool that simplifies the migration of Java applications.
The MTA examines application artifacts, including project source directories and application archives, then produces an HTML report that highlights areas needing changes. MTA can migrate Java applications from earlier versions of Red Hat JBoss Enterprise Application Platform or from other application servers, such as Oracle WebLogic Server or IBM WebSphere Application Server.
How does the Migration Toolkit for Applications simplify migration?
The Migration Toolkit for Applications looks for common resources and highlights technologies and known trouble spots when migrating applications. The goal is to provide a high-level view into the technologies used by the application and provide a detailed report organizations can use to estimate, document, and migrate enterprise applications to Java EE and Red Hat JBoss Enterprise Application Platform.
How do I learn more?
See the Introduction to the Migration Toolkit for Applications to learn more about the features, supported configurations, system requirements, and available tools in the Migration Toolkit for Applications.
1.3. About the Web Console
The web console for the Migration Toolkit for Applications allows a team of users to assess and prioritize migration and modernization efforts for a large number of applications. It allows you to group applications into projects for analysis and provides numerous reports that highlight the results.
Chapter 2. Installing the web console
You can install the web console on Linux, Windows, macOS, or OpenShift Container Platform.
2.1. Installing the web console on Linux, Windows, or macOS
You can install the web console on Linux, Windows, or macOS operating systems and access the web console in a browser.
The web console has been tested with Chrome and Firefox.
Prerequisites
- OpenJDK 1.8, OpenJDK 11, Oracle JDK 1.8, or Oracle JDK 11
- 8 GB RAM
-
macOS: The value of
maxprocmust be2048or greater.
Procedure
- Download the installation archive file from the MTA Download page.
Extract the
.zipfile to a directory of your choice.NoteIf you are installing on a Windows operating system, extract the
.zipfile to a folder namedmtato avoid aPath too longerror.The directory is referred to as
<MTA_HOME>in this guide.Start the web console:
Linux operating system:
$ <MTA_HOME>/run_mta.sh
Windows operating system:
C:\<MTA_HOME>\run_mta.bat
Open a browser and navigate to
http://localhost:8080/mta-web.Figure 2.1. Welcome Page
The web console installation creates a default
mtauser with a default password,password. You can add additional users to the web console.
2.2. Installing the web console on OpenShift Container Platform
You can install the MTA web console on Red Hat OpenShift Container Platform and access the web console in a browser.
2.2.1. Understanding the web console image
Red Hat offers containerized images for MTA that are designed for use with OpenShift Container Platform. Using these images developers can quickly and easily manage migration projects and analyze applications.
The MTA image installs the following Pods:
- The Executor Pod runs analyses and generates reports
- The Web Console + Red Hat Single Sign-on (SSO) Pod provides access to the web console
- The PostgreSQL Pod stores the project’s configuration and analysis tracking information
A separate persistent volume is used for the web console interface and the PostgreSQL Pods. The Executor Pod’s storage is dependent on the template used.
The
web-template-empty-dir-executor.jsonis the recommended template. It configures the Executor Pod to use temporary storage on a single machine and has no defined persistent volume. The analysis data is sent between the Executor and Web Console Pods using a RESTful web service.Figure 2.2.
web-template-empty-dir-executor.json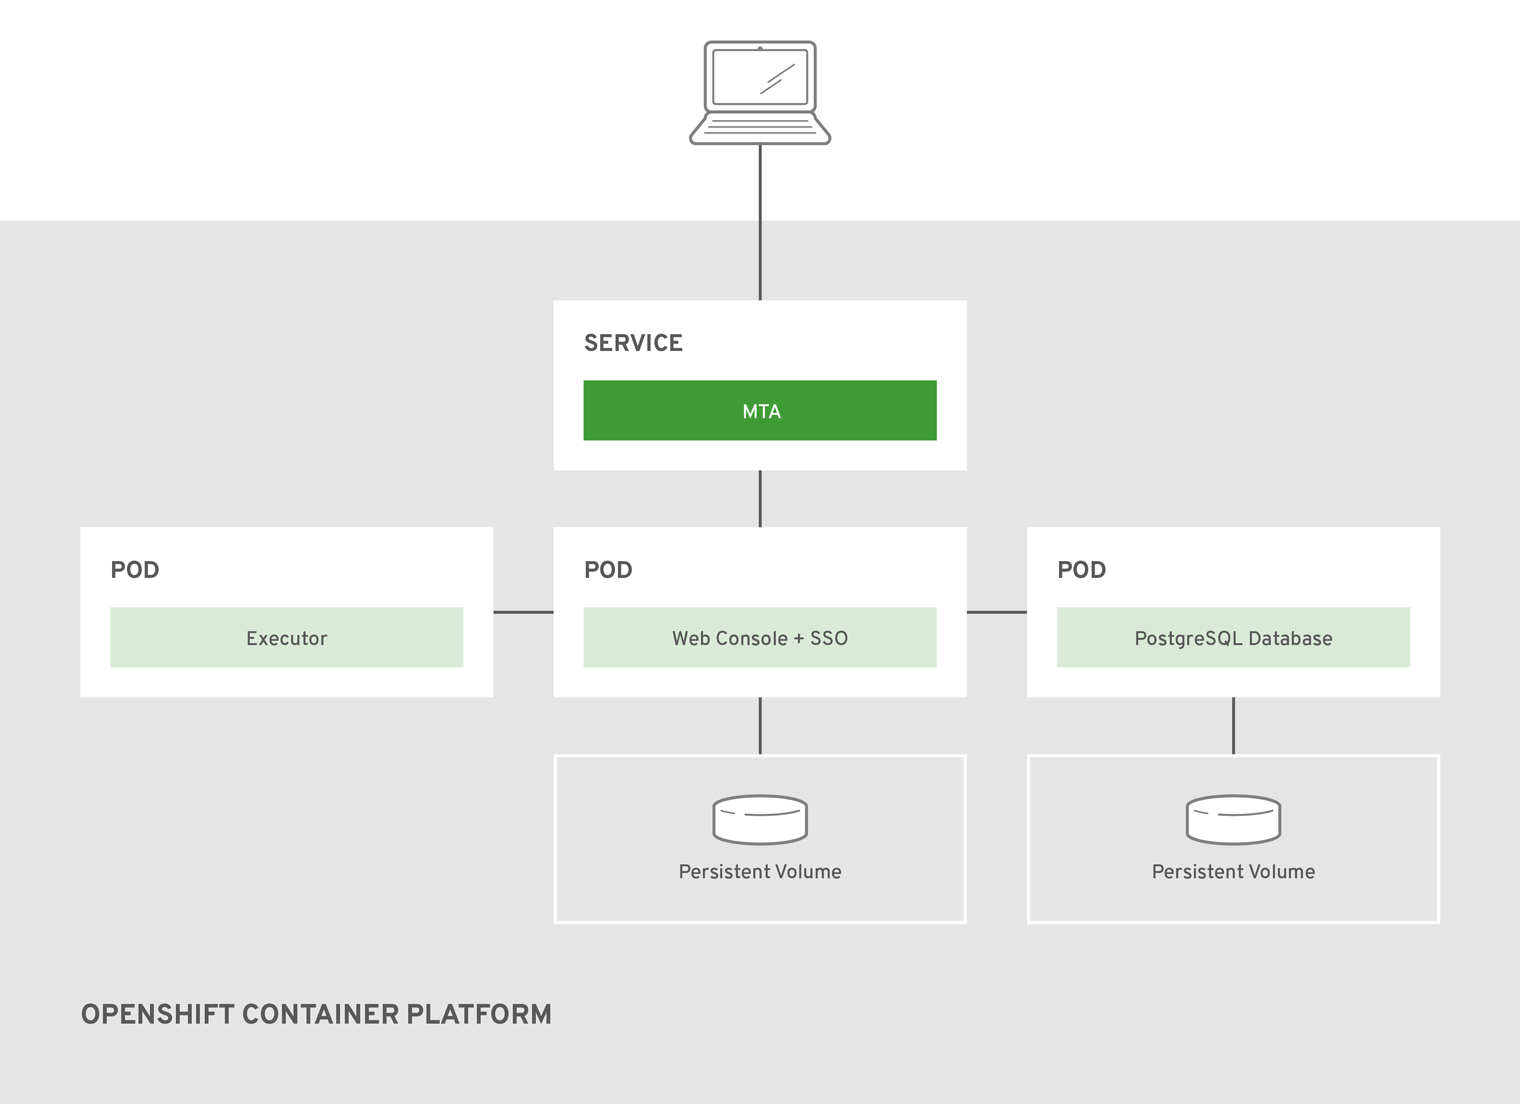
The
web-template-empty-dir-executor-shared-storage.jsonis an alternative template. This template configures the Executor Pod and the Web Console Pod to use a shared persistent volume. All instances of these Pods read and write to the same persistent volume, mounted asReadWriteManyin OpenShift.Figure 2.3.
web-template-empty-dir-executor-shared-storage.json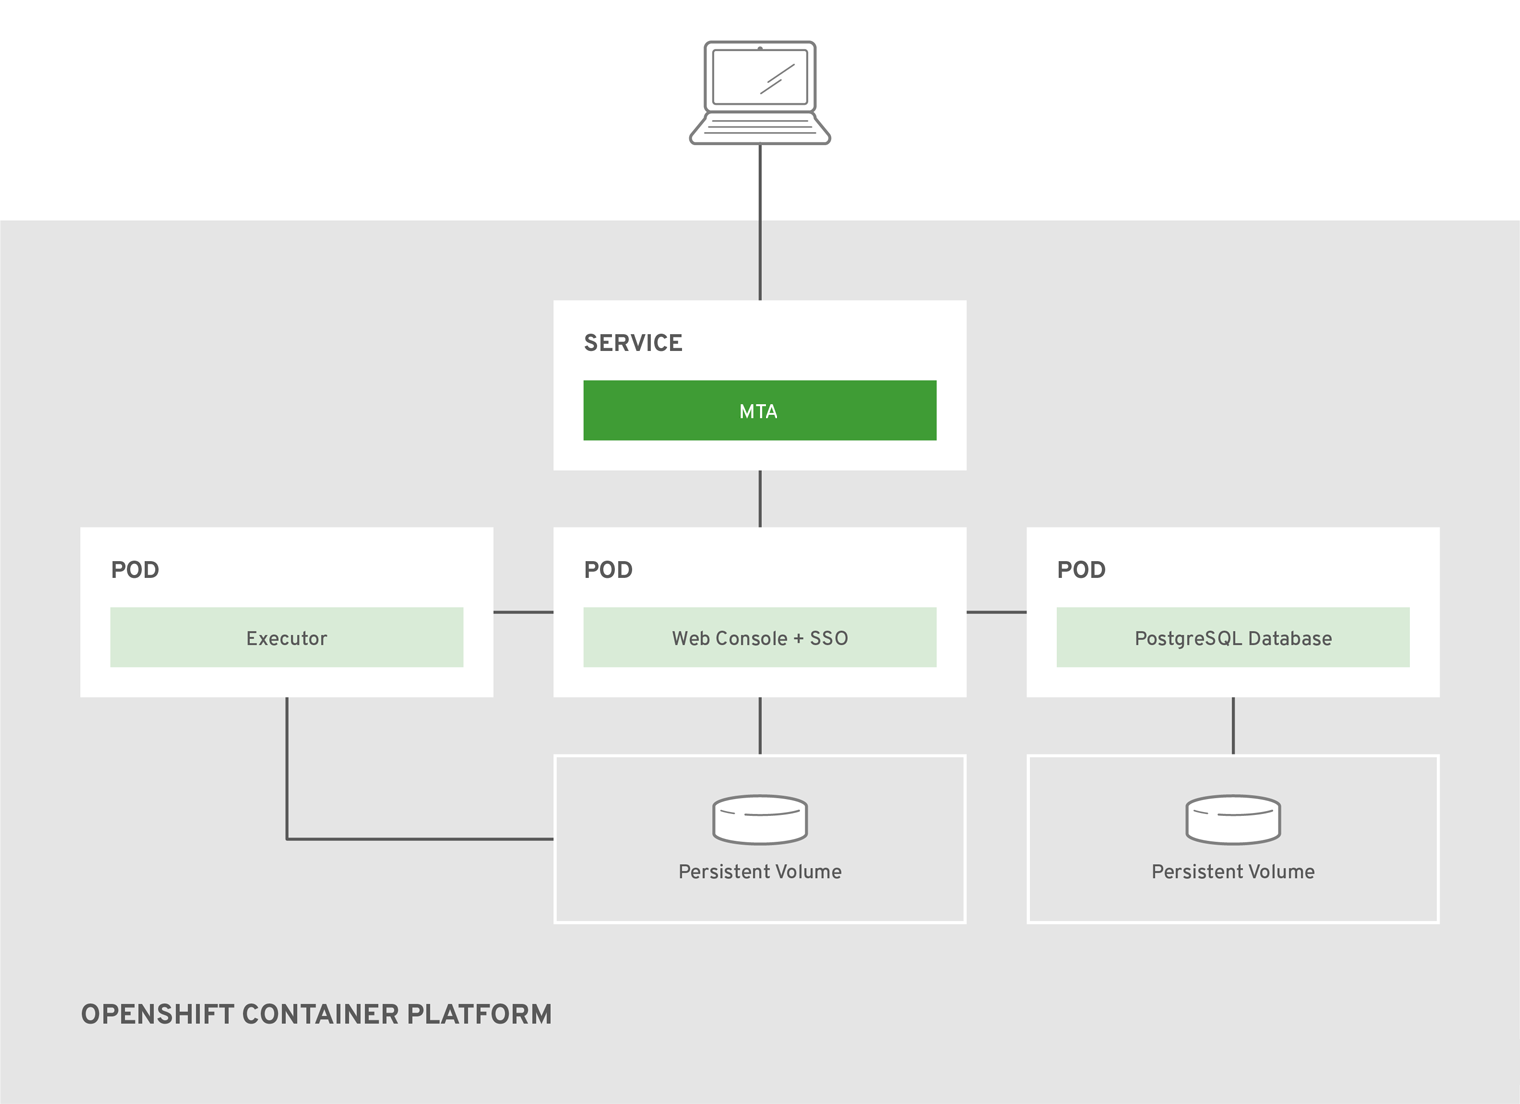
OpenShift template environment variables
The OpenShift image environment variables are configured as a baseline for application analysis, and work well in a variety of environments. No additional configuration is required to perform an analysis.
The most common environment variables modified are the CPU and memory resources allocated to each image. These contain a pattern of <NODE_NAME> followed by <REQUESTED_RESOURCE>. For instance, EXECUTOR_REQUESTED_CPU indicates the number of CPU cores to request for the executor pod, while EXECUTOR_REQUESTED_MEMORY indicates the amount of memory to request for the executor pod.
All of the environment variables are found within each template, along with a description of each.
2.2.2. Importing a web console template
You can import a web console template into Red Hat OpenShift Container Platform.
Prerequisites
OpenShift Container Platform version 3.11 or 4.x.
The web console installation has been tested on OpenShift Container Platform 3.11 and 4.4. Other versions of 4.x should be compatible.
Procedure
- Download the installation archive file from the MTA Download page.
Extract the
.zipfile to a directory of your choice.The directory is referred to as
<MTA_HOME>in this guide.Launch the OpenShift web console.
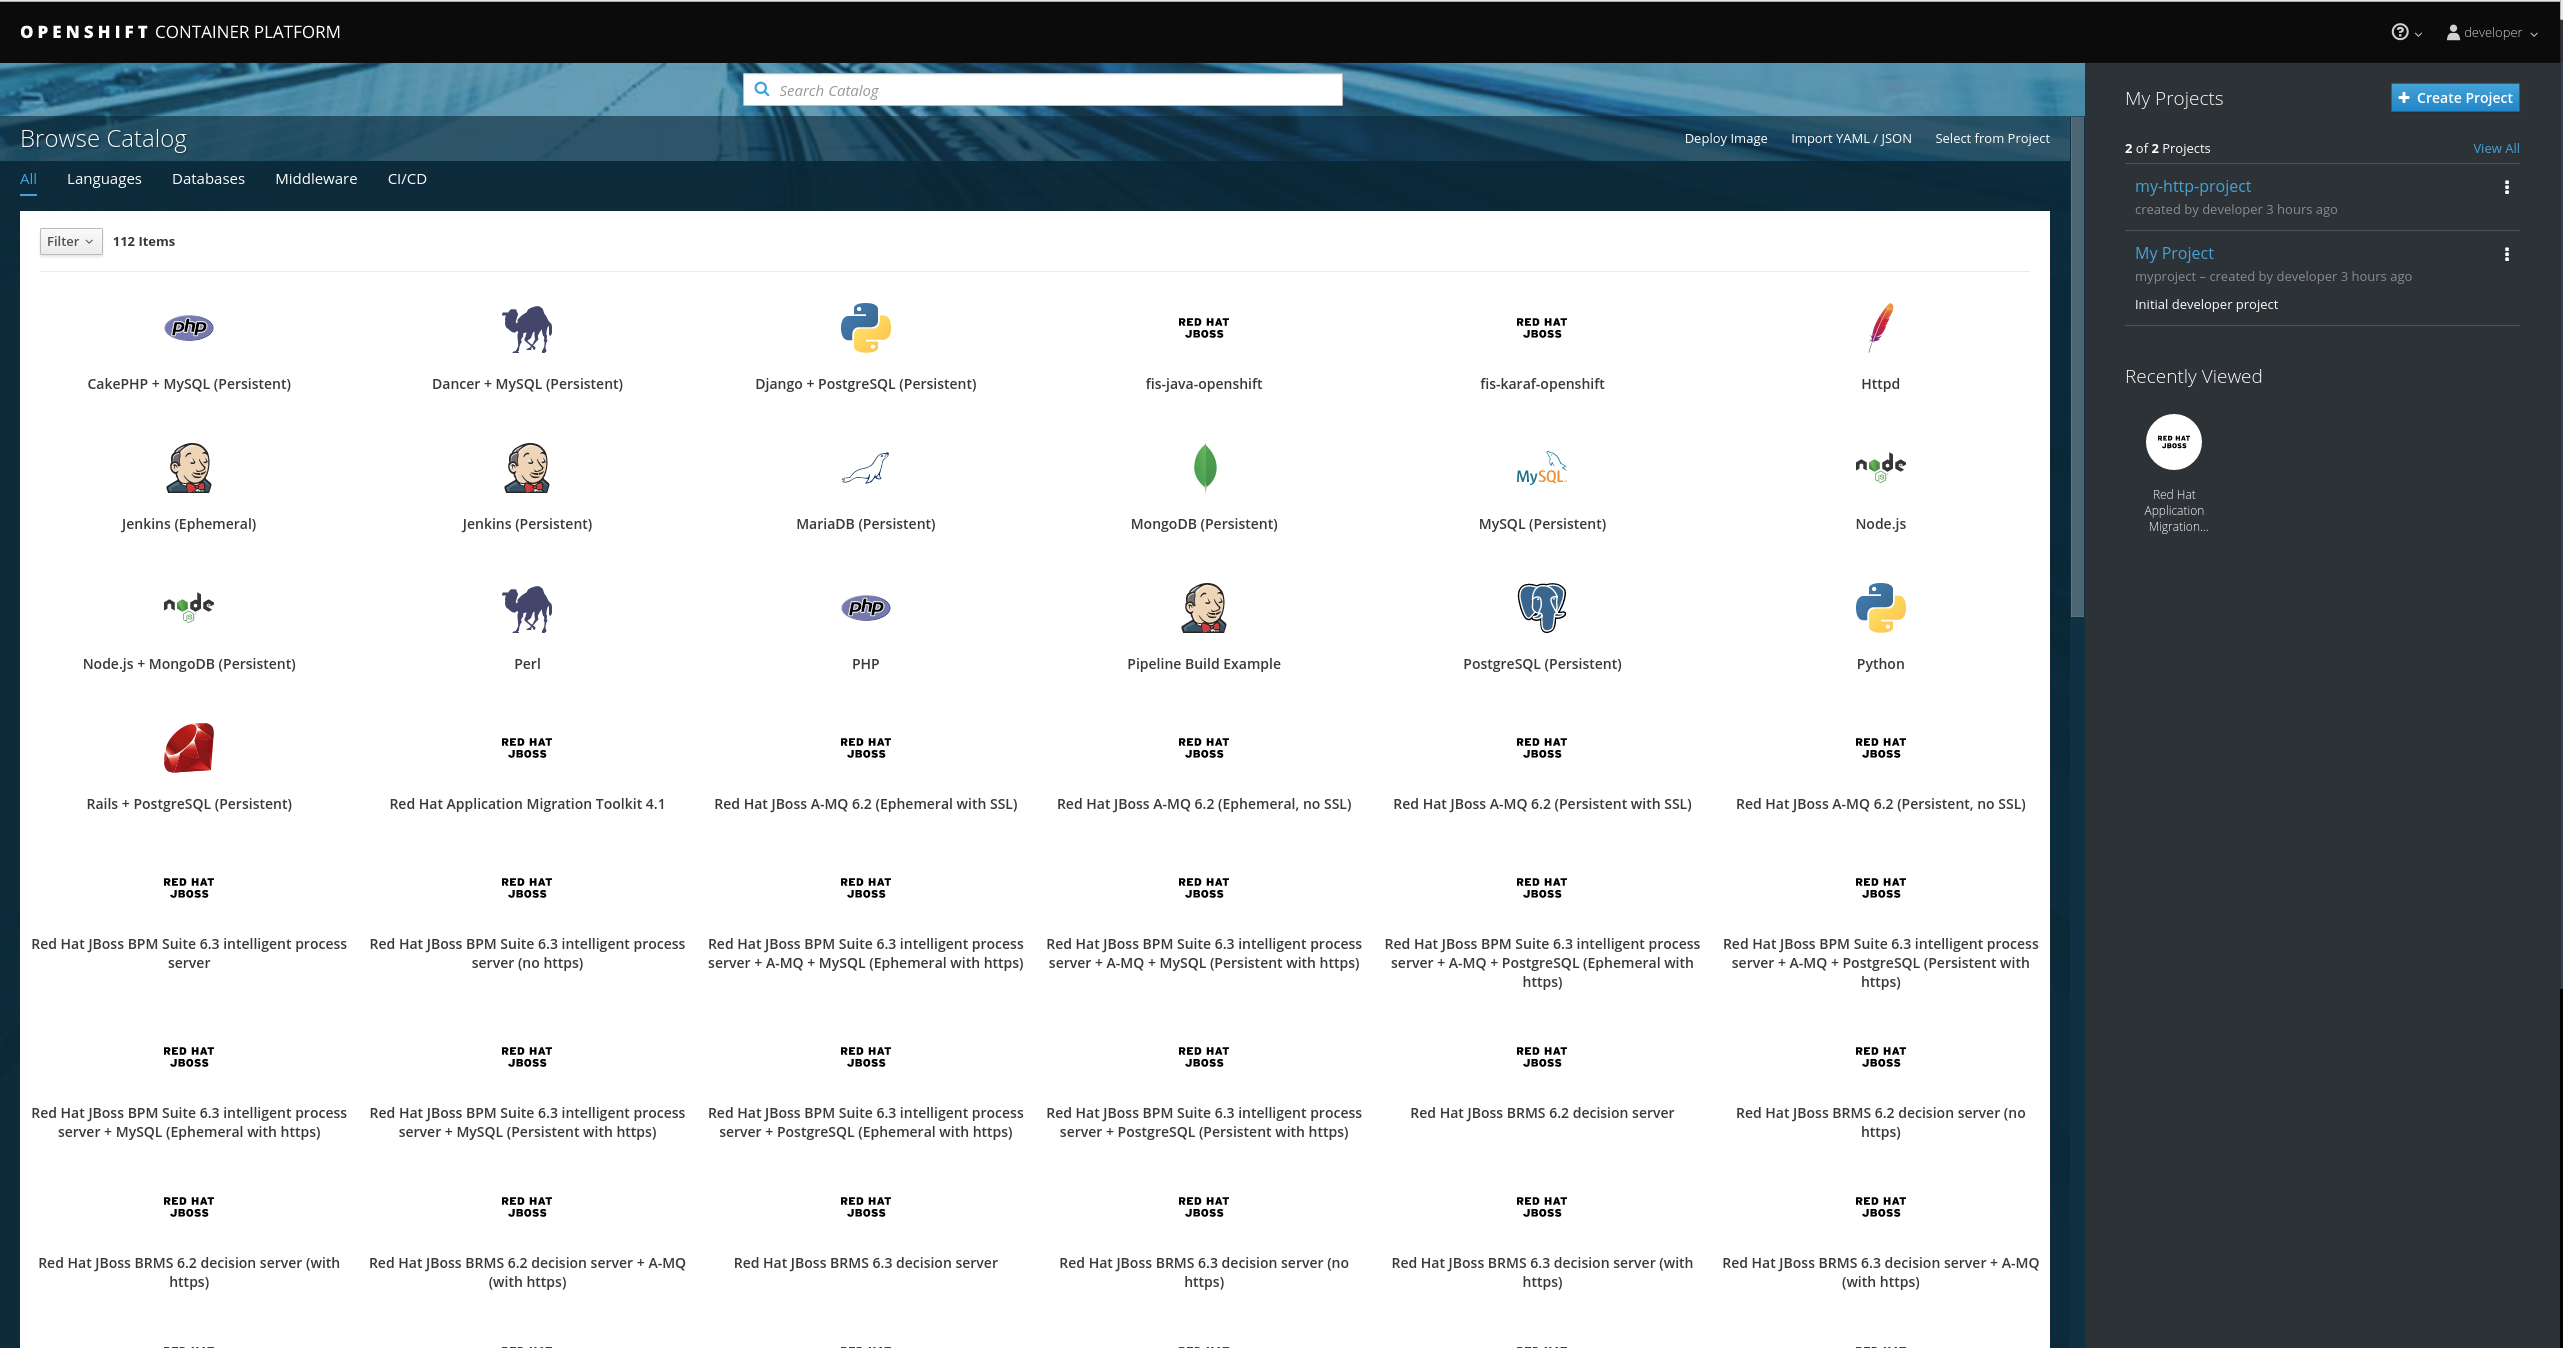
- Click Import YAML/JSON in the upper-right corner of the web console.
Fill in the following fields:
- Project Name. Mandatory.
- Project Display Name. Optional. This field determines how the project name is displayed in the web console.
- Project Description. Optional.
-
Click Browse and import the desired web console template from
<MTA_HOME>/openshift/templates. - Click Create.
- Optional: To save the template as a resource for future projects, select Save template.
- Click Continue.
- Review the values provided.
Click Create to import the template into your project.
The web console template is imported into your project.
2.2.3. Accessing the web console
Once the web console has been deployed on OpenShift Container Platform, you can access it from a browser. The deploy.sh script outputs the link, shown in the example below as <WEB_CONSOLE_URL>, to use to open the web console.
Example: deploy.sh output
...
-> Deploy MTA Web Console ...
Upload, build and deployment successful!

Open <WEB_CONSOLE_URL> to start using the MTA Web Console on OpenShift (user='mta',password='<password>')
You can also access the web console from the OpenShift console at <OPENSHIFT_URL>/console/project/mta/overview by clicking the link in the MTA WEB CONSOLE HTTP application. If you renamed the OpenShift project when deploying, replace mta in this URL with the name of your project.
If the web console does not load immediately, check the status of the project in the OpenShift console to see if it is still processing or if there were errors.
Figure 2.4. Welcome Page
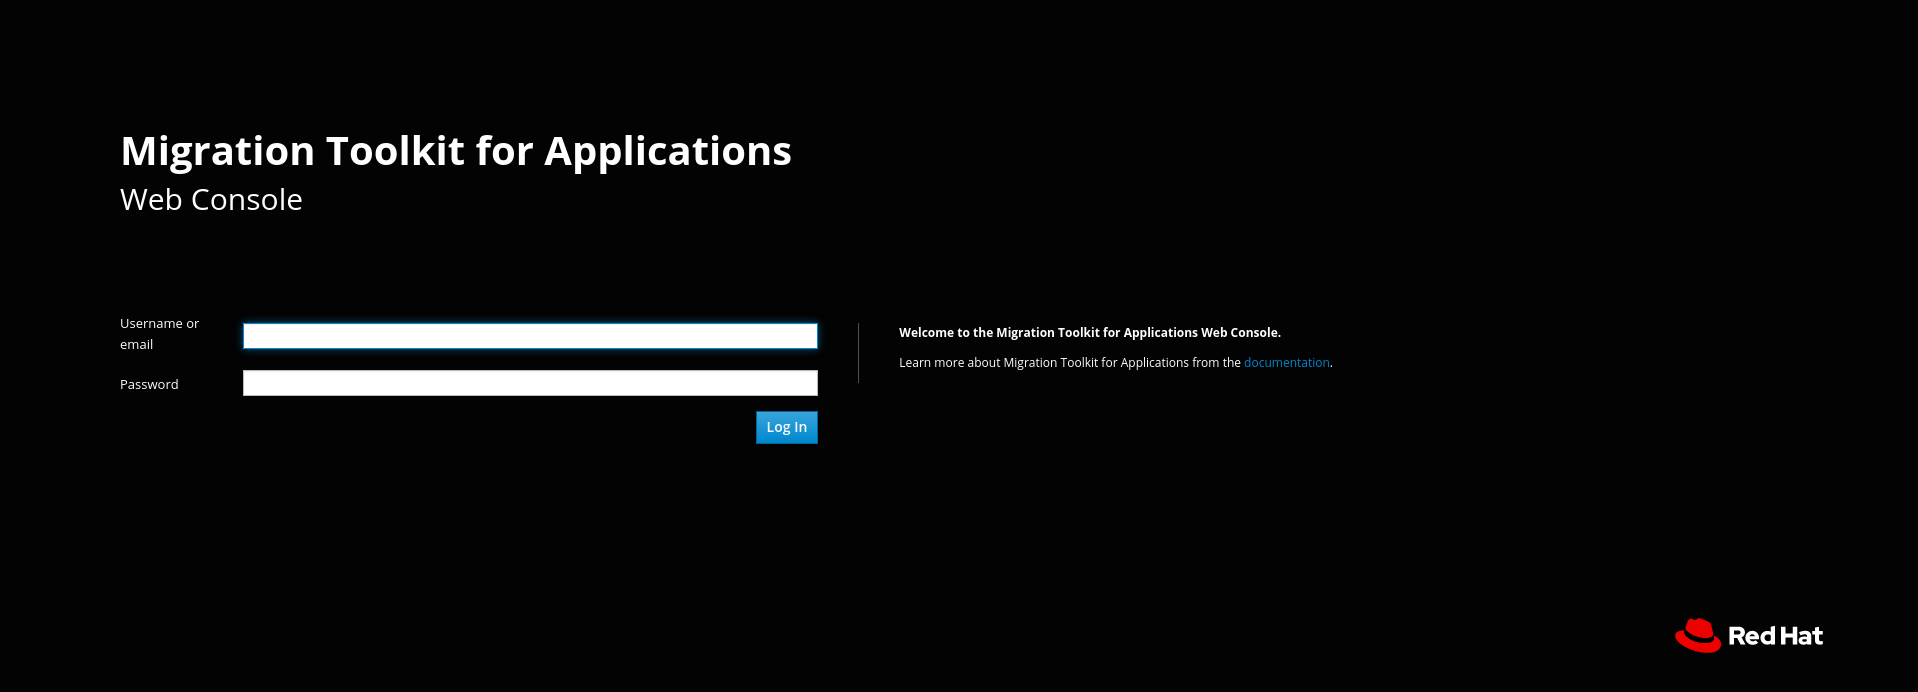
The web console installation creates a default mta user with a default password, password. You can add additional users to the web console.
2.2.4. Troubleshooting
The following steps discuss common techniques for troubleshooting the web console in an OpenShift environment. These instructions are focused on issues specific to the web console.
2.2.4.1. Obtaining the latest image
The first step in troubleshooting in an OpenShift environment is to ensure that the latest image is in use.
If you have deployed the web console by pasting in a JSON template, no image stream is created and the following steps are not applicable.
Procedure
- Open the OpenShift console.
- Click Builds → Images.
-
Ensure that the column under Tags indicates that each image is on the
lateststream. - If the latest image is not in use, follow the steps for the OpenShift installation to redeploy the latest image of the web console.
2.2.4.2. Examining and collecting web console logs
Each Pod is configured to provide detailed logging that assists with narrowing down the precise cause of an issue. The following steps discuss viewing and obtaining these logs.
OpenShift console
You can download a Pod’s log with the OpenShift Container Platform console.
Procedure
- Open the OpenShift console and navigate to Applications → Pods.
-
Click the name of the Pod that you wish to examine. To examine the current web console Pod, select the
mta-web-console-<POD_NAME>that is in aRunningstate. - Click Logs.
- Click Download to download and save a log.
CLI
You can download a Pod’s log with the CLI.
Procedure
Obtain the Pod names:
$ oc get pods
The output resembles the following:
NAME                       READY     STATUS      RESTARTS   AGE
eap-builder-1-build        0/1       Completed   0          1d
mta-postgresql-1-hfbdn     1/1       Running     0          1d
mta-sso-1-build            0/1       Completed   0          1d
mta-web-console-1-build    0/1       Completed   0          1d
mta-web-console-1-vt7s5    1/1       Running     1          1d
sso-1-wjl2n                1/1       Running     1          1d
Use
oc logsto examine the Pod’s log.$ oc logs <POD_NAME>
The output may be redirected to obtain a copy of the current log:
$ oc logs <POD_NAME> > ./mta-openshift-<POD_NAME>.log
2.2.4.3. Common issues
Executor Pod throws NoRouteToHostException
When accessing the executor Pod’s logs the following error is seen.
13:44:03,501 SEVERE [org.jboss.windup.web.messaging.executor.ExecutorBootstrap] (main) Could not start messaging listener due to: Failed to connect to any server. Servers tried: [http-remoting://192.0.2.4:8080 (java.net.NoRouteToHostException: No route to host)]: javax.naming.CommunicationException: Failed to connect to any server. Servers tried: [http-remoting://192.0.2.4:8080 (java.net.NoRouteToHostException: No route to host)]
[...]
What it means:
A NoRouteToHostException indicates that this Pod isn’t able to connect to the web console Pod.
How to resolve it:
In a new deployment this is expected, as the executor starts before the web console. Otherwise, examine the web console Pod and resolve any errors seen here. Once the web console is running successfully this error should be resolved.
Pod reports insufficient resources
After attempting to deploy Web Console on OpenShift, the Pod is unable to start, and the following error is seen in the Events tab.
0/9 nodes are available: 4 Insufficient cpu, 4 MatchNodeSelector, 9 Insufficient memory.
What it means:
The resource quota for the OpenShift project has been met, and the Pod is unable to obtain the requested resources.
How to resolve it:
Perform either of the following:
- Increase the quota for the OpenShift project. For additional information on OpenShift quotas, see Quotas and Limit Ranges and Setting Limit Ranges.
- Reduce the requested resources for the web console OpenShift project. It is recommended to have at least 2 CPUs and 4 GB of memory for the project.
Once the request is within the available quota, attempt the deployment once again.
Pod takes longer than 600 seconds to become available
After attempting a deployment, the -deploy Pods timeout and report the following error.
error: update acceptor rejected mta-web-console-executor-1: Pods for rc 'mta/<POD_NAME>' took longer than 600 seconds to become available
These errors appear after the Pods timeout and are placed into an error state.
What it means:
The deployment Pods are unable to successfully launch the Pods.
This error can be caused by a number of sources, with the following being the most common:
- The OpenShift instance is currently out of resources to deploy the Pod in a timely manner.
- The images were unable to be successfully pulled from the registry.
How to resolve it:
Attempt the deployment again, and view the logs and events of the non deployment Pods while they are being created. These messages will provide context to the underlying errors resulting in the deployment Pod timeouts.
- To address the first issue reported, where the OpenShift instance is out of resources, follow the instructions in Analyzing Cluster Capacity from the Cluster Administration guide in the OpenShift documentation to determine the cluster capacity. Once the capacity has increased, or there are fewer jobs executing, attempt the deployment once again.
- To address the second issue reported, where the images are unable to be pulled from the registry, access the registry to ensure the images are present. This link also includes instructions on examining the logs for the Docker registry, and can be used to troubleshoot the issue further.
2.2.4.4. Reporting issues
The Migration Toolkit for Applications uses JIRA as its issue tracking system. If you encounter any issues while using the web console, please file a JIRA Issue by following the below instructions.
If you do not have one already, you must sign up for a JIRA account in order to create a JIRA issue.
Open a browser and navigate to the JIRA Create Issue page.
If you have not yet logged in, click the Log In link at the top right side of the page and enter your credentials.
Choose the following options and click the Next button.
-
Project: Choose
Migration Toolkit for Applications (WINDUP) -
Issue Type:
Bug
-
Project: Choose
On the next screen complete the following fields.
- Summary: Enter a brief description of the problem or issue.
- Environment: Indicate that this is an OpenShift installation of the web console, and include any environment variables in use with the image.
- Description: Provide a detailed description of the issue. Be sure to include any errors encountered and exception traces.
Attachment: Include the logs. At a minimum this should include the logs from each Pod.
If the application or archive causing the issue does not contain sensitive information and you are comfortable sharing it with the MTA development team, attach it to the issue using the browse button.
- Click the Create button to create the JIRA issue.
Chapter 3. Analyzing applications with the web console
In order to use the web console to analyze applications, you must create a project. Each project is a way to group applications for analysis and specifies the settings to use during the analysis of its applications. The analysis process generates reports that provide information about the changes necessary for a migration or modernization effort.
Follow these steps to use the web console to analyze your applications and review the results.
- Add a project.
- Add applications to the project.
- Specify the analysis configuration.
- Execute the analysis.
- View the results of the analysis.
Click the Projects link at the top of the web console to return to the project list at any time. Visit the help menu for an About page and a link to the MTA documentation.
3.1. Adding a project
When you first access the web console, you will be prompted to set up a new project.
Figure 3.1. Home
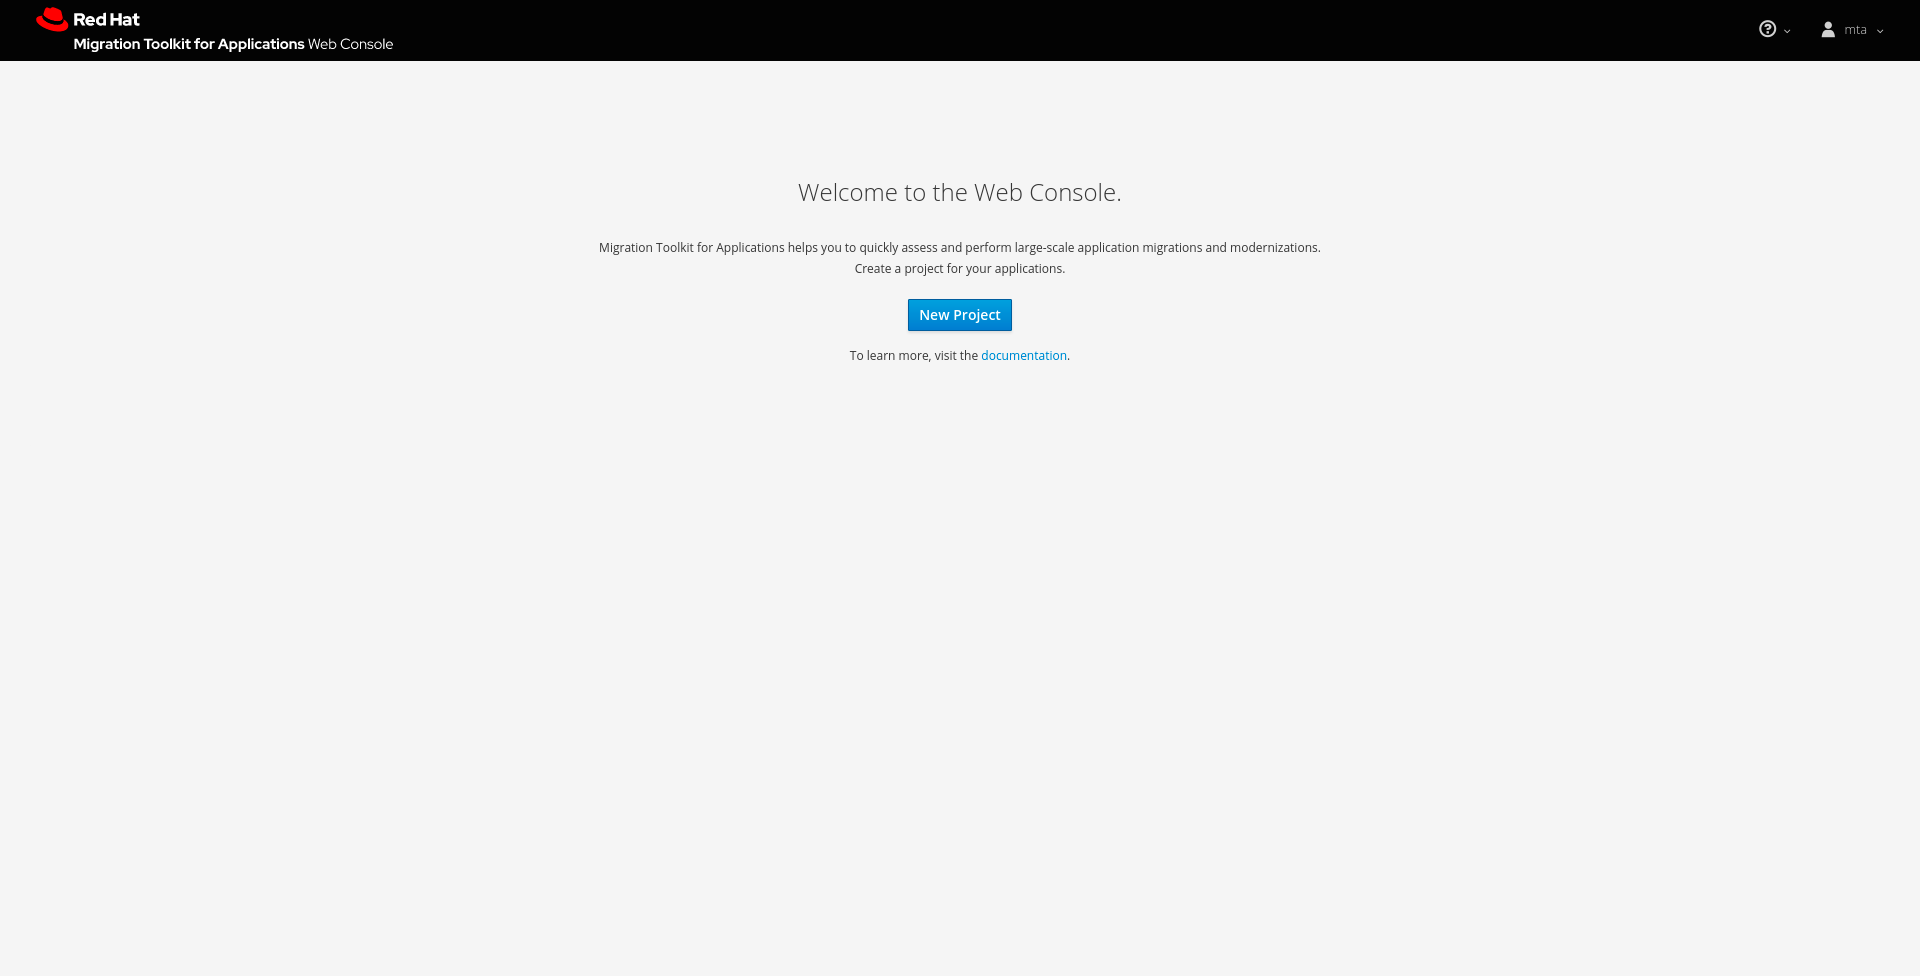
Click the New Project button to launch the wizard to set up a new migration project.
Figure 3.2. Adding a project
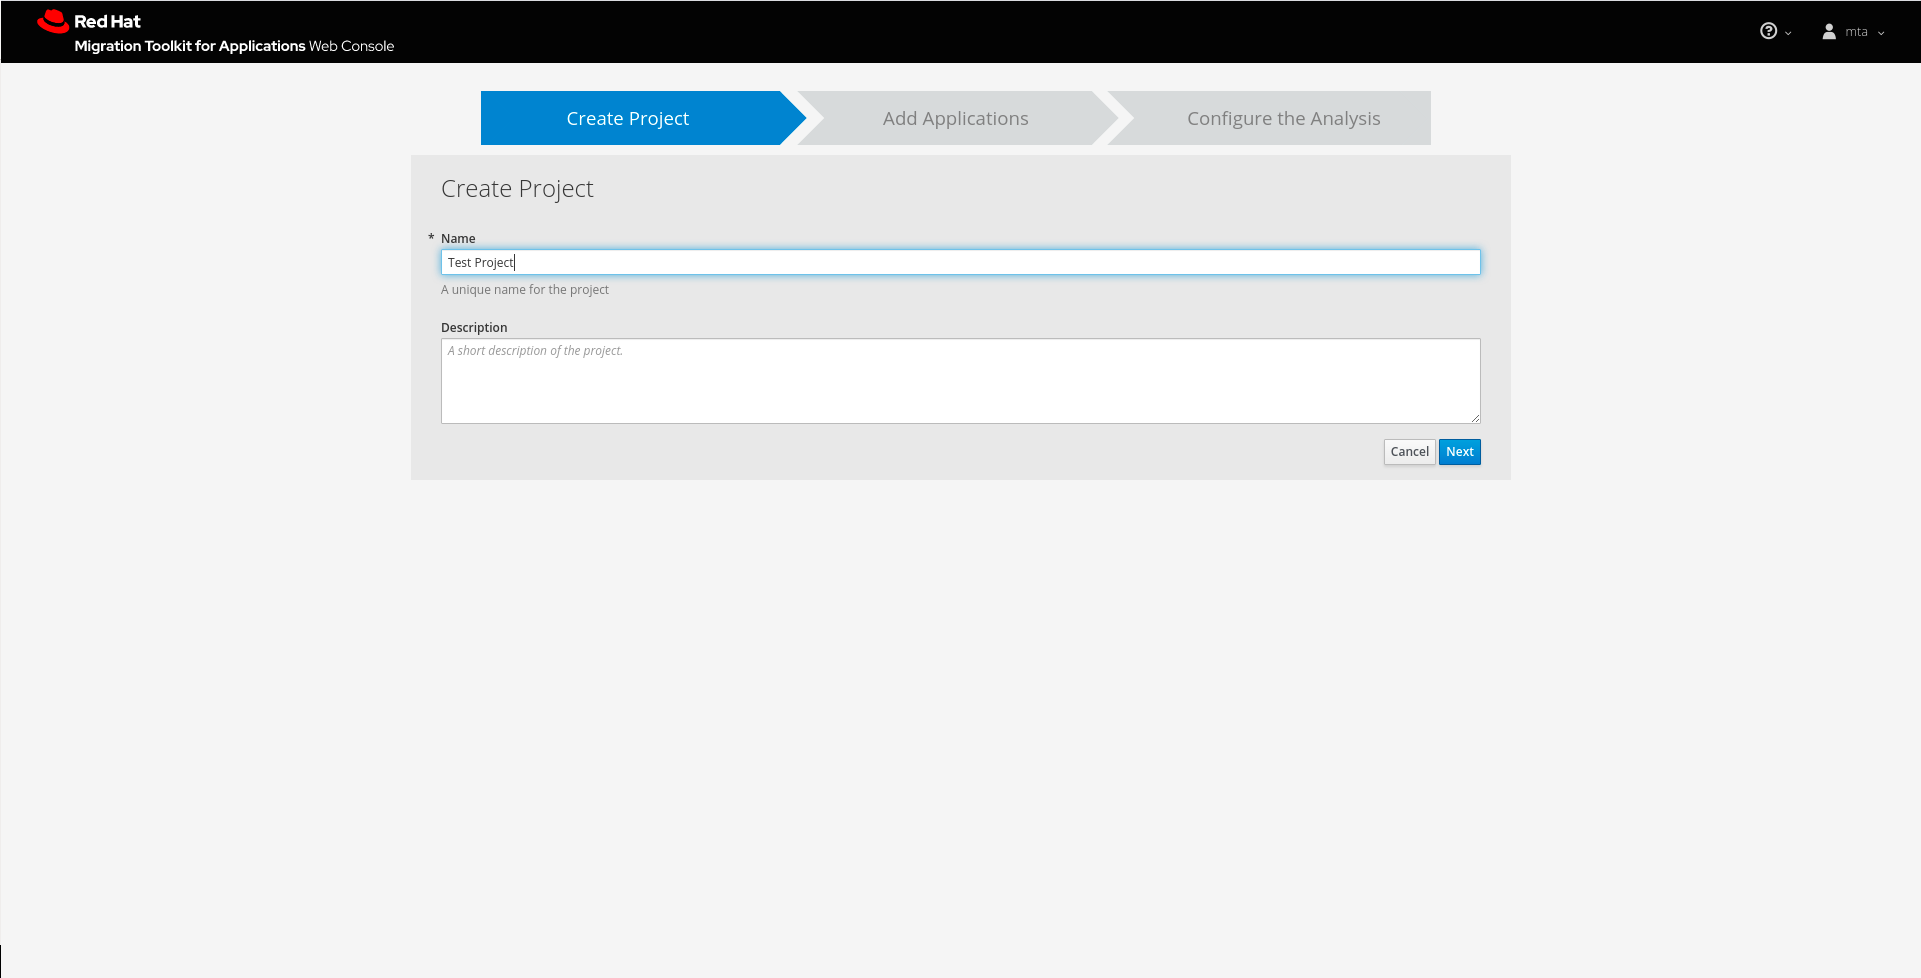
Specify a name and an optional description for this project and click Next to continue.
3.2. Adding applications to a project
Specify the applications to add to this project. You can upload applications or register a server path that contains applications.
Figure 3.3. Adding applications
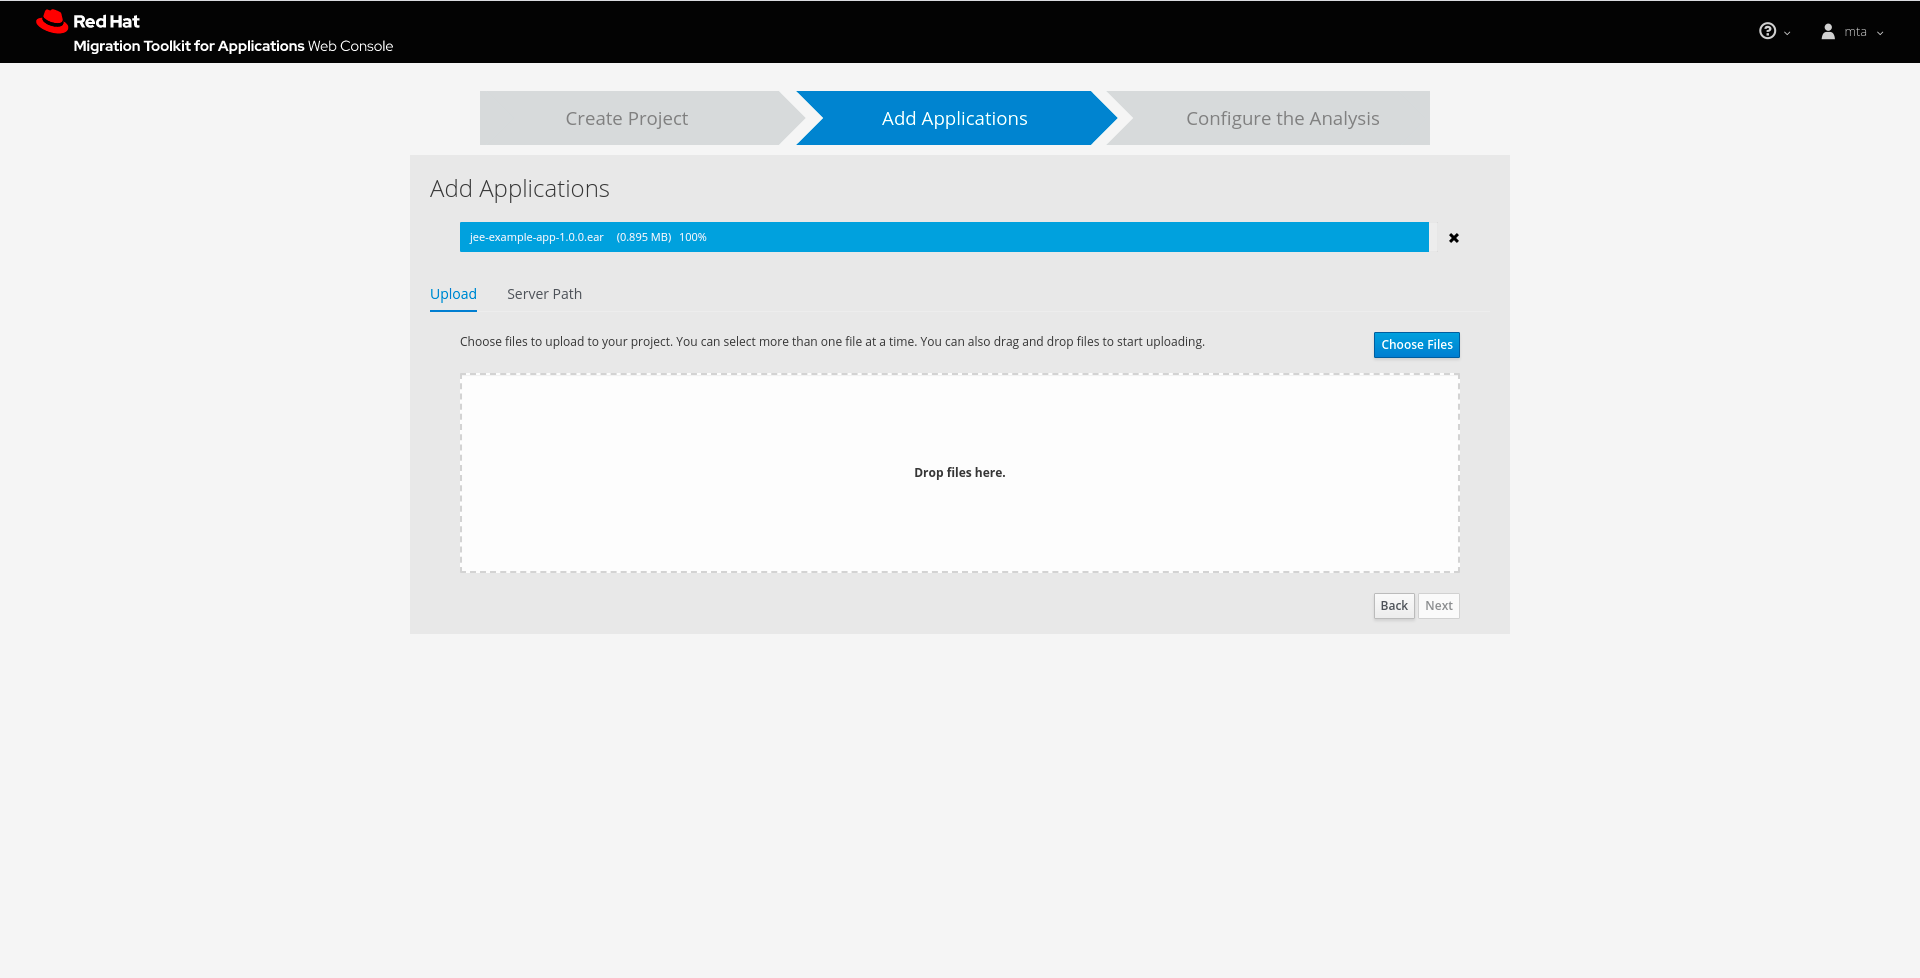
- Uploading applications
- You can use the Choose Files button to select applications, or you can drag and drop applications into the area provided. This uploads the selected applications to the MTA server.
- Registering a server path
Select the Server Path tab and enter a path on the server that contains applications to be included in this project. This does not copy the files to the MTA server, but instead evaluates the applications in the specified location.
This is useful for the following cases:
- You want to register an existing directory on the server that contains applications, for example, from a nightly automatic build process. This way, the MTA server will analyze the latest versions of applications.
- You want to register an application as an exploded Java archive. In this case, be sure to check the Directory is an exploded Java application archive checkbox.
Once you have specified one or more applications for this project, click Next to continue.
3.3. Configuring an analysis
Configure the settings for the analysis, such as the transformation path, packages, and other advanced options.
Figure 3.4. Configuring an analysis
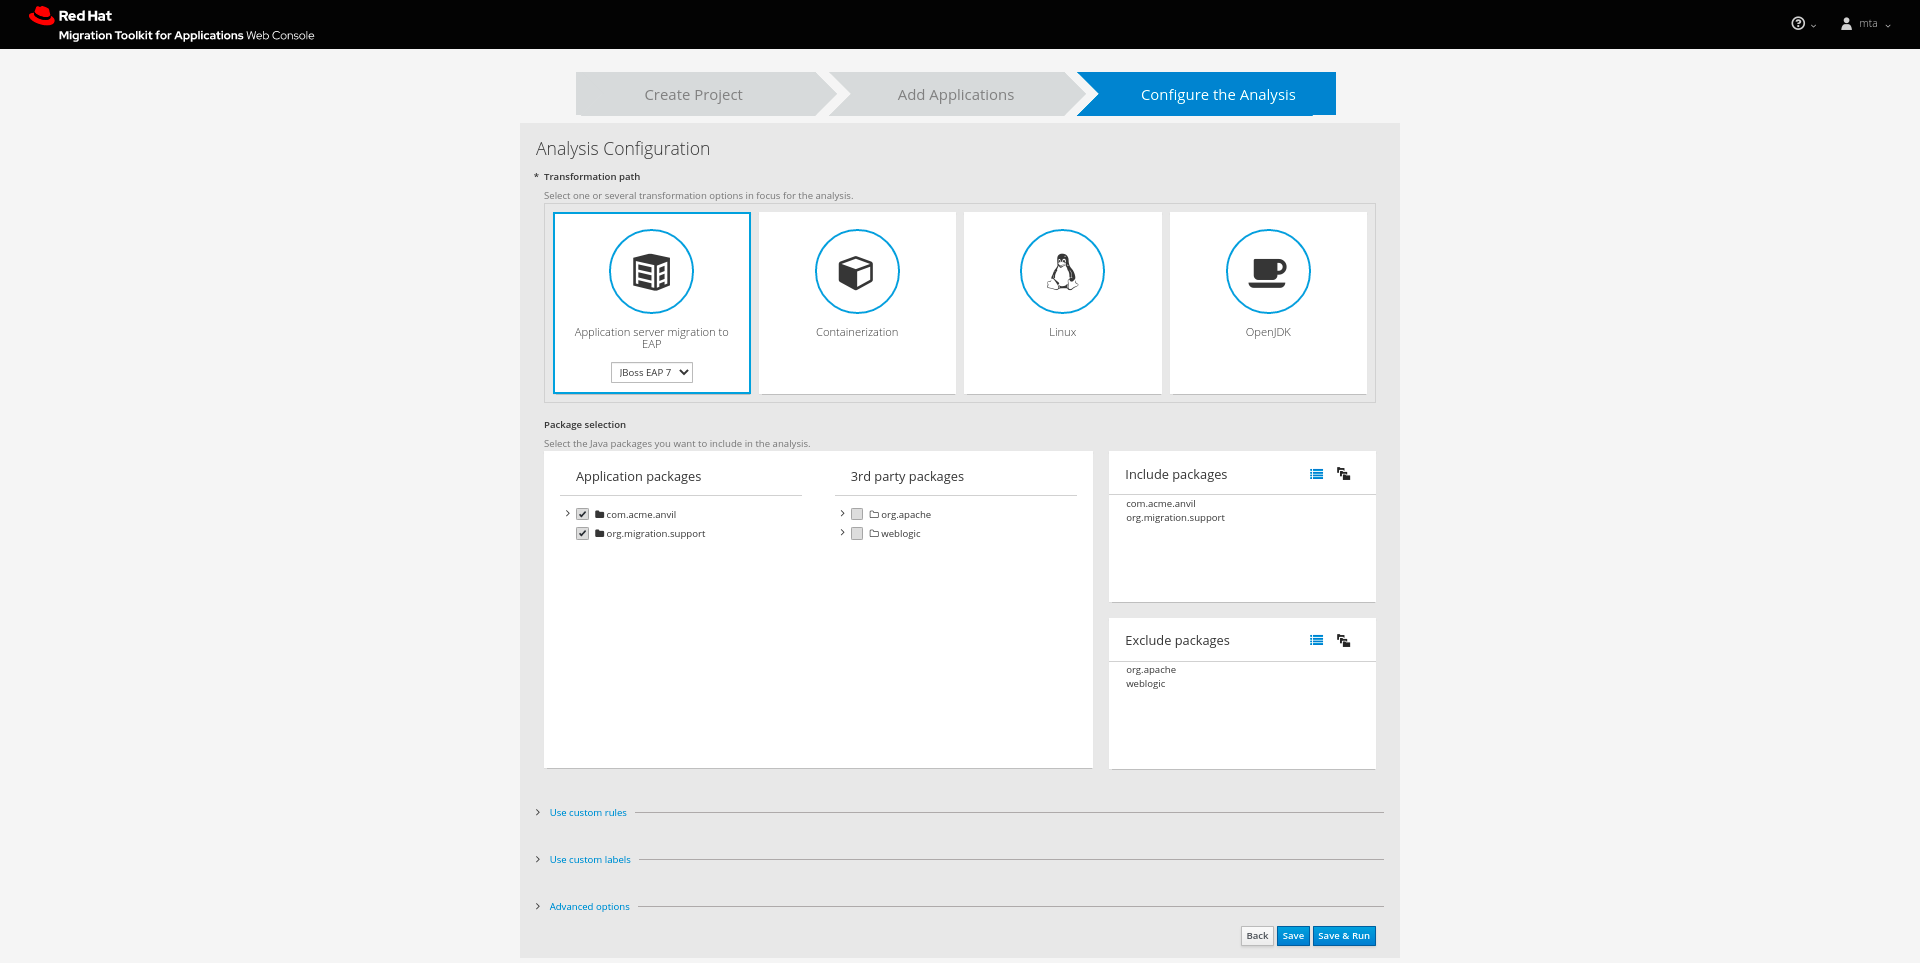
- Transformation path
Select the transformation path for your applications. The targets displayed under the Transformation Path heading are the most commonly used options:
-
JBoss EAP 7 (
eap:7) -
JBoss EAP 6 (
eap:6) -
Containerization (
cloud-readiness) -
Linux (
linux) -
Open JDK (
openjdk)
-
JBoss EAP 7 (
Other available targets can be selected using the Advanced Options dialogue.
- Include packages
- Select which packages to analyze. If none are selected, all packages will be decompiled and analyzed.
- Exclude packages
- Select which packages to exclude from analysis.
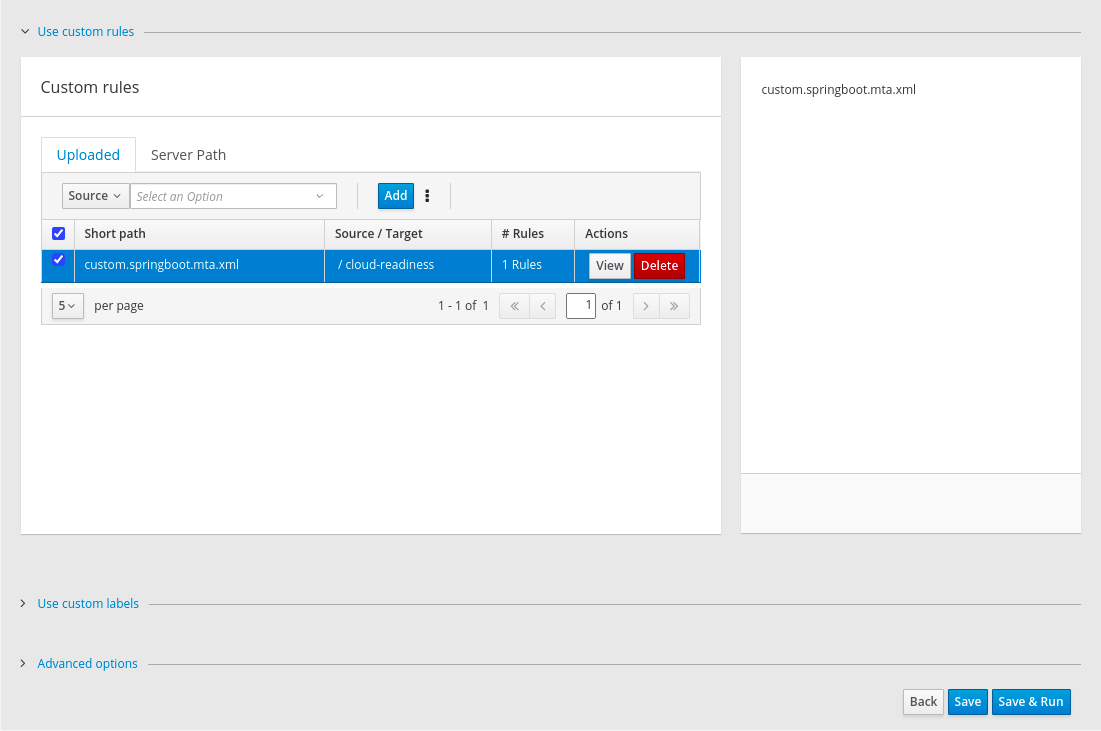
- Use custom rules
- Select which custom rulesets to use during analysis.
Custom rules can be maintained for the current MTA project (project scope) or for all MTA projects (global scope).
Project custom rules are maintained using the controls below.
The Add button allows the user to select the rules files (.windup.xml or .mta.xml). Selected (checked) rules are shown in the right-hand panel and will be executed during the analysis.
Figure 3.5. Custom rules
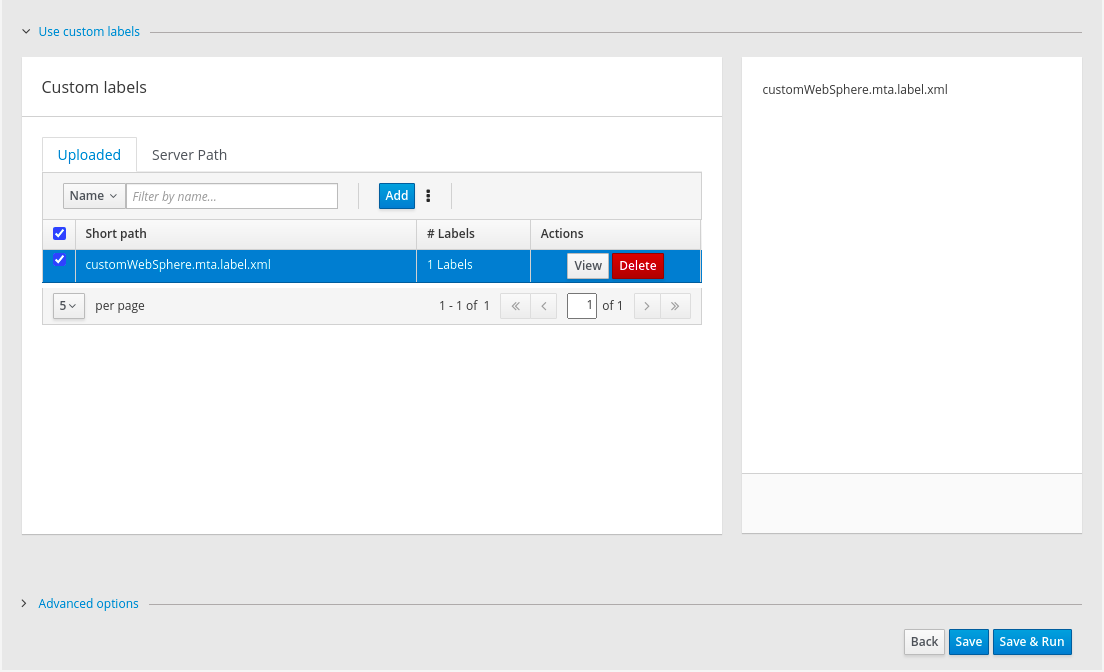
- Use custom labels
- Select which custom labels to use during analysis.
Custom labels can be maintained for the current MTA project (project scope) or for all MTA projects (global scope).
Project custom labels are maintained using the controls below.
The Add button allows the user to select the label files (.windup.label.xml or .mta.label.xml). Selected (checked) labels are shown in the right-hand panel and will be executed during the analysis.
Figure 3.6. Custom labels
- Advanced options
- Click Save to save the analysis configuration, or click Save & Run to save and execute the analysis using these settings.
3.4. Running an analysis
From the analysis configuration page, click the Save & Run button to execute the analysis.
On the Analysis page, the progress of the analysis that is currently executing is shown. Completed, queued, and in-progress executions are listed in the table. Click the Run Analysis to run the analysis again with the latest configuration.
3.5. Viewing analysis results
Once you have executed MTA analysis on a project, the analysis is listed in a table that provides the analysis ID, status, and date started. Each row includes actions available for that analysis, including viewing the analysis details and generated reports, as well as canceling or deleting the analysis.
Figure 3.7. Analysis list
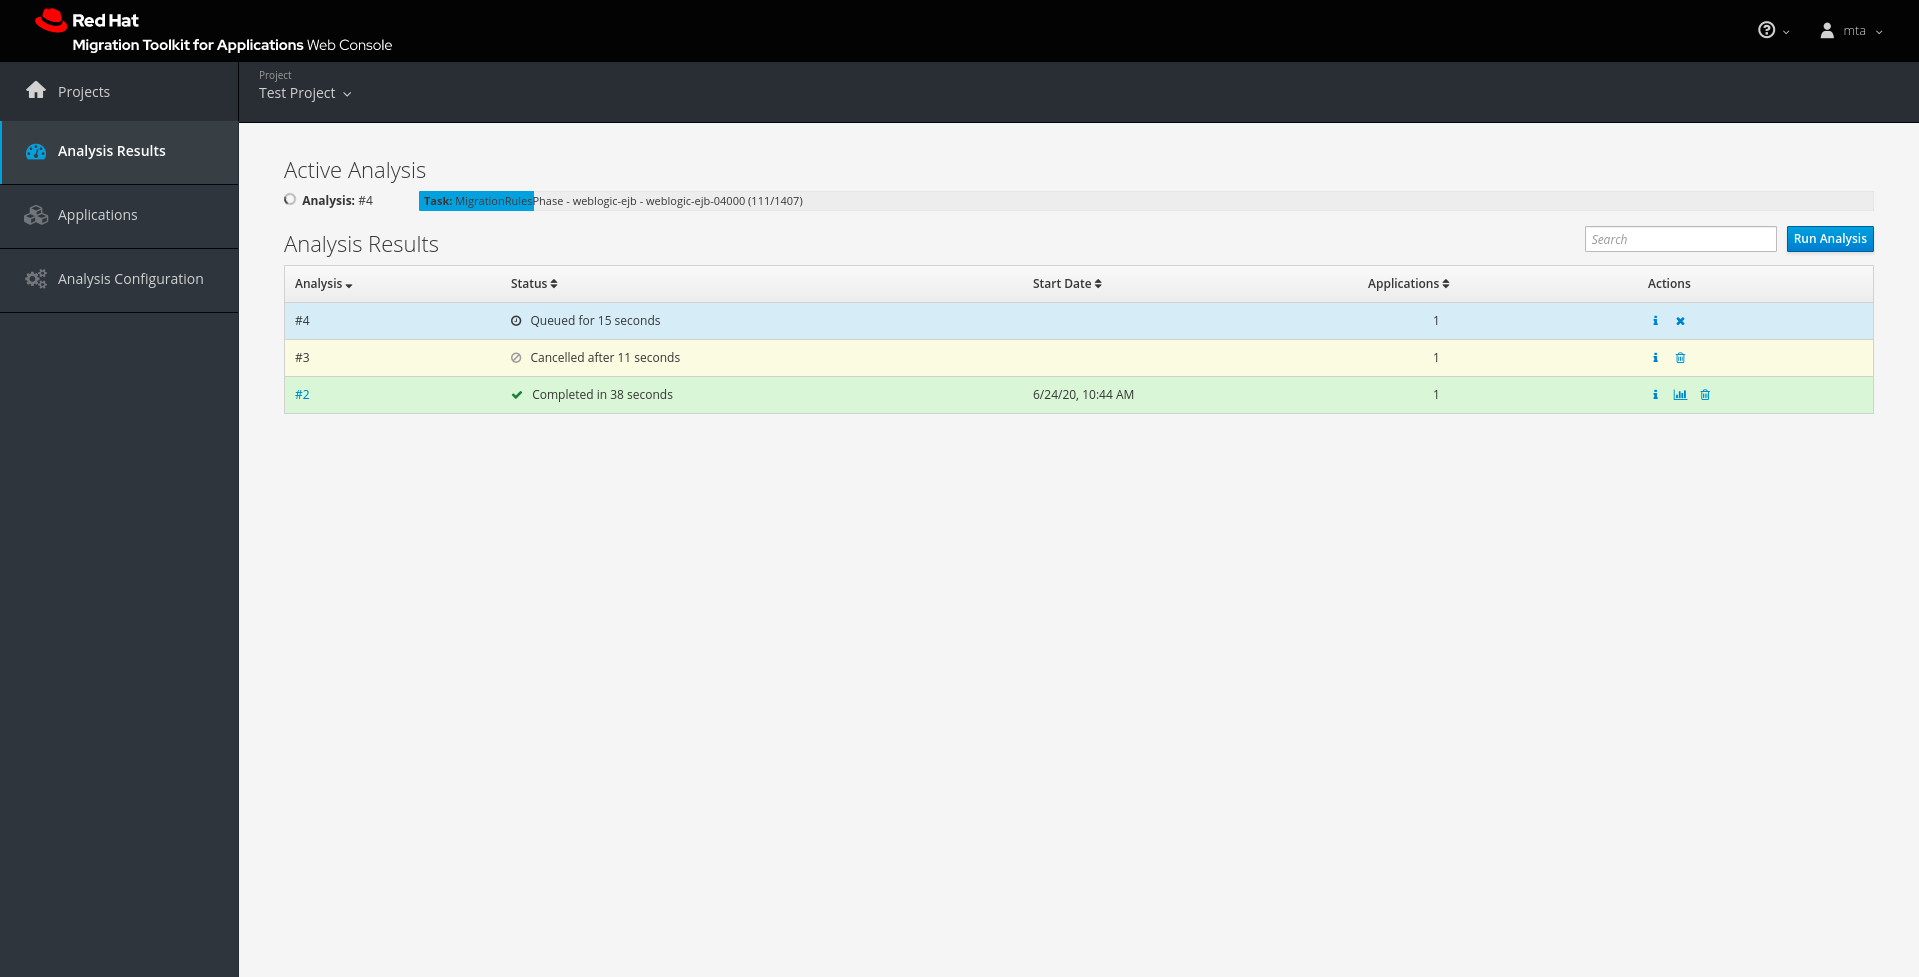
Click the link in the Analysis column to view the reports or click the information icon in the Actions column to view the analysis details.
3.5.1. Viewing analysis details
The details of an analysis can be viewed by clicking the information icon in the Actions column of the Analysis Results table.
Figure 3.8. Analysis details
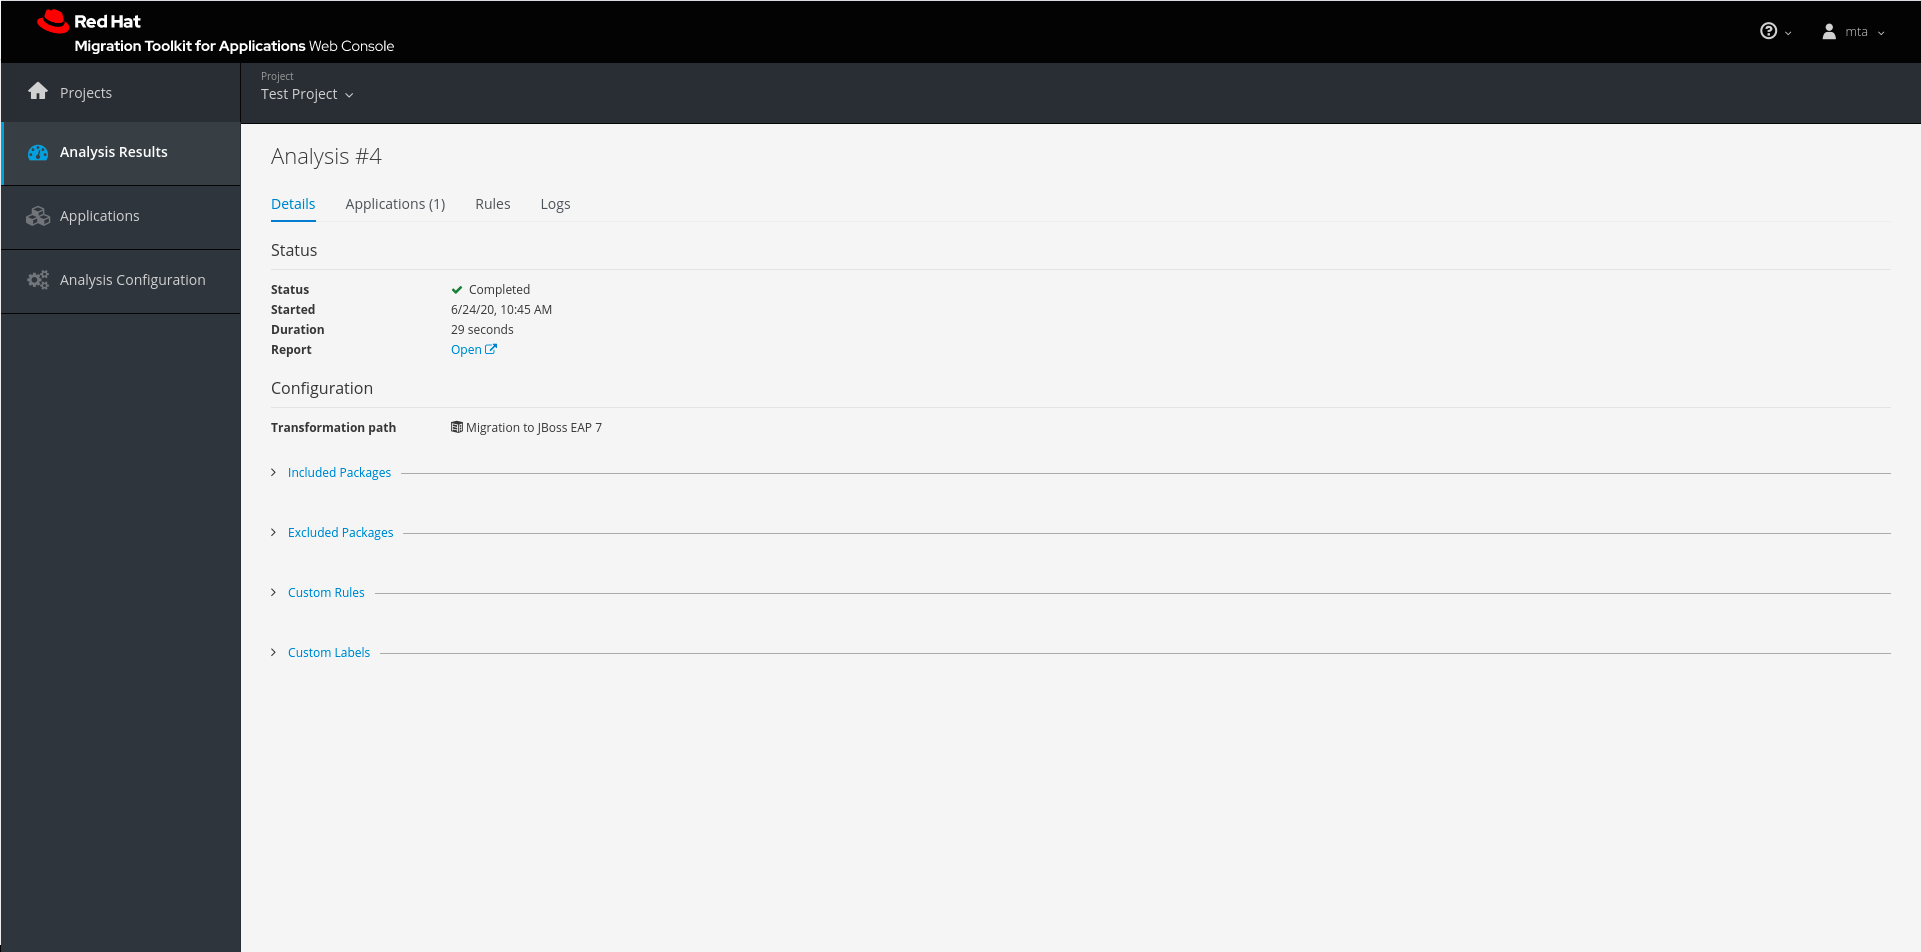
This page provides the following tabs with information about this analysis.
- Details
- This tab shows the status, start date, and duration of the analysis as well as the configuration settings that were used for this analysis.
- Applications
- This tab lists the applications that were included in this analysis.
- Rules
This tab lists the rules that were evaluated during this analysis.
NoteYou can view all system and custom rules by selecting Rules Configuration from the user drop down.
- Logs
- This tabs shows the output from this MTA analysis engine execution.
3.5.2. Reviewing reports
From the analysis table, click the report link in the Actions column to view the reports for this analysis. This opens a new window with the generated MTA reports.
Chapter 4. Using custom rules and labels
4.1. Adding custom rules
You can add your own custom rules to use during analysis of your applications. For information on writing custom MTA rules, see the MTA Rules Development Guide.
Select Rules Configuration from the User menu in the title bar to view all existing system and custom rules.
Figure 4.1. Adding custom rules
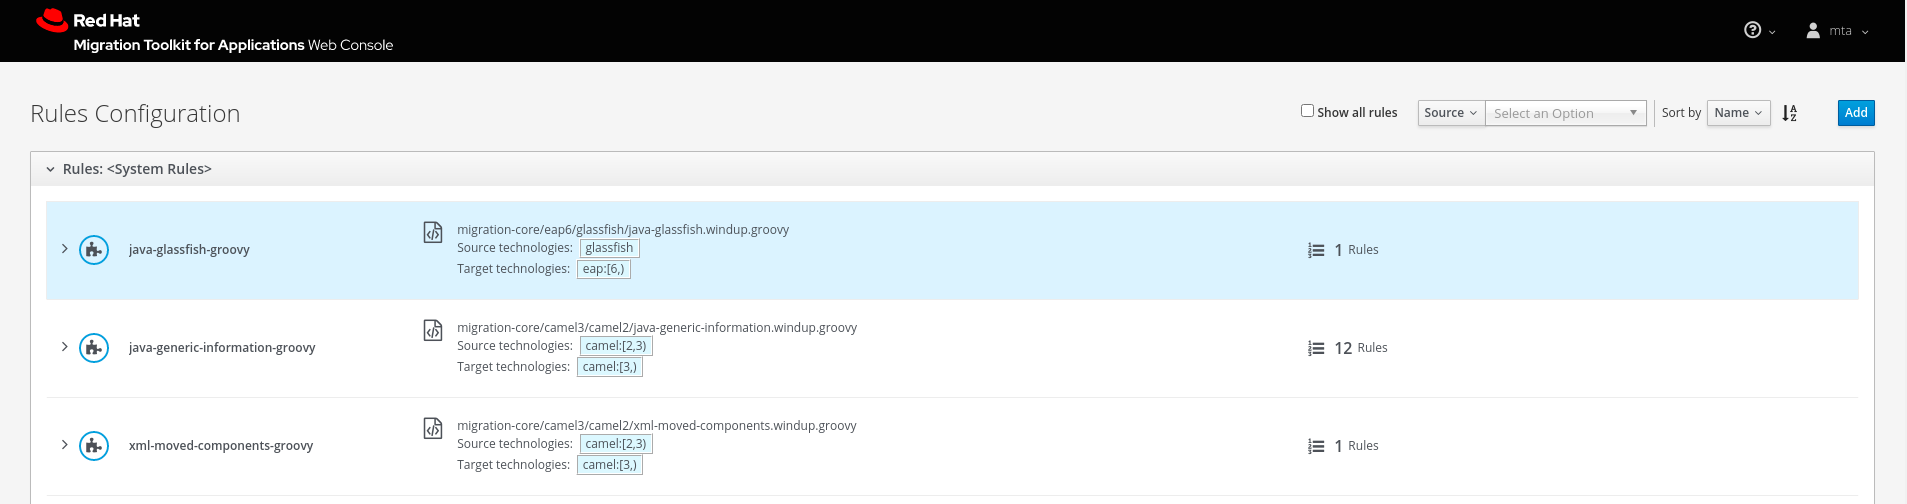
To add your own custom rules, click Add. You can upload rules or register a server path that contains the rules.
- Uploading rules
- You can use the Choose Files button to select ruleset files, or you can drag and drop the files into the area provided. This uploads the selected ruleset files to the MTA server. Click Add to upload the rules.
- Registering a server path
- Select the Server Path tab and enter a path on the server that contains rules to be available to projects. This does not copy the files to the MTA server, but instead uses the rules found in the specified location during analysis. This way, if the rules are updated in this location, the MTA server will always use the latest versions of rules during analysis. Click Add to register the rules.
Custom rulesets may be selected individually during a project analysis. To enable these select the ruleset in the Use local custom rules section of the analysis configuration.
4.2. Adding custom labels
Select Labels Configuration from the user drop down to view all existing system and custom labels.
Figure 4.2. Adding Custom Labels
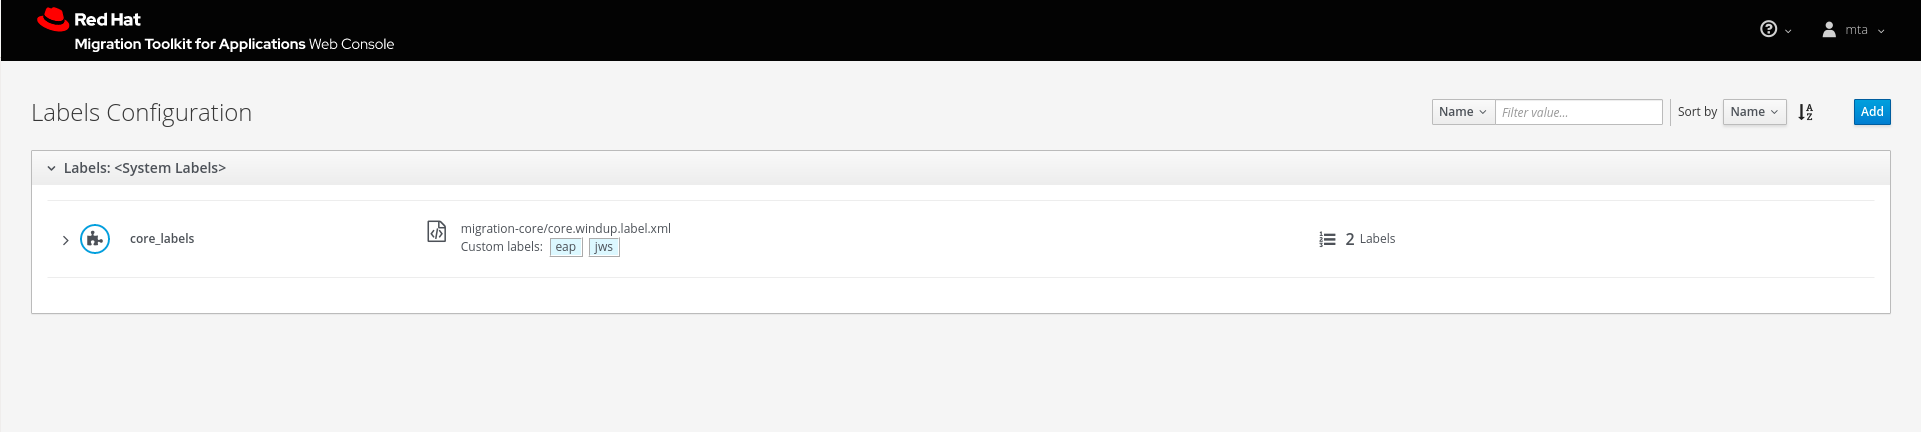
To add your own custom labels, click Add. You can upload labels or register a server path that contains the labels files.
- Uploading labels
- You can use the Choose Files button to select label files, or you can drag and drop the files into the area provided. This uploads the selected label files to the MTA server. Click Add to upload the labels.
- Registering a server path
- Select the Server Path tab and enter a path on the server that contains labels to be available to projects. This does not copy the files to the MTA server, but instead uses the labels found in the specified location during analysis.
This way, if the labels are updated in this location, the MTA server will always use the latest versions of labels during analysis. Click Add to register the labels.
Chapter 5. Configuring authentication for the Web Console
You can configure the web console to require authentication, which is handled by Red Hat Single Sign-On. When enabled, users will be required to authenticate before being granted access to the web console.
It is recommended to complete the following steps to configure authentication for the web console.
Enable authentication for the web console.
NoteIf you have installed web console on OpenShift, authentication is already enabled and cannot be disabled.
- Change the administrative user’s credentials.
- Remove the default web console user.
- Add web console users.
5.1. Enabling authentication for Web Console
If you have installed web console on OpenShift, authentication is already enabled and cannot be disabled.
Run the following script to require users to log in before accessing the web console. This script configures the Red Hat Single Sign-On login page to require users to authenticate before granting access to the web console.
$ <MTA_HOME>/switch_to_authentication_required.sh
In a Windows environment, use the switch_to_authentication_required.bat script.
Now, whenever you start the web console, users will be required to authenticate to access it.
5.2. Changing the administrative user’s credentials
When you enable authentication for the web console, a default administrative user is provided with the username admin and password password. You should change this password so that only those that are authorized can make further changes to web console users.
Follow these steps to change the default administrative user’s password.
- Make sure that the web console is running.
Open the Red Hat Single Sign-On administration console.
For a ZIP installation:
-
Navigate to
http://localhost:8080/auth/in a browser. - Select Administration Console to access the Red Hat Single Sign-On administration console.
-
Navigate to
For an OpenShift installation:
Navigate to
<OPENSHIFT_URL>/console/project/mta/overviewin a browser.NoteIf you renamed the OpenShift project when deploying, replace
mtawith the name of your project.- Click the link in the SSO HTTPS application and add "/auth" to the end of the URL.
- Select Administration Console to access the Red Hat Single Sign-On administration console.
-
Log in with the default credentials of
adminandpassword. - In the upper left corner, select the Master realm from the drop down.
- In the left-side navigation menu, select Users and then click View all users.
- From the admin user’s row, click Edit.
- Select the Credentials tab.
- Enter the new password in the New Password and Password Confirmation fields.
- Change the Temporary field to OFF to not require the user to change the password upon next login.
- Click Reset Password and then click Change password in the popup.
You can also remove this default administrative user completely and create your own administrative users. However, be sure to add the new users before removing the default user.
5.3. Removing the default Web Console user
A default web console user is provided with the web console with the username mta and password password. When you enable authentication for the web console, you should remove this user so that the web console can only be accessed by authorized users.
Follow these steps to remove the default web console user.
- Make sure that the web console is running.
Open the Red Hat Single Sign-On administration console.
For a ZIP installation:
-
Navigate to
http://localhost:8080/auth/in a browser. - Select Administration Console to access the Red Hat Single Sign-On administration console.
-
Navigate to
For an OpenShift installation:
Navigate to
<OPENSHIFT_URL>/console/project/mta/overviewin a browser.NoteIf you renamed the OpenShift project when deploying, replace
mtawith the name of your project.- Click the link in the SSO HTTPS application and add "/auth" to the end of the URL.
- Select Administration Console to access the Red Hat Single Sign-On administration console.
-
Log in with an administrative user’s credentials. The default credentials are
adminandpassword. - In the upper left corner, select the mta realm from the drop down.
- From the left-side navigation menu, select Users and then click View all users.
- From the mta user’s row, click Delete and confirm.
5.4. Adding a Web Console user
When authentication is enabled for the web console, administrators will need to add users so that they can access the web console.
Follow these steps to add a new web console user.
- Make sure that the web console is running.
Open the Red Hat Single Sign-On administration console.
For a ZIP installation:
-
Navigate to
http://localhost:8080/auth/in a browser. - Select Administration Console to access the Red Hat Single Sign-On administration console.
-
Navigate to
For an OpenShift installation:
Navigate to
<OPENSHIFT_URL>/console/project/mta/overviewin a browser.NoteIf you renamed the OpenShift project when deploying, replace
mtawith the name of your project.- Click the link in the SSO HTTPS application and add "/auth" to the end of the URL.
- Select Administration Console to access the Red Hat Single Sign-On administration console.
-
Log in with an administrative user’s credentials. The default credentials are
adminandpassword. - In the upper left corner, select the mta realm from the drop down.
- From the left-side navigation menu, select Users and then click Add user.
- Enter the Username, First Name, Last Name, and any other required fields and click Save.
- Once the user has been added, select the Credentials tab.
- Enter a temporary password in the New Password and Password Confirmation fields, and leave the Temporary field set to ON.
- Click Reset Password and then click Change password in the confirmation popup.
The user is enabled by default and will be required to set a new password when they log in to the web console with this temporary password.
Revised on 2021-01-25 11:57:14 UTC