Red Hat Training

A Red Hat training course is available for Red Hat Enterprise Linux

Power Management Guide

Red Hat Enterprise Linux 7

Managing and optimizing power consumption on RHEL 7

Logo

Red Hat, Inc.

Marie Doleželová

Red Hat Customer Content Services

Jana Heves

Red Hat Customer Content Services

Jacquelynn East

Red Hat Customer Content Services

Don Domingo

Red Hat Customer Content Services

Rüdiger Landmann

Red Hat Customer Content Services

Jack Reed

Red Hat Customer Content Services

Abstract

This document explains how to manage power consumption on Red Hat Enterprise Linux 7 systems effectively. The following sections discuss different techniques that lower power consumption (for both server and laptop), and how each technique affects the overall performance of your system.

Chapter 1. Overview

Power management has been one of our focus points for improvements for Red Hat Enterprise Linux 7. Limiting the power used by computer systems is one of the most important aspects of green IT (environmentally friendly computing), a set of considerations that also encompasses the use of recyclable materials, the environmental impact of hardware production, and environmental awareness in the design and deployment of systems. In this document, we provide guidance and information regarding power management of your systems running Red Hat Enterprise Linux 7.

1.1. Importance of Power Management

At the core of power management is an understanding of how to effectively optimize energy consumption of each system component. This entails studying the different tasks that your system performs, and configuring each component to ensure that its performance is just right for the job.
The main motivator for power management is:
  • reducing overall power consumption to save cost
The proper use of power management results in:
  • heat reduction for servers and computing centers
  • reduced secondary costs, including cooling, space, cables, generators, and uninterruptible power supplies (UPS)
  • extended battery life for laptops
  • lower carbon dioxide output
  • meeting government regulations or legal requirements regarding Green IT, for example Energy Star
  • meeting company guidelines for new systems
As a rule, lowering the power consumption of a specific component (or of the system as a whole) will lead to lower heat and naturally, performance. As such, you should thoroughly study and test the decrease in performance afforded by any configurations you make, especially for mission-critical systems.
By studying the different tasks that your system performs, and configuring each component to ensure that its performance is just sufficient for the job, you can save energy, generate less heat, and optimize battery life for laptops. Many of the principles for analysis and tuning of a system in regard to power consumption are similar to those for performance tuning. To some degree, power management and performance tuning are opposite approaches to system configuration, because systems are usually optimized either towards performance or power. This manual describes the tools that Red Hat provides and the techniques we have developed to help you in this process.
Red Hat Enterprise Linux 7 already comes with a lot of new power management features that are enabled by default. They were all selectively chosen to not impact the performance of a typical server or desktop use case. However, for very specific use cases where maximum throughput, lowest latency, or highest CPU performance is absolutely required, a review of those defaults might be necessary.
To decide whether you should optimize your machines using the techniques described in this document, ask yourself a few questions:
Q: Must I optimize?
Q: How much do I need to optimize?
Q: Will optimization reduce system performance to an unacceptable level?
Q: Will the time and resources spent to optimize the system outweigh the gains achieved?
Q:
Must I optimize?
A:
The importance of power optimization depends on whether your company has guidelines that need to be followed or if there are any regulations that you have to fulfill.
Q:
How much do I need to optimize?
A:
Several of the techniques we present do not require you to go through the whole process of auditing and analyzing your machine in detail but instead offer a set of general optimizations that typically improve power usage. Those will of course typically not be as good as a manually audited and optimized system, but provide a good compromise.
Q:
Will optimization reduce system performance to an unacceptable level?
A:
Most of the techniques described in this document impact the performance of your system noticeably. If you choose to implement power management beyond the defaults already in place in Red Hat Enterprise Linux 7, you should monitor the performance of the system after power optimization and decide if the performance loss is acceptable.
Q:
Will the time and resources spent to optimize the system outweigh the gains achieved?
A:
Optimizing a single system manually following the whole process is typically not worth it as the time and cost spent doing so is far higher than the typical benefit you would get over the lifetime of a single machine. On the other hand if you for example roll out 10000 desktop systems to your offices all using the same configuration and setup then creating one optimized setup and applying that to all 10000 machines is most likely a good idea.
The following sections will explain how optimal hardware performance benefits your system in terms of energy consumption.

1.2. Power Management Basics

Effective power management is built on the following principles:
An idle CPU should only wake up when needed

Since Red Hat Enterprise Linux 6, the kernel runs tickless which means the previous periodic timer interrupts have been replaced with on-demand interrupts. Therefore, idle CPUs are allowed to remain idle until a new task is queued for processing, and CPUs that have entered lower power states can remain in these states longer. However, benefits from this feature can be offset if your system has applications that create unnecessary timer events. Polling events, such as checks for volume changes or mouse movement are examples of such events.

Red Hat Enterprise Linux 7 includes tools with which you can identify and audit applications on the basis of their CPU usage. Refer to Chapter 2, Power Management Auditing And Analysis for details.
Unused hardware and devices should be disabled completely

This is especially true for devices that have moving parts (for example, hard disks). In addition to this, some applications may leave an unused but enabled device "open"; when this occurs, the kernel assumes that the device is in use, which can prevent the device from going into a power saving state.

Low activity should translate to low wattage

In many cases, however, this depends on modern hardware and correct BIOS configuration. Older system components often do not have support for some of the new features that we now can support in Red Hat Enterprise Linux 7. Make sure that you are using the latest official firmware for your systems and that in the power management or device configuration sections of the BIOS the power management features are enabled. Some features to look for include:

  • SpeedStep
  • PowerNow!
  • Cool'n'Quiet
  • ACPI (C state)
  • Smart
If your hardware has support for these features and they are enabled in the BIOS, Red Hat Enterprise Linux 7 will use them by default.
Different forms of CPU states and their effects

Modern CPUs together with Advanced Configuration and Power Interface (ACPI) provide different power states. The three different states are:

  • Sleep (C-states)
  • Frequency and voltage (P-states)
    P-state describes frequency of a processor and its voltage operating point, which are both scaled as the P-state increases.
  • Heat output (T-states or "thermal states")
A CPU running on the lowest sleep state possible consumes the least amount of watts, but it also takes considerably more time to wake it up from that state when needed. In very rare cases this can lead to the CPU having to wake up immediately every time it just went to sleep. This situation results in an effectively permanently busy CPU and loses some of the potential power saving if another state had been used.
A turned off machine uses the least amount of power

As obvious as this might sound, one of the best ways to actually save power is to turn off systems. For example, your company can develop a corporate culture focused on "green IT" awareness with a guideline to turn of machines during lunch break or when going home. You also might consolidate several physical servers into one bigger server and virtualize them using the virtualization technology we ship with Red Hat Enterprise Linux 7.

Chapter 2. Power Management Auditing And Analysis

2.1. Audit And Analysis Overview

The detailed manual audit, analysis, and tuning of a single system is usually the exception because the time and cost spent to do so typically outweighs the benefits gained from these last pieces of system tuning. However, performing these tasks once for a large number of nearly identical systems where you can reuse the same settings for all systems can be very useful. For example, consider the deployment of thousands of desktop systems, or a HPC cluster where the machines are nearly identical. Another reason to do auditing and analysis is to provide a basis for comparison against which you can identify regressions or changes in system behavior in the future. The results of this analysis can be very helpful in cases where hardware, BIOS, or software updates happen regularly and you want to avoid any surprises with regard to power consumption. Generally, a thorough audit and analysis gives you a much better idea of what is really happening on a particular system.
Auditing and analyzing a system with regard to power consumption is relatively hard, even with the most modern systems available. Most systems do not provide the necessary means to measure power use via software. Exceptions exist though: the ILO management console of Hewlett Packard server systems has a power management module that you can access through the web. IBM provides a similar solution in their BladeCenter power management module. On some Dell systems, the IT Assistant offers power monitoring capabilities as well. Other vendors are likely to offer similar capabilities for their server platforms, but as can be seen there is no single solution available that is supported by all vendors.
Direct measurements of power consumption is often only necessary to maximize savings as far as possible. Fortunately, other means are available to measure if changes are in effect or how the system is behaving. This chapter describes the necessary tools.

2.2. PowerTOP

The introduction of the tickless kernel in Red Hat Enterprise Linux 7 allows the CPU to enter the idle state more frequently, reducing power consumption and improving power management. The PowerTOP tool identifies specific components of kernel and user-space applications that frequently wake up the CPU. PowerTOP was used in development to perform the audits that led to many applications being tuned in this release, reducing unnecessary CPU wake up by a factor of ten.
Red Hat Enterprise Linux 7 comes with version 2.x of PowerTOP. This version is a complete rewrite of the 1.x code base. It features a clearer tab-based user interface and extensively uses the kernel "perf" infrastructure to give more accurate data. The power behavior of system devices is tracked and prominently displayed, so problems can be pinpointed quickly. More experimentally, the 2.x codebase includes a power estimation engine that can indicate how much power individual devices and processes are consuming. See Figure 2.1, “PowerTOP in Operation”.
To install PowerTOP run, as root, the following command:
~]# yum install powertop
To run PowerTOP, use, as root, the following command:
~]# powertop
PowerTOP can provide an estimate of the total power usage of the system and show individual power usage for each process, device, kernel work, timer, and interrupt handler. Laptops should run on battery power during this task. To calibrate the power estimation engine, run, as root, the following command:
~]# powertop --calibrate
Calibration takes time. The process performs various tests, and will cycle through brightness levels and switch devices on and off. Let the process finish and do not interact with the machine during the calibration. When the calibration process is completed, PowerTOP starts as normal. Let it run for approximately an hour to collect data. When enough data is collected, power estimation figures will be displayed in the first column.
If you are executing the command on a laptop, it should still be running on battery power so that all available data is presented.
While it runs, PowerTOP gathers statistics from the system. In the Overview tab, you can view a list of the components that are either sending wake-ups to the CPU most frequently or are consuming the most power (see Figure 2.1, “PowerTOP in Operation”). The adjacent columns display power estimation, how the resource is being used, wakeups per second, the classification of the component, such as process, device, or timer, and a description of the component. Wakeups per second indicates how efficiently the services or the devices and drivers of the kernel are performing. Less wakeups means less power is consumed. Components are ordered by how much further their power usage can be optimized.
Tuning driver components typically requires kernel changes, which is beyond the scope of this document. However, userland processes that send wakeups are more easily managed. First, determine whether this service or application needs to run at all on this system. If not, simply deactivate it. To turn off an old System V service permanently, run:
~]# systemctl disable servicename.service
For more details about the process, run, as root, the following commands:
~]# ps -awux | grep processname
~]# strace -p processid
If the trace looks like it is repeating itself, then it probably is a busy loop. Fixing such bugs typically requires a code change in that component.
As seen in Figure 2.1, “PowerTOP in Operation”, total power consumption and the remaining battery life are displayed, if applicable. Below these is a short summary featuring total wakeups per second, GPU operations per second, and virtual filesystem operations per second. In the rest of the screen there is a list of processes, interrupts, devices and other resources sorted according to their utilization. If properly calibrated, a power consumption estimation for every listed item in the first column is shown as well.
Use the Tab and Shift+Tab keys to cycle through tabs. In the Idle stats tab, use of C-states is shown for all processors and cores. In the Frequency stats tab, use of P-states including the Turbo mode (if applicable) is shown for all processors and cores. The longer the CPU stays in the higher C- or P-states, the better (C4 being higher than C3). This is a good indication of how well the CPU usage has been optimized. Residency should ideally be 90% or more in the highest C- or P-state while the system is idle.
The Device Stats tab provides similar information to the Overview tab but only for devices.
The Tunables tab contains suggestions for optimizing the system for lower power consumption. Use the up and down keys to move through suggestions and the enter key to toggle the suggestion on and off.
PowerTOP in Operation

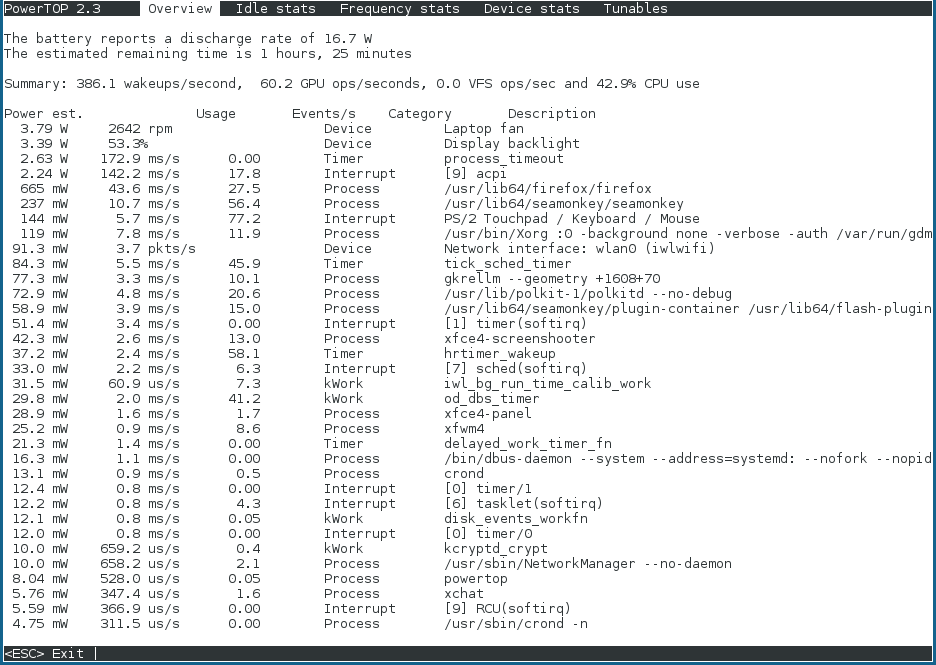
Figure 2.1. PowerTOP in Operation

You can also generate HTML reports by running PowerTOP with the --html option. Replace the htmlfile.html parameter with the required name for the output file:
~]# powertop --html=htmlfile.html
By default PowerTOP takes measurements in 20 seconds intervals, you can change it with the --time option:
~]# powertop --html=htmlfile.html --time=seconds
For more information about PowerTOP, see PowerTOP's home page.
PowerTOP can also be used in conjunction with the turbostat utility. It is a reporting tool that displays information about processor topology, frequency, idle power-state statistics, temperature, and power usage on Intel 64 processors. For more information about the turbostat utility, see the turbostat(8) man page, or read the Performance Tuning Guide.

2.3. Diskdevstat and netdevstat

Diskdevstat and netdevstat are SystemTap tools that collect detailed information about the disk activity and network activity of all applications running on a system. These tools were inspired by PowerTOP, which shows the number of CPU wakeups by every application per second (refer to Section 2.2, “PowerTOP”). The statistics that these tools collect allow you to identify applications that waste power with many small I/O operations rather than fewer, larger operations. Other monitoring tools that measure only transfer speeds do not help to identify this type of usage.
Install these tools with SystemTap with the following command as root:
~]# yum install tuned-utils-systemtap kernel-debuginfo
Run the tools with the command:
~]# diskdevstat
or the command:
~]# netdevstat
Both commands can take up to three parameters, as follows:
diskdevstat update_interval total_duration display_histogram
netdevstat update_interval total_duration display_histogram
update_interval
The time in seconds between updates of the display. Default: 5
total_duration
The time in seconds for the whole run. Default: 86400 (1 day)
display_histogram
Flag whether to histogram for all the collected data at the end of the run.
The output resembles that of PowerTOP. Here is sample output from a longer diskdevstat run:
PID  UID  DEV WRITE_CNT WRITE_MIN WRITE_MAX WRITE_AVG READ_CNT READ_MIN READ_MAX READ_AVG COMMAND
 2789  2903 sda1     854     0.000   120.000    39.836      0     0.000     0.000     0.000 plasma
 5494     0 sda1       0     0.000     0.000     0.000    758     0.000     0.012     0.000 0logwatch
 5520     0 sda1       0     0.000     0.000     0.000    140     0.000     0.009     0.000 perl
 5549     0 sda1       0     0.000     0.000     0.000    140     0.000     0.009     0.000 perl
 5585     0 sda1       0     0.000     0.000     0.000    108     0.001     0.002     0.000 perl
 2573     0 sda1      63     0.033  3600.015   515.226      0     0.000     0.000     0.000 auditd
 5429     0 sda1       0     0.000     0.000     0.000     62     0.009     0.009     0.000 crond
 5379     0 sda1       0     0.000     0.000     0.000     62     0.008     0.008     0.000 crond
 5473     0 sda1       0     0.000     0.000     0.000     62     0.008     0.008     0.000 crond
 5415     0 sda1       0     0.000     0.000     0.000     62     0.008     0.008     0.000 crond
 5433     0 sda1       0     0.000     0.000     0.000     62     0.008     0.008     0.000 crond
 5425     0 sda1       0     0.000     0.000     0.000     62     0.007     0.007     0.000 crond
 5375     0 sda1       0     0.000     0.000     0.000     62     0.008     0.008     0.000 crond
 5477     0 sda1       0     0.000     0.000     0.000     62     0.007     0.007     0.000 crond
 5469     0 sda1       0     0.000     0.000     0.000     62     0.007     0.007     0.000 crond
 5419     0 sda1       0     0.000     0.000     0.000     62     0.008     0.008     0.000 crond
 5481     0 sda1       0     0.000     0.000     0.000     61     0.000     0.001     0.000 crond
 5355     0 sda1       0     0.000     0.000     0.000     37     0.000     0.014     0.001 laptop_mode
 2153     0 sda1      26     0.003  3600.029  1290.730      0     0.000     0.000     0.000 rsyslogd
 5575     0 sda1       0     0.000     0.000     0.000     16     0.000     0.000     0.000 cat
 5581     0 sda1       0     0.000     0.000     0.000     12     0.001     0.002     0.000 perl
 5582     0 sda1       0     0.000     0.000     0.000     12     0.001     0.002     0.000 perl
 5579     0 sda1       0     0.000     0.000     0.000     12     0.000     0.001     0.000 perl
 5580     0 sda1       0     0.000     0.000     0.000     12     0.001     0.001     0.000 perl
 5354     0 sda1       0     0.000     0.000     0.000     12     0.000     0.170     0.014 s  h
 5584     0 sda1       0     0.000     0.000     0.000     12     0.001     0.002     0.000 perl
 5548     0 sda1       0     0.000     0.000     0.000     12     0.001     0.014     0.001 perl
 5577     0 sda1       0     0.000     0.000     0.000     12     0.001     0.003     0.000 perl
 5519     0 sda1       0     0.000     0.000     0.000     12     0.001     0.005     0.000 perl
 5578     0 sda1       0     0.000     0.000     0.000     12     0.001     0.001     0.000 perl
 5583     0 sda1       0     0.000     0.000     0.000     12     0.001     0.001     0.000 perl
 5547     0 sda1       0     0.000     0.000     0.000     11     0.000     0.002     0.000 perl
 5576     0 sda1       0     0.000     0.000     0.000     11     0.001     0.001     0.000 perl
 5518     0 sda1       0     0.000     0.000     0.000     11     0.000     0.001     0.000 perl
 5354     0 sda1       0     0.000     0.000     0.000     10     0.053     0.053     0.005 lm_lid.sh
The columns are:
PID
the process ID of the application
UID
the user ID under which the applications is running
DEV
the device on which the I/O took place
WRITE_CNT
the total number of write operations
WRITE_MIN
the lowest time taken for two consecutive writes (in seconds)
WRITE_MAX
the greatest time taken for two consecutive writes (in seconds)
WRITE_AVG
the average time taken for two consecutive writes (in seconds)
READ_CNT
the total number of read operations
READ_MIN
the lowest time taken for two consecutive reads (in seconds)
READ_MAX
the greatest time taken for two consecutive reads (in seconds)
READ_AVG
the average time taken for two consecutive reads (in seconds)
COMMAND
the name of the process
In this example, three very obvious applications stand out:
PID  UID  DEV WRITE_CNT WRITE_MIN WRITE_MAX WRITE_AVG READ_CNT READ_MIN READ_MAX READ_AVG COMMAND
 2789  2903 sda1     854     0.000   120.000    39.836      0     0.000     0.000     0.000 plasma
2573     0 sda1      63     0.033  3600.015   515.226      0     0.000     0.000     0.000 auditd
 2153     0 sda1      26     0.003  3600.029  1290.730      0     0.000     0.000     0.000 rsyslogd
These three applications have a WRITE_CNT greater than 0, which means that they performed some form of write during the measurement. Of those, plasma was the worst offender by a large degree: it performed the most write operations, and of course the average time between writes was the lowest. Plasma would therefore be the best candidate to investigate if you were concerned about power-inefficient applications.
Use the strace and ltrace commands to examine applications more closely by tracing all system calls of the given process ID. In the present example, you could run:
~]# strace -p 2789
In this example, the output of the strace contained a repeating pattern every 45 seconds that opened the KDE icon cache file of the user for writing followed by an immediate close of the file again. This led to a necessary physical write to the hard disk as the file metadata (specifically, the modification time) had changed. The final fix was to prevent those unnecessary calls when no updates to the icons had occurred.

2.4. Battery Life Tool Kit

Red Hat Enterprise Linux 7 introduces the Battery Life Tool Kit (BLTK), a test suite that simulates and analyzes battery life and performance. BLTK achieves this by performing sets of tasks that simulate specific user groups and reporting on the results. Although developed specifically to test notebook performance, BLTK can also report on the performance of desktop computers when started with the -a.
BLTK allows you to generate very reproducible workloads that are comparable to real use of a machine. For example, the office workload writes a text, corrects things in it, and does the same for a spreadsheet. Running BLTK combined with PowerTOP or any of the other auditing or analysis tool allows you to test if the optimizations you performed have an effect when the machine is actively in use instead of only idling. Because you can run the exact same workload multiple times for different settings, you can compare results for different settings.
Install BLTK with the command:
~]# yum install bltk
Run BLTK with the command:
~]$ bltk workload options
For example, to run the idle workload for 120 seconds:
~]$ bltk -I -T 120
The workloads available by default are:
-I, --idle
system is idle, to use as a baseline for comparison with other workloads
-R, --reader
simulates reading documents (by default, with Firefox)
-P, --player
simulates watching multimedia files from a CD or DVD drive (by default, with mplayer)
-O, --office
simulates editing documents with the OpenOffice.org suite
Other options allow you to specify:
-a, --ac-ignore
ignore whether AC power is available (necessary for desktop use)
-T number_of_seconds, --time number_of_seconds
the time (in seconds) over which to run the test; use this option with the idle workload
-F filename, --file filename
specifies a file to be used by a particular workload, for example, a file for the player workload to play instead of accessing the CD or DVD drive
-W application, --prog application
specifies an application to be used by a particular workload, for example, a browser other than Firefox for the reader workload
BLTK supports a large number of more specialized options. For details, see the bltk man page.
BLTK saves the results that it generates in a directory specified in the /etc/bltk.conf configuration file — by default, ~/.bltk/workload.results.number/. For example, the ~/.bltk/reader.results.002/ directory holds the results of the third test with the reader workload (the first test is not numbered). The results are spread across several text files. To condense these results into a format that is easy to read, run:
~]$ bltk_report path_to_results_directory
The results now appear in a text file named Report in the results directory. To view the results in a terminal emulator instead, use the -o option:
~]$ bltk_report -o path_to_results_directory

2.5. Tuned

Tuned is a profile-based system tuning tool that uses the udev device manager to monitor connected devices, and enables both static and dynamic tuning of system settings. Dynamic tuning is an experimental feature and is turned off by default in Red Hat Enterprise Linux 7.
Tuned offers predefined profiles to handle common use cases, such as high throughput, low latency, or power saving. You can modify the Tuned rules for each profile and customize how to tune a particular device. For instructions on how to create custom Tuned profiles, from PowerTOP suggestions, see the section called “Using powertop2tuned”.
A profile is automatically set as default based on the product in use. You can use the tuned-adm recommend command to determine which profile Red Hat recommends as the most suitable for a particular product. If no recommendation is available, the balanced profile is set.
The balanced profile, which is suitable for most workloads, balances energy consumption, performance, and latency. With the balanced profile, finishing a task quickly with the maximum available computing power usually requires less energy than performing the same task over a longer period of time with less computing power.
Using the powersave profile can prolong battery life if a laptop is in an idle state, or performing only computationally undemanding operations. For such operations, higher latency in return for lower energy consumption is generally acceptable, or the operations do not need to be finished quickly, for example using IRC, viewing simple web pages, or playing audio and video files.
For detailed information on Tuned and power-saving profiles provided with tuned-adm, see the Tuned chapter in the Red Hat Enterprise Linux 7 Performance Tuning Guide.

Using powertop2tuned

The powertop2tuned utility allows you to create custom Tuned profiles from PowerTOP suggestions. For information on PowerTOP, see Section 2.2, “PowerTOP”.
To install the powertop2tuned utility, use:
~]# yum install tuned-utils
To create a custom profile, use:
~]# powertop2tuned new_profile_name
By default, powertop2tuned creates profiles in the /etc/tuned/ directory, and bases the custom profile on the currently selected Tuned profile. For safety reasons, all PowerTOP tunings are initially disabled in the new profile. To enable tunings, uncomment them in the /etc/tuned/profile_name/tuned.conf file.
You can use the --enable or -e option to generate a new profile that enables most of the tunings suggested by PowerTOP. Certain potentially problematic tunings, such as the USB autosuspend, are disabled by default and need to be uncommented manually.
By default, the new profile is not activated. To activate it, use:
~]# tuned-adm profile new_profile_name
For a complete list of options that powertop2tuned supports, use:
~]$ powertop2tuned --help

2.6. UPower

In Red Hat Enterprise Linux 6 DeviceKit-power assumed the power management functions that were part of HAL and some of the functions that were part of GNOME Power Manager in previous releases of Red Hat Enterprise Linux (refer also to Section 2.7, “GNOME Power Manager”. Red Hat Enterprise Linux 7, DeviceKit-power was renamed to UPower. UPower provides a daemon, an API, and a set of command-line tools. Each power source on the system is represented as a device, whether it is a physical device or not. For example, a laptop battery and an AC power source are both represented as devices.
You can access the command-line tools with the upower command and the following options:
--enumerate, -e
displays an object path for each power devices on the system, for example:
/org/freedesktop/UPower/devices/line_power_AC
/org/freedesktop/UPower/devices/battery_BAT0
--dump, -d
displays the parameters for all power devices on the system.
--wakeups, -w
displays the CPU wakeups on the system.
--monitor, -m
monitors the system for changes to power devices, for example, the connection or disconnection of a source of AC power, or the depletion of a battery. Press Ctrl+C to stop monitoring the system.
--monitor-detail
monitors the system for changes to power devices, for example, the connection or disconnection of a source of AC power, or the depletion of a battery. The --monitor-detail option presents more detail than the --monitor option. Press Ctrl+C to stop monitoring the system.
--show-info object_path, -i object_path
displays all information available for a particular object path. For example, to obtain information about a battery on your system represented by the object path /org/freedesktop/UPower/devices/battery_BAT0, run:
~]$ upower -i /org/freedesktop/UPower/devices/battery_BAT0

2.7. GNOME Power Manager

GNOME Power Manager is a daemon that is installed as part of the GNOME desktop environment. Much of the power-management functionality that GNOME Power Manager provided in earlier versions of Red Hat Enterprise Linux has become part of the DeviceKit-power tool in Red Hat Enterprise Linux 6, renamed to UPower in Red Hat Enterprise Linux 7 (see Section 2.6, “UPower”). However, GNOME Power Manager remains a front end for that functionality. Through an applet in the system tray, GNOME Power Manager notifies you of changes in your system's power status; for example, a change from battery to AC power. It also reports battery status, and warns you when battery power is low.

2.8. Other Tools For Auditing

Red Hat Enterprise Linux7 offers a few more tools with which to perform system auditing and analysis. Most of them can be used as supplementary sources of information in case you want to verify what you have discovered already or in case you need more in-depth information on certain parts. Many of these tools are used for performance tuning as well. They include:
vmstat
vmstat gives you detailed information about processes, memory, paging, block I/O, traps, and CPU activity. Use it to take a closer look at what the system overall does and where it is busy.
iostat
iostat is similar to vmstat, but only for I/O on block devices. It also provides more verbose output and statistics.
blktrace
blktrace is a very detailed block I/O trace program. It breaks down information to single blocks associated with applications. It is very useful in combination with diskdevstat.

Chapter 3. Core Infrastructure and Mechanics

Important

To use the cpupower command featured in this chapter, ensure you have the kernel-tools package installed.

3.1. CPU Idle States

CPUs with the x86 architecture support various states in which parts of the CPU are deactivated or run at lower performance settings. These states, known as C-states, allow systems to save power by partially deactivating CPUs that are not in use. C-states are numbered from C0 upwards, with higher numbers representing decreased CPU functionality and greater power saving. C-States of a given number are broadly similar across processors, although the exact details of the specific feature sets of the state may vary between processor families. C-States 0–3 are defined as follows:
C0
the operating or running state. In this state, the CPU is working and not idle at all.
C1, Halt
a state where the processor is not executing any instructions but is typically not in a lower power state. The CPU can continue processing with practically no delay. All processors offering C-States need to support this state. Pentium 4 processors support an enhanced C1 state called C1E that actually is a state for lower power consumption.
C2, Stop-Clock
a state where the clock is frozen for this processor but it keeps the complete state for its registers and caches, so after starting the clock again it can immediately start processing again. This is an optional state.
C3, Sleep
a state where the processor really goes to sleep and does not need to keep its cache up to date. Waking up from this state takes considerably longer than from C2 due to this. Again this is an optional state.
To view available idle states and other statistics for the CPUidle driver, enter:
~]$ cpupower idle-info
Recent Intel CPUs with the "Nehalem" microarchitecture feature a new C-State, C6, which can reduce the voltage supply of a CPU to zero, but typically reduces power consumption by between 80% and 90%. The kernel in Red Hat Enterprise Linux 7 includes optimizations for this new C-State.

3.2. CPUfreq

One of the most effective ways to reduce power consumption and heat output on your system is CPUfreq. CPUfreq — also referred to as CPU speed scaling — is the infrastructure in the Linux kernel that enables to scale the CPU frequency in order to save power. CPU scalling can be done automatically depending on the system load, in response to ACPI events, or manually by user-space programs, and it allows the clock speed of the processor to be adjusted on the fly. This enables the system to run at a reduced clock speed to save power. The rules for shifting frequencies, whether to a faster or slower clock speed, and when to shift frequencies, are defined by the CPUfreq governor.

3.2.1. CPUfreq drivers

Two drivers for CPUfreq can be used: ACPI CPUfreq driver and Intel P-state driver.

ACPI CPUfreq

ACPI CPUfreq driver is a kernel driver that controls the frequency of a particular CPU through ACPI, which ensures the communication between the kernel and the hardware.

Intel P-state

In Red Hat Enterprise Linux 7, Intel P-state driver is supported. The driver provides an interface for controlling the P-state selection on processors based on the Intel Xeon E series architecture or newer architectures. Intel P-state implements the setpolicy() callback. The driver decides what P-state to use based on the policy requested from the cpufreq core. If the processor is capable of selecting its next P-state internally, the driver offloads this responsibility to the processor. If not, the driver implements algorithms to select the next P-state.
Intel P-state provides its own sysfs files to control the P-state selection. These files are located in the /sys/devices/system/cpu/intel_pstate/ directory. Any changes made to the files are applicable to all CPUs. This directory contains five files that are used for setting P-state parameters:
  • max_perf_pct: Limits the maximum P-state requested by the driver, expressed in a percentage of available performance. The available P-state performance can be reduced by the no_turbo setting (see below).
  • min_perf_pct: min_perf_pct: Limits the minimum P-state requested by the driver, expressed in a percentage of the maximum (no-turbo) performance level.
  • no_turbo: Limits the driver to selecting P-state below the turbo frequency range.
  • turbo_pct: Displays the percentage of the total performance supported by hardware that is in the turbo range. This number is independent of whether turbo has been disabled or not.
  • num_pstates: Displays the number of P-states that are supported by hardware. This number is independent of whether turbo has been disabled or not.
Currently, Intel P-state is used by default for supported CPUs. Users can switch to using ACPI CPUfreq by adding the following to the kernel command line:
intel_pstate=disable

3.2.2. CPUfreq Governors

A CPUfreq governor defines the power characteristics of the system CPU, which in turn affects CPU performance. Each governor has its own unique behavior, purpose, and suitability in terms of workload. This section describes how to choose and configure a CPUfreq governor, the characteristics of each governor, and what kind of workload each governor is suitable for.

Warning

Red Hat Enterprise Linux 7 includes multiple core CPUfreq governors. The Intel P-state driver by default operates in the active mode, in which only two CPUfreq governors are available: performance and powersave. Note that the functionality of performance and powersave Intel P-state CPUfreq governors is different compared to core CPUfreq governors of the same names.

3.2.2.1. Core CPUfreq Governors

Different types of CPUfreq governors available in Red Hat Enterprise Linux 7 are listed here:
cpufreq_performance

The Performance governor forces the CPU to use the highest possible clock frequency. This frequency will be statically set, and will not change. As such, this particular governor offers no power saving benefit. It is only suitable for hours of heavy workload, and even then only during times wherein the CPU is rarely (or never) idle.

cpufreq_powersave

By contrast, the Powersave governor forces the CPU to use the lowest possible clock frequency. This frequency will be statically set, and will not change. As such, this particular governor offers maximum power savings, but at the cost of the lowest CPU performance.

The term "powersave" can sometimes be deceiving, though, since (in principle) a slow CPU on full load consumes more power than a fast CPU that is not loaded. As such, while it may be advisable to set the CPU to use the Powersave governor during times of expected low activity, any unexpected high loads during that time can cause the system to actually consume more power.
The Powersave governor is, in simple terms, more of a "speed limiter" for the CPU than a "power saver". It is most useful in systems and environments where overheating can be a problem.
cpufreq_ondemand

The Ondemand governor is a dynamic governor that allows the CPU to achieve maximum clock frequency when system load is high, and also minimum clock frequency when the system is idle. While this allows the system to adjust power consumption accordingly with respect to system load, it does so at the expense of latency between frequency switching. As such, latency can offset any performance/power saving benefits offered by the Ondemand governor if the system switches between idle and heavy workloads too often.

For most systems, the Ondemand governor can provide the best compromise between heat emission, power consumption, performance, and manageability. When the system is only busy at specific times of the day, the Ondemand governor will automatically switch between maximum and minimum frequency depending on the load without any further intervention.
cpufreq_userspace

The Userspace governor allows user-space programs, or any process running as root, to set the frequency. Of all the governors, Userspace is the most customizable; and depending on how it is configured, it can offer the best balance between performance and consumption for your system.

cpufreq_conservative

Like the Ondemand governor, the Conservative governor also adjusts the clock frequency according to usage (like the Ondemand governor). However, while the Ondemand governor does so in a more aggressive manner (that is from maximum to minimum and back), the Conservative governor switches between frequencies more gradually.

This means that the Conservative governor will adjust to a clock frequency that it deems fitting for the load, rather than simply choosing between maximum and minimum. While this can possibly provide significant savings in power consumption, it does so at an ever greater latency than the Ondemand governor.

Note

You can enable a governor using cron jobs. This allows you to automatically set specific governors during specific times of the day. As such, you can specify a low-frequency governor during idle times (for example after work hours) and return to a higher-frequency governor during hours of heavy workload.
For instructions on how to enable a specific governor, see Section 3.2.3, “CPUfreq Setup”.

3.2.2.2. Intel P-state CPUfreq Governors

The Intel P-state driver can operate in three different modes:
  • Active mode with hardware-managed P-states (HWP)
  • Active mode without hardware-managed P-states (HWP)
  • Passive mode
By default, the Intel P-state driver operates in active mode with or without HWP depending on whether the CPU supports HWP.
Active mode with hardware-managed P-states
When active mode with HWP is used, the Intel P-state driver instructs the CPU to perform the P-state selection. The driver can provide frequency hints. However, the final selection depends on CPU internal logic.
In active mode with HWP, the Intel P-state driver provides two P-state selection algorithms:
  • Performance
  • Powersave
With the Performance governor, the driver instructs internal CPU logic to be performance-oriented. The range of allowed P-states is restricted to the upper boundary of the range that the driver is allowed to use.
With the Powersave governor, the driver instructs internal CPU logic to be powersave-oriented.
Active mode without hardware-managed P-states
When active mode without HWP is used, the Intel P-state driver provides two P-state selection algorithms:
  • Performance
  • Powersave
With the Performance governor, the driver chooses the maximum P-state it is allowed to use.
With the Powersave governor, the driver chooses P-states proportional to the current CPU utilization. The behavior is similar to the Ondemand CPUfreq core governor.
Passive mode
When passive mode is used, the Intel P-state driver functions the same as traditional CPUfreq scaling driver. All available generic CPUFreq core governors can be used.
For more details about Intel P-state governors, see intel_pstate CPU Performance Scaling Driver.

3.2.3. CPUfreq Setup

All CPUfreq drivers are built in as part of the kernel-tools package, and selected automatically, so to set up CPUfreq you just need to select a governor.
You can view which governors are available for use for a specific CPU using:
~]# cpupower frequency-info --governors
You can then enable one of these governors on all CPUs using:
~]# cpupower frequency-set --governor [governor]
To only enable a governor on specific cores, use -c with a range or comma-separated list of CPU numbers. For example, to enable the Userspace governor for CPUs 1-3 and 5, the command would be:
~]# cpupower -c 1-3,5 frequency-set --governor cpufreq_userspace

3.2.4. Tuning CPUfreq Policy and Speed

Once you have chosen an appropriate CPUfreq governor, you can view CPU speed and policy information with the cpupower frequency-info command and further tune the speed of each CPU with options for cpupower frequency-set.
For cpupower frequency-info, the following options are available:
  • --freq — Shows the current speed of the CPU according to the CPUfreq core, in KHz.
  • --hwfreq — Shows the current speed of the CPU according to the hardware, in KHz (only available as root).
  • --driver — Shows what CPUfreq driver is used to set the frequency on this CPU.
  • --governors — Shows the CPUfreq governors available in this kernel. If you wish to use a CPUfreq governor that is not listed in this file, see Section 3.2.3, “CPUfreq Setup” for instructions on how to do so.
  • --affected-cpus — Lists CPUs that require frequency coordination software.
  • --policy — Shows the range of the current CPUfreq policy, in KHz, and the currently active governor.
  • --hwlimits — Lists available frequencies for the CPU, in KHz.
For cpupower frequency-set, the following options are available:
  • --min <freq> and --max <freq> — Set the policy limits of the CPU, in KHz.

    Important

    When setting policy limits, you should set --max before --min.
  • --freq <freq> — Set a specific clock speed for the CPU, in KHz. You can only set a speed within the policy limits of the CPU (as per --min and --max).
  • --governor <gov> — Set a new CPUfreq governor.

Note

If you do not have the kernel-tools package installed, CPUfreq settings can be viewed in the tunables found in /sys/devices/system/cpu/[cpuid]/cpufreq/. Settings and values can be changed by writing to these tunables. For example, to set the minimum clock speed of cpu0 to 360 KHz, use:
echo 360000 > /sys/devices/system/cpu/cpu0/cpufreq/scaling_min_freq

3.3. CPU Monitors

cpupower features a selection of monitors that provide idle and sleep state statistics and frequency information and report on processor topology. Some monitors are processor-specific, while others are compatible with any processor. Refer to the cpupower-monitor man page for details on what each monitor measures and which systems they are compatible with.
Use the following options with the cpupower monitor command:
  • -l — list all monitors available on your system.
  • -m <monitor1>, <monitor2> — display specific monitors. Their identifiers can be found by running -l.
  • command — display the idle statistics and CPU demands of a specific command.

3.4. CPU Power Saving Policies

cpupower provides ways to regulate your processor's power saving policies.
Use the following options with the cpupower set command:
--perf-bias <0-15>
Allows software on supported Intel processors to more actively contribute to determining the balance between optimum performance and saving power. This does not override other power saving policies. Assigned values range from 0 to 15, where 0 is optimum performance and 15 is optimum power efficiency.
By default, this option applies to all cores. To apply it only to individual cores, add the --cpu <cpulist> option.
--sched-mc <0|1|2>
Restricts the use of power by system processes to the cores in one CPU package before other CPU packages are drawn from. 0 sets no restrictions, 1 initially employs only a single CPU package, and 2 does this in addition to favouring semi-idle CPU packages for handling task wakeups.
--sched-smt <0|1|2>
Restricts the use of power by system processes to the thread siblings of one CPU core before drawing on other cores. 0 sets no restrictions, 1 initially employs only a single CPU package, and 2 does this in addition to favouring semi-idle CPU packages for handling task wakeups.

3.5. Suspend and Resume

When a system is suspended, the kernel calls on drivers to store their states and then unloads them. When the system is resumed, it reloads these drivers, which attempt to reprogram their devices. The drivers' ability to accomplish this task determines whether the system can be resumed successfully.
Video drivers are particularly problematic in this regard, because the Advanced Configuration and Power Interface (ACPI) specification does not require system firmware to be able to reprogram video hardware. Therefore, unless video drivers are able to program hardware from a completely uninitialized state, they may prevent the system from resuming.
Red Hat Enterprise Linux 7 includes greater support for new graphics chipsets, which ensures that suspend and resume will work on a greater number of platforms. In particular, support for NVIDIA chipsets has been greatly improved; in particular for the GeForce 8800 series.

3.6. Runtime Device Power Management

Runtime device power management (RDPM) helps to reduce power consumption with minimum user-visible impact. If a device has been idle for a sufficient time and the RDPM hardware support exists in both the device and driver, the device is put into a lower power state. The recovery from the lower power state is assured by an external I/O event for this device, which triggers the kernel and the device driver to bring the device back to the running state. All this occurs automatically, as RDPM is enabled by default.
Users are allowed to control RDPM of a device by setting the attribute in a particular RDPM configuration file. The RDPM configuration files for particular devices can be found in the /sys/devices/device/power/ directory, where device replaces the path to the directory of a particular device.
For example, to configure the RDPM for a CPU, access this directory:
/sys/devices/system/cpu/power/
Bringing a device back from a lower power state to the running state adds additional latency to the next I/O operation. The duration of that additional delay is device-specific. The configuration scheme described here allows the system administrator to disable RDPM on a device-by-device basis and to both examine and control some of the other parameters. Every /sys/devices/device/power directory contains the following configuration files:

control

This file is used to enable or disable RDPM for a particular device. All devices have one of the following two values of the attribute in the control file:

auto
default for all devices, they may be subject to automatic RDPM, depending on their driver
on
prevents the driver from managing the device's power state at run time

autosuspend_delay_ms

This file controls the auto-suspend delay, which is the minimum time period of inactivity between idle state and suspending of the device. The file contains the auto-suspend delay value in milliseconds. A negative value prevents the device from being suspended at run time, thus having the same effect as setting the attribute in the /sys/devices/device/power/control file to on. Values higher than 1000 are rounded up to the nearest second.

3.7. Active-State Power Management

Active-State Power Management (ASPM) saves power in the Peripheral Component Interconnect Express (PCI Express or PCIe) subsystem by setting a lower power state for PCIe links when the devices to which they connect are not in use. ASPM controls the power state at both ends of the link, and saves power in the link even when the device at the end of the link is in a fully powered-on state.
When ASPM is enabled, device latency increases because of the time required to transition the link between different power states. ASPM has three policies to determine power states:
default
sets PCIe link power states according to the defaults specified by the firmware on the system (for example, BIOS). This is the default state for ASPM.
powersave
sets ASPM to save power wherever possible, regardless of the cost to performance.
performance
disables ASPM to allow PCIe links to operate with maximum performance.
You can forcibly enable or disable ASPM support by using the pcie_aspm kernel parameter:
  • pcie_aspm=off disables ASPM
  • pcie_aspm=force enables ASPM, even on devices that do not support ASPM
If the hardware supports ASPM, the operating system enables ASPM automatically at boot time. To check the ASPM support, see the output of the following command:
~]$ journalctl -b | grep ASPM

Warning

If you forcibly enable ASPM by using pcie_aspm=force on hardware that does not support ASPM, the system might become unresponsive. Before setting pcie_aspm=force, ensure that all PCIe hardware on the system supports ASPM.
To set the ASPM policies, use one of the following options:
  • modify the settings in the /sys/module/pcie_aspm/parameters/policy file
  • specify the pcie_aspm.policy kernel parameter at boot time
    For example, pcie_aspm.policy=performance sets the ASPM performance policy.

3.8. Aggressive Link Power Management

Aggressive Link Power Management (ALPM) is a power-saving technique that helps the disk save power by setting a SATA link to the disk to a low-power setting during idle time (that is when there is no I/O). ALPM automatically sets the SATA link back to an active power state once I/O requests are queued to that link.
Power savings introduced by ALPM come at the expense of disk latency. As such, you should only use ALPM if you expect the system to experience long periods of idle I/O time.
ALPM is only available on SATA controllers that use the Advanced Host Controller Interface (AHCI). For more information about AHCI, see http://www.intel.com/technology/serialata/ahci.htm.
When available, ALPM is enabled by default. ALPM has three modes:
min_power

This mode sets the link to its lowest power state (SLUMBER) when there is no I/O on the disk. This mode is useful for times when an extended period of idle time is expected.

medium_power

This mode sets the link to the second lowest power state (PARTIAL) when there is no I/O on the disk. This mode is designed to allow transitions in link power states (for example during times of intermittent heavy I/O and idle I/O) with as small impact on performance as possible.

medium_power mode allows the link to transition between PARTIAL and fully-powered (that is "ACTIVE") states, depending on the load. Note that it is not possible to transition a link directly from PARTIAL to SLUMBER and back; in this case, either power state cannot transition to the other without transitioning through the ACTIVE state first.
max_performance

ALPM is disabled; the link does not enter any low-power state when there is no I/O on the disk.

To check whether your SATA host adapters actually support ALPM you can check if the file /sys/class/scsi_host/host*/link_power_management_policy exists. To change the settings simply write the values described in this section to these files or display the files to check for the current setting.

Important

Setting ALPM to min_power or medium_power will automatically disable the "Hot Plug" feature.

3.9. Relatime Drive Access Optimization

The POSIX standard requires that operating systems maintain file system metadata that records when each file was last accessed. This timestamp is called atime, and maintaining it requires a constant series of write operations to storage. These writes keep storage devices and their links busy and powered up. Since few applications make use of the atime data, this storage device activity wastes power. Significantly, the write to storage would occur even if the file was not read from storage, but from cache. For some time, the Linux kernel has supported a noatime option for mount and would not write atime data to file systems mounted with this option. However, simply turning off this feature is problematic because some applications rely on atime data and will fail if it is not available.
The kernel used in Red Hat Enterprise Linux 7 supports another alternative — relatime. Relatime maintains atime data, but not for each time that a file is accessed. With this option enabled, atime data is written to the disk only if the file has been modified since the atime data was last updated (mtime), or if the file was last accessed more than a certain length of time ago (by default, one day).
By default, all filesystems are now mounted with relatime enabled. You can suppress it for any particular file system by mounting that file system with the option norelatime.

3.10. Power Capping

Red Hat Enterprise Linux 7 supports the power capping features found in recent hardware, such as HP Dynamic Power Capping (DPC), and Intel Node Manager (NM) technology. Power capping allows administrators to limit the power consumed by servers, but it also allows managers to plan data centers more efficiently, because the risk of overloading existing power supplies is greatly diminished. Managers can place more servers within the same physical footprint and have confidence that if server power consumption is capped, the demand for power during heavy load will not exceed the power available.
HP Dynamic Power Capping

Dynamic Power Capping is a feature available on select ProLiant and BladeSystem servers that allows system administrators to cap the power consumption of a server or a group of servers. The cap is a definitive limit that the server will not exceed, regardless of its current workload. The cap has no effect until the server reaches its power consumption limit. At that point, a management processor adjusts CPU P-states and clock throttling to limit the power consumed.

Dynamic Power Capping modifies CPU behavior independently of the operating system, however, HP's integrated Lights-Out 2 (iLO2) firmware allows operating systems access to the management processor and therefore applications in user space can query the management processor. The kernel used in Red Hat Enterprise Linux 7 includes a driver for HP iLO and iLO2 firmware, which allows programs to query management processors at /dev/hpilo/dXccbN. The kernel also includes an extension of the hwmon sysfs interface to support power capping features, and a hwmon driver for ACPI 4.0 power meters that use the sysfs interface. Together, these features allow the operating system and user-space tools to read the value configured for the power cap, together with the current power usage of the system.
For further details of HP Dynamic Power Capping, see the HPE Knowledge Article HP ProLiant Gen8 Server Series - Power Capping and Dynamic Power Capping Settings in iLO 4 and RBSU, available from https://support.hpe.com/hpsc/doc/public/display?docId=mmr_sf-EN_US000006556.
Intel Node Manager

Intel Node Manager imposes a power cap on systems, using processor P-states and T-states to limit CPU performance and therefore power consumption. By setting a power management policy, administrators can configure systems to consume less power during times when system loads are low, for example, at night or on weekends.

Intel Node Manager adjusts CPU performance using Operating System-directed configuration and Power Management (OSPM) through the standard Advanced Configuration and Power Interface. When Intel Node Manager notifies the OSPM driver of changes to T-states, the driver makes corresponding changes to processor P-states. Similarly, when Intel Node Manager notifies the OSPM driver of changes to P-states, the driver changes T-states accordingly. These changes happen automatically and require no further input from the operating system. Administrators configure and monitor Intel Node Manager with Intel Data Center Manager (DCM) software.

3.11. Enhanced Graphics Power Management

Red Hat Enterprise Linux 7 saves power on graphics and display devices by eliminating several sources of unnecessary consumption.
LVDS reclocking

Low-voltage differential signaling (LVDS) is an system for carrying electronic signals over copper wire. One significant application of the system is to transmit pixel information to liquid crystal display (LCD) screens in notebook computers. All displays have a refresh rate — the rate at which they receive fresh data from a graphics controller and redraw the image on the screen. Typically, the screen receives fresh data sixty times per second (a frequency of 60 Hz). When a screen and graphics controller are linked by LVDS, the LVDS system uses power on every refresh cycle. When idle, the refresh rate of many LCD screens can be dropped to 30 Hz without any noticeable effect (unlike cathode ray tube (CRT) monitors, where a decrease in refresh rate produces a characteristic flicker). The driver for Intel graphics adapters built into the kernel used in Red Hat Enterprise Linux 7 performs this downclocking automatically, and saves around 0.5 W when the screen is idle.

Enabling memory self-refresh

Synchronous dynamic random access memory (SDRAM) — as used for video memory in graphics adapters — is recharged thousands of times per second so that individual memory cells retain the data that is stored in them. Apart from its main function of managing data as it flows in and out of memory, the memory controller is normally responsible for initiating these refresh cycles. However, SDRAM also has a low-power self-refresh mode. In this mode, the memory uses an internal timer to generate its own refresh cycles, which allows the system to shut down the memory controller without endangering data currently held in memory. The kernel used in Red Hat Enterprise Linux 7 can trigger memory self-refresh in Intel graphics adapters when they are idle, which saves around 0.8 W.

GPU clock reduction

Typical graphical processing units (GPUs) contain internal clocks that govern various parts of their internal circuitry. The kernel used in Red Hat Enterprise Linux 7 can reduce the frequency of some of the internal clocks in Intel and ATI GPUs. Reducing the number of cycles that GPU components perform in a given time saves the power that they would have consumed in the cycles that they did not have to perform. The kernel automatically reduces the speed of these clocks when the GPU is idle, and increases it when GPU activity increases. Reducing GPU clock cycles can save up to 5 W.

GPU powerdown

The Intel and ATI graphics drivers in Red Hat Enterprise Linux 7 can detect when no monitor is attached to an adapter and therefore shut down the GPU completely. This feature is especially significant for servers which do not have monitors attached to them regularly.

3.12. RFKill

Many computer systems contain radio transmitters, including Wi-Fi, Bluetooth, and 3G devices. These devices consume power, which is wasted when the device is not in use.
RFKill is a subsystem in the Linux kernel that provides an interface through which radio transmitters in a computer system can be queried, activated, and deactivated. When transmitters are deactivated, they can be placed in a state where software can reactive them (a soft block) or where software cannot reactive them (a hard block).
The RFKill core provides the application programming interface (API) for the subsystem. Kernel drivers that have been designed to support RFkill use this API to register with the kernel, and include methods for enabling and disabling the device. Additionally, the RFKill core provides notifications that user applications can interpret and ways for user applications to query transmitter states.
The RFKill interface is located at /dev/rfkill, which contains the current state of all radio transmitters on the system. Each device has its current RFKill state registered in sysfs. Additionally, RFKill issues uevents for each change of state in an RFKill-enabled device.
Rfkill is a command-line tool with which you can query and change RFKill-enabled devices on the system. To obtain the tool, install the rfkill package.
Use the command rfkill list to obtain a list of devices, each of which has an index number associated with it, starting at 0. You can use this index number to tell rfkill to block or unblock a device, for example:
~]# rfkill block 0
blocks the first RFKill-enabled device on the system.
You can also use rfkill to block certain categories of devices, or all RFKill-enabled devices. For example:
~]# rfkill block wifi
blocks all Wi-Fi devices on the system. To block all RFKill-enabled devices, run:
~]# rfkill block all
To unblock devices, run rfkill unblock instead of rfkill block. To obtain a full list of device categories that rfkill can block, run rfkill help

Chapter 4. Use Cases

This chapter describes two types of use case to illustrate the analysis and configuration methods described elsewhere in this guide. The first example considers typical servers and the second is a typical laptop.

4.1. Example — Server

A typical standard server nowadays comes with the majority of the necessary hardware features supported in Red Hat Enterprise Linux 7. The first thing to take into consideration is the kinds of workloads for which the server will mainly be used. Based on this information you can decide which components can be optimized for power savings.
Regardless of the type of server, graphics performance is generally not required. Therefore, GPU power savings can be left turned on.
Webserver

A webserver needs network and disk I/O. Depending on the external connection speed 100 Mbit/s might be enough. If the machine serves mostly static pages, CPU performance might not be very important. Power-management choices might therefore include:

  • no disk or network plugins for tuned.
  • ALPM turned on.
  • ondemand governor turned on.
  • network card limited to 100 Mbit/s.
Compute server

A compute server mainly needs CPU. Power management choices might include:

  • depending on the jobs and where data storage happens, disk or network plugins for tuned; or for batch-mode systems, fully active tuned.
  • depending on utilization, perhaps the performance governor.
Mailserver

A mailserver needs mostly disk I/O and CPU. Power management choices might include:

  • ondemand governor turned on, because the last few percent of CPU performance are not important.
  • no disk or network plugins for tuned.
  • network speed should not be limited, because mail is often internal and can therefore benefit from a 1 Gbit/s or 10 Gbit/s link.
Fileserver

Fileserver requirements are similar to those of a mailserver, but depending on the protocol used, might require more CPU performance. Typically, Samba-based servers require more CPU than NFS, and NFS typically requires more than iSCSI. Even so, you should be able to use the ondemand governor.

Directory server

A directory server typically has lower requirements for disk I/O, especially if equipped with enough RAM. Network latency is important although network I/O less so. You might consider latency network tuning with a lower link speed, but you should test this carefully for your particular network.

4.2. Example — Laptop

One other very common place where power management and savings can really make a difference are laptops. As laptops by design normally already use drastically less energy than workstations or servers the potential for absolute savings are less than for other machines. When in battery mode, though, any saving can help to get a few more minutes of battery life out of a laptop. Although this section focuses on laptops in battery mode, but you certainly can still use some or all of those tunings while running on AC power as well.
Savings for single components usually make a bigger relative difference on laptops than they do on workstations. For example, a 1 Gbit/s network interface running at 100 Mbits/s saves around 3–4 watts. For a typical server with a total power consumption of around 400 watts, this saving is approximately 1 %. On a laptop with a total power consumption of around 40 watts, the power saving on just this one component amounts to 10 % of the total.
Specific power-saving optimizations on a typical laptop include:
  • Configure the system BIOS to disable all hardware that you do not use. For example, parallel or serial ports, card readers, webcams, WiFi, and Bluetooth just to name a few possible candidates.
  • Dim the display in darker environments where you do not need full illumination to read the screen comfortably. Use System+PreferencesPower Management on the GNOME desktop, Kickoff Application Launcher+Computer+System Settings+AdvancedPower Management on the KDE desktop; or gnome-power-manager or xbacklight at the command line; or the function keys on your laptop.
Additionally, (or alternatively) you can perform many small adjustments to various system settings:
  • use the ondemand governor (enabled by default in Red Hat Enterprise Linux 7)
  • enable AC97 audio power-saving (enabled by default in Red Hat Enterprise Linux 7):
    ~]# echo Y > /sys/module/snd_ac97_codec/parameters/power_save
  • enable USB auto-suspend:
    ~]# for i in /sys/bus/usb/devices/*/power/autosuspend; do echo 1 > $i; done
    Note that USB auto-suspend does not work correctly with all USB devices.
  • mount file system using relatime (default in Red Hat Enterprise Linux 7):
    ~]# mount -o remount,relatime mountpoint
  • reduce screen brightness to 50 or less, for example:
    ~]$ xbacklight -set 50
  • activate DPMS for screen idle:
    ~]$ xset +dpms; xset dpms 0 0 300
  • deactivate Wi-Fi:
    ~]# echo 1 > /sys/bus/pci/devices/*/rf_kill

Appendix A. Tips for Developers

Every good programming textbook covers problems with memory allocation and the performance of specific functions. As you develop your software, be aware of issues that might increase power consumption on the systems on which the software runs. Although these considerations do not affect every line of code, you can optimize your code in areas which are frequent bottlenecks for performance.
Some techniques that are often problematic include:
  • using threads.
  • unnecessary CPU wake-ups and not using wake-ups efficiently. If you must wake up, do everything at once (race to idle) and as quickly as possible.
  • using [f]sync() unnecessarily.
  • unnecessary active polling or using short, regular timeouts. (React to events instead).
  • not using wake-ups efficiently.
  • inefficient disk access. Use large buffers to avoid frequent disk access. Write one large block at a time.
  • inefficient use of timers. Group timers across applications (or even across systems) if possible.
  • excessive I/O, power consumption, or memory usage (including memory leaks)
  • performing unnecessary computation.
The following sections examine some of these areas in greater detail.

A.1. Using Threads

It is widely believed that using threads makes applications perform better and faster, but this is not true in every case.
Python

Python uses the Global Lock Interpreter[1], so threading is profitable only for larger I/O operations. Unladen-swallow [2] is a faster implementation of Python with which you might be able to optimize your code.

Perl

Perl threads were originally created for applications running on systems without forking (such as systems with 32-bit Windows operating systems). In Perl threads, the data is copied for every single thread (Copy On Write). Data is not shared by default, because users should be able to define the level of data sharing. For data sharing the threads::shared module has to be included. However, data is not only then copied (Copy On Write), but the module also creates tied variables for the data, which takes even more time and is even slower. [3]

C

C threads share the same memory, each thread has its own stack, and the kernel does not have to create new file descriptors and allocate new memory space. C can really use the support of more CPUs for more threads. Therefore, to maximize the performance of your threads, use a low-level language like C or C++. If you use a scripting language, consider writing a C binding. Use profilers to identify poorly performing parts of your code. [4]

A.2. Wake-ups

Many applications scan configuration files for changes. In many cases, the scan is performed at a fixed interval, for example, every minute. This can be a problem, because it forces a disk to wake up from spindowns. The best solution is to find a good interval, a good checking mechanism, or to check for changes with inotify and react to events. Inotify can check variety of changes on a file or a directory.
For example:
#include <stdio.h>
#include <stdlib.h>
#include <sys/time.h>
#include <sys/types.h>
#include <sys/inotify.h>
#include <unistd.h>

int main(int argc, char *argv[]) {
  int fd;
  int wd;
  int retval;
  struct timeval tv;

  fd = inotify_init();

  /* checking modification of a file - writing into */
  wd = inotify_add_watch(fd, "./myConfig", IN_MODIFY);
  if (wd < 0) {
    printf("inotify cannot be used\n");
    /* switch back to previous checking */
  }

  fd_set rfds;
  FD_ZERO(&rfds);
  FD_SET(fd, &rfds);
  tv.tv_sec = 5;
  tv.tv_usec = 0;
  retval = select(fd + 1, &rfds, NULL, NULL, &tv);
  if (retval == -1)
    perror("select()");
  else if (retval) {
    printf("file was modified\n");
  }
  else
    printf("timeout\n");

  return EXIT_SUCCESS;
}
The advantage of this approach is the variety of checks that you can perform.
The main limitation is that only a limited number of watches are available on a system. The number can be obtained from /proc/sys/fs/inotify/max_user_watches and although it can be changed, this is not recommended. Furthermore, in case inotify fails, the code has to fall back to a different check method, which usually means many occurrences of #if #define in the source code.
For more information on inotify, see the inotify(7) man page.

A.3. Fsync

Fsync is known as an I/O expensive operation, but this is is not completely true.
Firefox used to call the sqlite library each time the user clicked on a link to go to a new page. Sqlite called fsync and because of the file system settings (mainly ext3 with data-ordered mode), there was a long latency when nothing happened. This could take a long time (up to 30 seconds) if another process was copying a large file at the same time.
However, in other cases, where fsync was not used at all, problems emerged with the switch to the ext4 file system. Ext3 was set to data-ordered mode, which flushed memory every few seconds and saved it to a disk. But with ext4 and laptop_mode, the interval between saves was longer and data might get lost when the system was unexpectedly switched off. Now ext4 is patched, but we must still consider the design of our applications carefully, and use fsync as appropriate.
The following simple example of reading and writing into a configuration file shows how a backup of a file can be made or how data can be lost:
/* open and read configuration file e.g. ./myconfig */
fd = open("./myconfig", O_RDONLY);
read(fd, myconfig_buf, sizeof(myconfig_buf));
close(fd);
...
fd = open("./myconfig", O_WRONLY | O_TRUNC | O_CREAT, S_IRUSR | S_IWUSR);
write(fd, myconfig_buf, sizeof(myconfig_buf));
close(fd);
A better approach would be:
/* open and read configuration file e.g. ./myconfig */
fd = open("./myconfig", O_RDONLY);
read(fd, myconfig_buf, sizeof(myconfig_buf));
close(fd);
...
fd = open("./myconfig.suffix", O_WRONLY | O_TRUNC | O_CREAT, S_IRUSR | S_IWUSR
write(fd, myconfig_buf, sizeof(myconfig_buf));
fsync(fd); /* paranoia - optional */
...
close(fd);
rename("./myconfig", "./myconfig~"); /* paranoia - optional */
rename("./myconfig.suffix", "./myconfig");

Appendix B. Revision History

Revision History
Revision 2.2-9Mon Aug 05 2019Marie Doleželová
Document version for 7.7 GA publication.
Revision 2.2-6Mon Jul 24 2017Marie Doleželová
Document version for 7.4 GA publication.
Revision 2.2-5Tue Mar 21 2017Milan Navrátil
Asynchronous update: the Tuned chapter rewrite
Revision 2.0-2Fri Oct 14 2016Marie Doleželová
Version for 7.3 GA publication.
Revision 2.0-1Wed 11 Nov 2015Jana Heves
Version for 7.2 GA release.
Revision 1-3Fri 19 Jun 2015Jacquelynn East
Fixed incorrect package name in Core Infrastructure and Mechanics.
Revision 1-2Wed 18 Feb 2015Jacquelynn East
Version for 7.1 GA
Revision 1-1Thu Dec 4 2014Jacquelynn East
Version for 7.1 Beta
Revision 1.0-9Tue Jun 9 2014Yoana Ruseva
Version for 7.0 GA release
Revision 0.9-1Fri May 9 2014Yoana Ruseva
Rebuild for style changes.
Revision 0.9-0Wed May 7 2014Yoana Ruseva
Red Hat Enterprise Linux 7.0 release of the book for review purposes.
Revision 0.1-1Thu Jan 17 2013Jack Reed
Branched from the Red Hat Enterprise Linux 6 version of the document

Legal Notice

Copyright © 2017 Red Hat, Inc.
This document is licensed by Red Hat under the Creative Commons Attribution-ShareAlike 3.0 Unported License. If you distribute this document, or a modified version of it, you must provide attribution to Red Hat, Inc. and provide a link to the original. If the document is modified, all Red Hat trademarks must be removed.
Red Hat, as the licensor of this document, waives the right to enforce, and agrees not to assert, Section 4d of CC-BY-SA to the fullest extent permitted by applicable law.
Red Hat, Red Hat Enterprise Linux, the Shadowman logo, the Red Hat logo, JBoss, OpenShift, Fedora, the Infinity logo, and RHCE are trademarks of Red Hat, Inc., registered in the United States and other countries.
Linux® is the registered trademark of Linus Torvalds in the United States and other countries.
Java® is a registered trademark of Oracle and/or its affiliates.
XFS® is a trademark of Silicon Graphics International Corp. or its subsidiaries in the United States and/or other countries.
MySQL® is a registered trademark of MySQL AB in the United States, the European Union and other countries.
Node.js® is an official trademark of Joyent. Red Hat is not formally related to or endorsed by the official Joyent Node.js open source or commercial project.
The OpenStack® Word Mark and OpenStack logo are either registered trademarks/service marks or trademarks/service marks of the OpenStack Foundation, in the United States and other countries and are used with the OpenStack Foundation's permission. We are not affiliated with, endorsed or sponsored by the OpenStack Foundation, or the OpenStack community.
All other trademarks are the property of their respective owners.