
Red Hat Training
A Red Hat training course is available for Red Hat Enterprise Linux
Power Management Guide
Managing power consumption on Red Hat Enterprise Linux 6
Abstract
Chapter 1. Overview
1.1. Importance of Power Management
- reducing overall power consumption to save cost
- heat reduction for servers and computing centers
- reduced secondary costs, including cooling, space, cables, generators, and uninterruptible power supplies (UPS)
- extended battery life for laptops
- lower carbon dioxide output
- meeting government regulations or legal requirements regarding Green IT, for example Energy Star
- meeting company guidelines for new systems
- Q: Must I optimize?
- Q: How much do I need to optimize?
- Q: Will optimization reduce system performance to an unacceptable level?
- Q: Will the time and resources spent to optimize the system outweigh the gains achieved?
1.2. Power Management Basics
The Red Hat Enterprise Linux 5 kernel used a periodic timer for each CPU. This timer prevents the CPU from truly going idle, as it requires the CPU to process each timer event (which would happen every few milliseconds, depending on the setting), regardless of whether any process was running or not. A large part of effective power management involves reducing the frequency at which CPU wakeups are made.
This is especially true for devices that have moving parts (for example, hard disks). In addition to this, some applications may leave an unused but enabled device "open"; when this occurs, the kernel assumes that the device is in use, which can prevent the device from going into a power saving state.
In many cases, however, this depends on modern hardware and correct BIOS configuration. Older system components often do not have support for some of the new features that we now can support in Red Hat Enterprise Linux 6. Make sure that you are using the latest official firmware for your systems and that in the power management or device configuration sections of the BIOS the power management features are enabled. Some features to look for include:
- SpeedStep
- PowerNow!
- Cool'n'Quiet
- ACPI (C state)
- Smart
Modern CPUs together with Advanced Configuration and Power Interface (ACPI) provide different power states. The three different states are:
- Sleep (C-states)
- Frequency (P-states)
- Heat output (T-states or "thermal states")
As obvious as this might sound, one of the best ways to actually save power is to turn off systems. For example, your company can develop a corporate culture focused on "green IT" awareness with a guideline to turn of machines during lunch break or when going home. You also might consolidate several physical servers into one bigger server and virtualize them using the virtualization technology we ship with Red Hat Enterprise Linux 6.
Chapter 2. Power management auditing and analysis
2.1. Audit and analysis overview
2.2. PowerTOP
root, the following command:
yum install powertoproot:
powertoproot, the following command:
powertop --calibratepowertop --calibrate on a laptop, it should still be running on battery power so that all available data is presented.
- power estimation
- how the resource is being used
- wakeups per second
- the classification of the component, such as process, device, or timer
- description of the component
chkconfig servicename.service offroot, the following commands:
ps -awux | grep processnamestrace -p processid
C4 being higher than C3). This is a good indication of how well the CPU usage has been optimized. Residency should ideally be 90% or more in the highest C- or P-state while the system is idle.
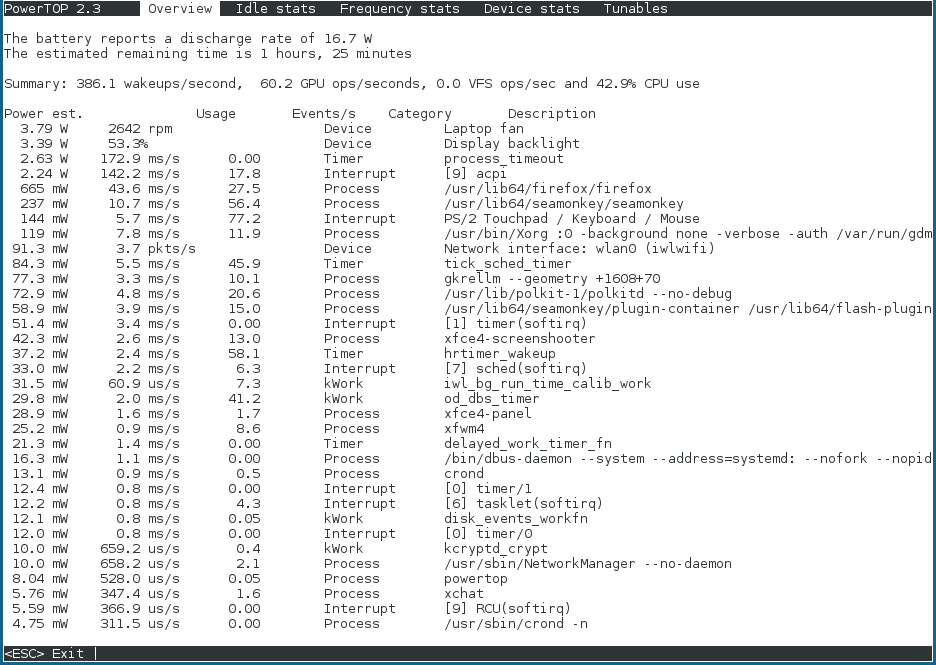
Figure 2.1. PowerTOP in Operation
--html option. Replace the htmlfile.html parameter with the desired name for the output file:
powertop --html=htmlfile.html--time option:
powertop --html=htmlfile.html --time=secondsturbostat man page, or the relevant section in Performance Tuning Guide.
2.3. diskdevstat and netdevstat
root:
yum install systemtap tuned-utils kernel-debuginfodiskdevstatnetdevstatdiskdevstat update_interval total_duration display_histogramnetdevstat update_interval total_duration display_histogram
- update_interval
- The time in seconds between updates of the display. Default:
5 - total_duration
- The time in seconds for the whole run. Default:
86400(1 day) - display_histogram
- Flag whether to histogram for all the collected data at the end of the run.
diskdevstat command resembles that of PowerTOP. See the example.
Example 2.1. An Output of the diskdevstat Command
PID  UID  DEV WRITE_CNT WRITE_MIN WRITE_MAX WRITE_AVG READ_CNT READ_MIN READ_MAX READ_AVG COMMAND
2789  2903 sda1     854     0.000   120.000    39.836      0     0.000     0.000     0.000 plasma
5494     0 sda1       0     0.000     0.000     0.000    758     0.000     0.012     0.000 0logwatch
5520     0 sda1       0     0.000     0.000     0.000    140     0.000     0.009     0.000 perl
5549     0 sda1       0     0.000     0.000     0.000    140     0.000     0.009     0.000 perl
5585     0 sda1       0     0.000     0.000     0.000    108     0.001     0.002     0.000 perl
2573     0 sda1      63     0.033  3600.015   515.226      0     0.000     0.000     0.000 auditd
5429     0 sda1       0     0.000     0.000     0.000     62     0.009     0.009     0.000 crond
5379     0 sda1       0     0.000     0.000     0.000     62     0.008     0.008     0.000 crond
5473     0 sda1       0     0.000     0.000     0.000     62     0.008     0.008     0.000 crond
5415     0 sda1       0     0.000     0.000     0.000     62     0.008     0.008     0.000 crond
5433     0 sda1       0     0.000     0.000     0.000     62     0.008     0.008     0.000 crond
5425     0 sda1       0     0.000     0.000     0.000     62     0.007     0.007     0.000 crond
5375     0 sda1       0     0.000     0.000     0.000     62     0.008     0.008     0.000 crond
5477     0 sda1       0     0.000     0.000     0.000     62     0.007     0.007     0.000 crond
5469     0 sda1       0     0.000     0.000     0.000     62     0.007     0.007     0.000 crond
5419     0 sda1       0     0.000     0.000     0.000     62     0.008     0.008     0.000 crond
5481     0 sda1       0     0.000     0.000     0.000     61     0.000     0.001     0.000 crond
5355     0 sda1       0     0.000     0.000     0.000     37     0.000     0.014     0.001 laptop_mode
2153     0 sda1      26     0.003  3600.029  1290.730      0     0.000     0.000     0.000 rsyslogd
5575     0 sda1       0     0.000     0.000     0.000     16     0.000     0.000     0.000 cat
5581     0 sda1       0     0.000     0.000     0.000     12     0.001     0.002     0.000 perl
[output truncated]
 PID  UID  DEV WRITE_CNT WRITE_MIN WRITE_MAX WRITE_AVG READ_CNT READ_MIN READ_MAX READ_AVG COMMAND
2789  2903 sda1     854     0.000   120.000    39.836      0     0.000     0.000     0.000 plasma
2573     0 sda1      63     0.033  3600.015   515.226      0     0.000     0.000     0.000 auditd
2153     0 sda1      26     0.003  3600.029  1290.730      0     0.000     0.000     0.000 rsyslogd
WRITE_CNT greater than 0, which means that they performed some form of write during the measurement. Of those, plasma was the worst offender by a large degree: it performed the most write operations, and the average time between writes was the lowest. Plasma would therefore be the best candidate to investigate if you were concerned about power-inefficient applications.
strace -p 2789strace contains a repeating pattern every 45 seconds that opened the KDE icon cache file of the user for writing followed by an immediate close of the file again. This led to a necessary physical write to the hard disk as the file metadata (specifically, the modification time) had changed. The final fix was to prevent those unnecessary calls when no updates to the icons had occurred.
diskdevstat command stand for, see this table:
Table 2.1. Reading the diskdevstat Output
| PID | the process ID of the application |
| UID | the user ID under which the applications is running |
| DEV | the device on which the I/O took place |
| WRITE_CNT | the total number of write operations |
| WRITE_MIN | the lowest time taken for two consecutive writes (in seconds) |
| WRITE_MAX | the greatest time taken for two consecutive writes (in seconds) |
| WRITE_AVG | the average time taken for two consecutive writes (in seconds) |
| READ_CNT | the total number of read operations |
| READ_MIN | the lowest time taken for two consecutive reads (in seconds) |
| READ_MAX | the greatest time taken for two consecutive reads (in seconds) |
| READ_AVG | the average time taken for two consecutive reads (in seconds) |
| COMMAND | the name of the process |
2.4. Battery Life Tool Kit
-a option.
office workload writes a text, corrects things in it, and does the same for a spreadsheet. Running BLTK combined with PowerTOP or any of the other auditing or analysis tool allows you to test if the optimizations you performed have an effect when the machine is actively in use instead of only idling. Because you can run the exact same workload multiple times for different settings, you can compare results for different settings.
yum install bltkbltk command is run with various workloads to simulate different types of laptop usage, and one of the options. See the format of the command:
bltk workload options-I,--idle- system is idle, to use as a baseline for comparison with other workloads
-R,--reader- simulates reading documents (by default, with Firefox)
-P,--player- simulates watching multimedia files from a CD or DVD drive (by default, with mplayer)
-O,--office- simulates editing documents with the OpenOffice.org suite
-a,--ac-ignore- ignore whether AC power is available (necessary for desktop use)
-T number_of_seconds,--time number_of_seconds- the time (in seconds) over which to run the test; use this option with the
idleworkload -F filename,--file filename- specifies a file to be used by a particular workload, for example, a file for the
playerworkload to play instead of accessing the CD or DVD drive -W application,--prog application- specifies an application to be used by a particular workload, for example, a browser other than Firefox for the
readerworkload
Example 2.2. Measuring Battery Life and Performance under Idle Workload
bltk -I -T 120bltk(1) man page.
/etc/bltk.conf configuration file — by default, ~/.bltk/workload.results.number/. For example, the ~/.bltk/reader.results.002/ directory holds the results of the third test with the reader workload (the first test is not numbered). The results are spread across several text files. To condense these results into a format that is easy to read, run:
bltk_report path_to_results_directoryReport in the results directory. To view the results in a terminal emulator instead, use the -o option:
bltk_report -o path_to_results_directory2.5. tuned and ktune
yum install tuned/etc/tuned.conf and activates the default profile.
service tuned startchkconfig tuned on-d,--daemon- start tuned as a daemon instead of in the foreground.
-c,--conffile- use a configuration file with the specified name and path, for example,
--conffile=/etc/tuned2.conf. The default is/etc/tuned.conf. -D,--debug- use the highest level of logging.
2.5.1. The tuned.conf file
tuned.conf file contains configuration settings for tuned. By default, it is located at /etc/tuned.conf, but you can specify a different name and location by starting tuned with the --conffile option.
[main] section that defines the general parameters for tuned. The file then contains a section for each plugin.
[main] section contains the following options:
interval- the interval at which tuned should monitor and tune the system, in seconds. The default value is
10. verbose- specifies whether output should be verbose. The default value is
False. logging- specifies the minimum priority of messages to be logged. In descending order, allowable values are:
critical,error,warning,info, anddebug. The default value isinfo. logging_disable- specifies the maximum priority of messages to be logged; any messages with this priority or lower will not be logged. In descending order, allowable values are:
critical,error,warning,info, anddebug. The valuenotsetdisables this option.
[CPUTuning]. Each plugin can have its own options, but the following apply to all plugins:
enabled- specifies whether the plugin is enabled or not. The default value is
True. verbose- specifies whether output should be verbose. If not set for this plugin, the value is inherited from
[main]. logging- specifies the minimum priority of messages to be logged. If not set for this plugin, the value is inherited from
[main].
Example 2.3. A sample tuned.conf file
[main]
interval=10
pidfile=/var/run/tuned.pid
logging=info
logging_disable=notset

# Disk monitoring section

[DiskMonitor]
enabled=True
logging=debug

# Disk tuning section

[DiskTuning]
enabled=True
hdparm=False
alpm=False
logging=debug

# Net monitoring section

[NetMonitor]
enabled=True
logging=debug

# Net tuning section

[NetTuning]
enabled=True
logging=debug

# CPU monitoring section

[CPUMonitor]
# Enabled or disable the plugin. Default is True. Any other value
# disables it.
enabled=True

# CPU tuning section

[CPUTuning]
# Enabled or disable the plugin. Default is True. Any other value
# disables it.
enabled=True
2.5.2. Tuned-adm
tuned-adm command, but you can also create, modify or delete profiles yourself.
tuned-adm listtuned-adm activetuned-adm profile profile_nameExample 2.4. Switching to the server-powersave profile
tuned-adm profile server-powersavetuned-adm offdefault profile will be active. Red Hat Enterprise Linux 6 also includes the following predefined profiles:
- default
- The default power-saving profile. It has the lowest impact on power saving of the available profiles and only enables CPU and disk plugins of tuned.
- desktop-powersave
- A power-saving profile directed at desktop systems. Enables ALPM power saving for SATA host adapters (refer to Section 3.8, “Aggressive Link Power Management”) as well as the CPU, Ethernet, and disk plugins of tuned.
- server-powersave
- A power-saving profile directed at server systems. Enables ALPM powersaving for SATA host adapters, disables CD-ROM polling through HAL (refer to the hal-disable-polling man page) and activates the CPU and disk plugins of tuned.
- laptop-ac-powersave
- A medium-impact power-saving profile directed at laptops running on AC. Enables ALPM powersaving for SATA host adapters, WiFi power saving, as well as the CPU, Ethernet and disk plugins of tuned.
- laptop-battery-powersave
- A high-impact power-saving profile directed at laptops running on battery. It activates all power saving mechanisms from the previous profiles plus it enables the multi-core power-savings scheduler for low wakeup systems and makes sure that the
ondemandgovernor is active and that AC97 audio power-saving is enabled. You can use this profile to save the maximum amount of power on any kind of system, not only laptops on battery power. The tradeoff for this profile is a noticeable impact on performance, specifically latency of disk and network I/O. - spindown-disk
- A strong power-saving profile directed at machines with classic hard disks. It enables aggressive disk spin-down by increasing disk writeback values, lowering disk swappiness, and disabling log syncing. All partitions are remounted with a
noatimeoption. All tuned plugins are disabled. - throughput-performance
- A server profile for typical throughput performance tuning. It disables tuned and ktune power saving mechanisms, enables sysctl settings that improve the throughput performance of your disk and network I/O, and switches to the deadline scheduler. CPU governor is set to
performance. - latency-performance
- A server profile for typical latency performance tuning. This profile disables dynamic tuning mechanisms and transparent hugepages. It uses the
performancegoverner for p-states throughcpuspeed, and sets the I/O scheduler todeadline. Additionally, in Red Hat Enterprise Linux 6.5 and later, the profile requests acpu_dma_latencyvalue of1. In Red Hat Enterprise Linux 6.4 and earlier,cpu_dma_latencyrequested a value of0. - enterprise-storage
- A server profile to improve throughput performance for enterprise-sized server configurations. This switches to the deadline scheduler and disables certain I/O barriers, dramatically improving throughput.
- virtual-guest
- This profile is optimized for virtual machines. It is based on the
enterprise-storageprofile, but also decreases the swappiness of virtual memory. This profile is available in Red Hat Enterprise Linux 6.3 and later. - virtual-host
- Based on the
enterprise-storageprofile, this profile decreases the swappiness of virtual memory and enables more aggressive writeback of dirty pages. Non-root and non-boot file systems are mounted withbarrier=0. Additionally, as of Red Hat Enterprise Linux 6.5, the kernel.sched_migration_cost parameter is set to 5 milliseconds. Prior to Red Hat Enterprise Linux 6.5, kernel.sched_migration_cost used the default value of 0.5 milliseconds - oracle
- A profile optimized for Oracle databases loads based on
throughput-performanceprofile. It additionaly disables transparent huge pages and modifies some other performance related kernel parameters. This profile is provided by tuned-profiles-oracle package. It is available in Red Hat Enterprise Linux 6.8 and later.
Note
/etc/tune-profiles. Thus /etc/tune-profiles/desktop-powersave contains all the necessary files and settings for the desktop-powersave profile. Each of these directories contains up to four files:
tuned.conf- the configuration for the tuned service to be active for this profile.
sysctl.ktune- the sysctl settings used by ktune. The format is identical to the
/etc/sysconfig/sysctlfile (refer to the sysctl and sysctl.conf man pages). ktune.sysconfig- the configuration file of ktune itself, typically
/etc/sysconfig/ktune. ktune.sh- an init-style shell script used by the ktune service which can run specific commands during system startup to tune the system.
Example 2.5. Creating a New Profile
laptop-battery-powersave profile contains a very rich set of tunings already and is therefore a useful starting point.
- Copy the whole directory to the new profile name:
cp -a /etc/tune-profiles/laptop-battery-powersave/ /etc/tune-profiles/myprofile - Modify any of the files in the new profile to match your personal requirements. If you require the detection of CD changes, you could disable that optimization by commenting out the appropriate line in the ktune.sh script:
# Disable HAL polling of CDROMS
# for i in /dev/scd*; do hal-disable-polling --device $i; done > /dev/null 2>&1
2.6. DeviceKit-power and devkit-power
devkit-power command and the following options:
--enumerate,-e- displays an object path for each power devices on the system.
Example 2.6. Sample Output of Object Paths
devkit-power -e$ /org/freedesktop/DeviceKit/power/devices/line_power_AC$ /org/freedesktop/UPower/DeviceKit/power/battery_BAT0 --dump,-d- displays the parameters for all power devices on the system.
--wakeups,-w- displays the CPU wakeups on the system.
--monitor,-m- monitors the system for changes to power devices, for example, the connection or disconnection of a source of AC power, or the depletion of a battery. Press Ctrl+C to stop monitoring the system.
--monitor-detail- monitors the system for changes to power devices, for example, the connection or disconnection of a source of AC power, or the depletion of a battery. The
--monitor-detailoption presents more detail than the--monitoroption. Press Ctrl+C to stop monitoring the system. --show-info object_path,-i object_path- displays all information available for a particular object path.
Example 2.7. Using the -i option
To obtain information about a battery on your system represented by the object path/org/freedesktop/UPower/DeviceKit/power/battery_BAT0, run:devkit-power -i /org/freedesktop/UPower/DeviceKit/power/battery_BAT0
2.7. GNOME Power Manager
- On AC Power
- General
- On Battery Power
2.8. Other means for auditing
- vmstat
- vmstat gives you detailed information about processes, memory, paging, block I/O, traps, and CPU activity. Use it to take a closer look at what the system overall does and where it is busy.
- iostat
- iostat is similar to vmstat, but only for I/O on block devices. It also provides more verbose output and statistics.
- blktrace
- blktrace is a very detailed block I/O trace program. It breaks down information to single blocks associated with applications. It is very useful in combination with diskdevstat.
Chapter 3. Core Infrastructure and Mechanics
Important
cpupower command featured in this chapter, ensure you have the cpupowerutils package installed.
3.1. CPU Idle States
- C0
- the operating or running state. In this state, the CPU is working and not idle at all.
- C1, Halt
- a state where the processor is not executing any instructions but is typically not in a lower power state. The CPU can continue processing with practically no delay. All processors offering C-States need to support this state. Pentium 4 processors support an enhanced C1 state called C1E that actually is a state for lower power consumption.
- C2, Stop-Clock
- a state where the clock is frozen for this processor but it keeps the complete state for its registers and caches, so after starting the clock again it can immediately start processing again. This is an optional state.
- C3, Sleep
- a state where the processor really goes to sleep and does not need to keep its cache up to date. Waking up from this state takes considerably longer than from C2 due to this. Again this is an optional state.
cpupower idle-info3.2. Using CPUfreq Governors
CPUfreq. CPUfreq — also referred to as CPU speed scaling — allows the clock speed of the processor to be adjusted on the fly. This enables the system to run at a reduced clock speed to save power. The rules for shifting frequencies, whether to a faster or slower clock speed, and when to shift frequencies, are defined by the CPUfreq governor.
CPUfreq governor, the characteristics of each governor, and what kind of workload each governor is suitable for.
3.2.1. CPUfreq Governor Types
CPUfreq governors available in Red Hat Enterprise Linux 6.
The Performance governor forces the CPU to use the highest possible clock frequency. This frequency will be statically set, and will not change. As such, this particular governor offers no power saving benefit. It is only suitable for hours of heavy workload, and even then only during times wherein the CPU is rarely (or never) idle.
By contrast, the Powersave governor forces the CPU to use the lowest possible clock frequency. This frequency will be statically set, and will not change. As such, this particular governor offers maximum power savings, but at the cost of the lowest CPU performance.
The Ondemand governor is a dynamic governor that allows the CPU to achieve maximum clock frequency when system load is high, and also minimum clock frequency when the system is idle. While this allows the system to adjust power consumption accordingly with respect to system load, it does so at the expense of latency between frequency switching. As such, latency can offset any performance versus power saving benefits offered by the Ondemand governor if the system switches between idle and heavy workloads too often.
The Userspace governor allows userspace programs (or any process running as root) to set the frequency. This governor is normally used along with the cpuspeed daemon. Of all the governors, Userspace is the most customizable; and depending on how it is configured, it can offer the best balance between performance and consumption for your system.
Like the Ondemand governor, the Conservative governor also adjusts the clock frequency according to usage (like the Ondemand governor). However, while the Ondemand governor does so in a more aggressive manner (that is from maximum to minimum and back), the Conservative governor switches between frequencies more gradually.
Note
cron jobs. This allows you to automatically set specific governors during specific times of the day. As such, you can specify a low-frequency governor during idle times (for example after work hours) and return to a higher-frequency governor during hours of heavy workload.
3.2.2. CPUfreq Setup
CPUfreq governor, you need to add the appropriate CPUfreq driver first.
Procedure 3.1. How to Add a CPUfreq Driver
- Use the following command to view which
CPUfreqdrivers are available for your system:ls /lib/modules/[kernel version]/kernel/arch/[architecture]/kernel/cpu/cpufreq/ - Use
modprobeto add the appropriateCPUfreqdriver.modprobe [CPUfreq driver]When using the above command, be sure to remove the.kofilename suffix.Important
When choosing an appropriate CPUfreq driver, always chooseacpi-cpufreqoverp4-clockmod. While using thep4-clockmoddriver reduces the clock frequency of a CPU, it does not reduce the voltage.acpi-cpufreq, on the other hand, reduces voltage along with CPU clock frequency, allowing less power consumption and heat output for each unit reduction in performance.
cpupower frequency-info --governorsmodprobe to add the necessary kernel modules that enable the specific CPUfreq governor you wish to use. These kernel modules are available in /lib/modules/[kernel version]/kernel/drivers/cpufreq/.
Procedure 3.2. Enabling a CPUfreq Governor
- If a specific governor is not listed as available for your CPU, use
modprobeto enable the governor you wish to use:modprobe [governor]Example 3.1. Enabling a Governor
If theondemandgovernor is not available for your CPU, use the following command:modprobe cpufreq_ondemand - Once a governor is listed as available for your CPU, you can enable it using:
cpupower frequency-set --governor [governor]
3.2.3. Tuning CPUfreq Policy and Speed
cpupower frequency-info command and further tune the speed of each CPU with options for cpupower frequency-set.
cpupower frequency-info, the following options are available:
--freq— Shows the current speed of the CPU according to the CPUfreq core, in KHz.--hwfreq— Shows the current speed of the CPU according to the hardware, in KHz (only available as root).--driver— Shows what CPUfreq driver is used to set the frequency on this CPU.--governors— Shows the CPUfreq governors available in this kernel. If you wish to use a CPUfreq governor that is not listed in this file, refer to Procedure 3.2, “Enabling a CPUfreq Governor” in Section 3.2.2, “CPUfreq Setup” for instructions on how to do so.--affected-cpus— Lists CPUs that require frequency coordination software.--policy— Shows the range of the current CPUfreq policy, in KHz, and the currently active governor.--hwlimits— Lists available frequencies for the CPU, in KHz.
cpupower frequency-set, the following options are available:
Note
/sys/devices/system/cpu/[cpuid]/cpufreq/. Settings and values can be changed by writing to these tunables. For example, to set the minimum clock speed of cpu0 to 360 KHz, use:
echo 360000 > /sys/devices/system/cpu/cpu0/cpufreq/scaling_min_freq3.3. CPU Monitors
cpupower monitor command:
-l— list all monitors available on your system.-m <monitor1>, <monitor2>— display specific monitors. Their identifiers can be found by running-l.command— display the idle statistics and CPU demands of a specific command.
3.4. CPU Power Saving Policies
cpupower set command:
- --perf-bias <0-15>
- Allows software on supported Intel processors to more actively contribute to determining the balance between optimum performance and saving power. This does not override other power saving policies. Assigned values range from 0 to 15, where 0 is optimum performance and 15 is optimum power efficiency.By default, this option applies to all cores. To apply it only to individual cores, add the
--cpu <cpulist>option. - --sched-mc <0|1|2>
- Restricts the use of power by system processes to the cores in one CPU package before other CPU packages are drawn from. 0 sets no restrictions, 1 initially employs only a single CPU package, and 2 does this in addition to favouring semi-idle CPU packages for handling task wakeups.
- --sched-smt <0|1|2>
- Restricts the use of power by system processes to the thread siblings of one CPU core before drawing on other cores. 0 sets no restrictions, 1 initially employs only a single CPU package, and 2 does this in addition to favouring semi-idle CPU packages for handling task wakeups.
3.5. Suspend and Resume
3.6. Tickless Kernel
3.7. Active-State Power Management
- default
- sets PCIe link power states according to the defaults specified by the firmware on the system (for example, BIOS). This is the default state for ASPM.
- powersave
- sets ASPM to save power wherever possible, regardless of the cost to performance.
- performance
- disables ASPM to allow PCIe links to operate with maximum performance.
pcie_aspm kernel parameter, where pcie_aspm=off disables ASPM and pcie_aspm=force enables ASPM, even on devices that do not support ASPM.
/sys/module/pcie_aspm/parameters/policy, but can be also specified at boot time with the pcie_aspm.policy kernel parameter, where, for example, pcie_aspm.policy=performance will set the ASPM performance policy.
Warning
pcie_aspm=force is set, hardware that does not support ASPM can cause the system to stop responding. Before setting pcie_aspm=force, ensure that all PCIe hardware on the system supports ASPM.
3.8. Aggressive Link Power Management
- min_power
- This mode sets the link to its lowest power state (SLUMBER) when there is no I/O on the disk. This mode is useful for times when an extended period of idle time is expected.
- medium_power
- This mode sets the link to the second lowest power state (PARTIAL) when there is no I/O on the disk. This mode is designed to allow transitions in link power states (for example during times of intermittent heavy I/O and idle I/O) with as small impact on performance as possible.
medium_powermode allows the link to transition between PARTIAL and fully-powered (that is "ACTIVE") states, depending on the load. Note that it is not possible to transition a link directly from PARTIAL to SLUMBER and back; in this case, either power state cannot transition to the other without transitioning through the ACTIVE state first. - max_performance
- ALPM is disabled; the link does not enter any low-power state when there is no I/O on the disk.To check whether your SATA host adapters actually support ALPM you can check if the file
/sys/class/scsi_host/host*/link_power_management_policyexists. To change the settings simply write the values described in this section to these files or display the files to check for the current setting.
3.9. Relatime Drive Access Optimization
atime, and maintaining it requires a constant series of write operations to storage. These writes keep storage devices and their links busy and powered up. Since few applications make use of the atime data, this storage device activity wastes power. Significantly, the write to storage would occur even if the file was not read from storage, but from cache. For some time, the Linux kernel has supported a noatime option for mount and would not write atime data to file systems mounted with this option. However, simply turning off this feature is problematic because some applications rely on atime data and will fail if it is not available.
relatime. relatime maintains atime data, but not for each time that a file is accessed. With this option enabled, atime data is written to the disk only if the file has been modified since the atime data was last updated (mtime), or if the file was last accessed more than a certain amount of time ago (by default, one day).
relatime enabled. You can suppress it for any particular file system by mounting that file system with the norelatime option.
3.10. Power Capping
Dynamic Power Capping is a feature available on select ProLiant and BladeSystem servers that allows system administrators to cap the power consumption of a server or a group of servers. The cap is a definitive limit that the server will not exceed, regardless of its current workload. The cap has no effect until the server reaches its power consumption limit. At that point, a management processor adjusts CPU P-states and clock throttling to limit the power consumed.
/dev/hpilo/dXccbN. The kernel also includes an extension of the hwmon sysfs interface to support power capping features, and a hwmon driver for ACPI 4.0 power meters that use the sysfs interface. Together, these features allow the operating system and user-space tools to read the value configured for the power cap, together with the current power usage of the system.
Intel Node Manager imposes a power cap on systems, using processor P-states and T-states to limit CPU performance and therefore power consumption. By setting a power management policy, administrators can configure systems to consume less power during times when system loads are low, for example, at night or on weekends.
3.11. Enhanced Graphics Power Management
Low-voltage differential signaling (LVDS) is a system for carrying electronic signals over copper wire. One significant application of the system is to transmit pixel information to liquid crystal display (LCD) screens in notebook computers. All displays have a refresh rate — the rate at which they receive fresh data from a graphics controller and redraw the image on the screen. Typically, the screen receives fresh data sixty times per second (a frequency of 60 Hz). When a screen and graphics controller are linked by LVDS, the LVDS system uses power on every refresh cycle. When idle, the refresh rate of many LCD screens can be dropped to 30 Hz without any noticeable effect (unlike cathode ray tube (CRT) monitors, where a decrease in refresh rate produces a characteristic flicker). The driver for Intel graphics adapters built into the kernel used in Red Hat Enterprise Linux 6 performs this downclocking automatically, and saves around 0.5 W when the screen is idle.
Synchronous dynamic random access memory (SDRAM) — as used for video memory in graphics adapters — is recharged thousands of times per second so that individual memory cells retain the data that is stored in them. Apart from its main function of managing data as it flows in and out of memory, the memory controller is normally responsible for initiating these refresh cycles. However, SDRAM also has a low-power self-refresh mode. In this mode, the memory uses an internal timer to generate its own refresh cycles, which allows the system to shut down the memory controller without endangering data currently held in memory. The kernel used in Red Hat Enterprise Linux 6 can trigger memory self-refresh in Intel graphics adapters when they are idle, which saves around 0.8 W.
Typical graphical processing units (GPUs) contain internal clocks that govern various parts of their internal circuitry. The kernel used in Red Hat Enterprise Linux 6 can reduce the frequency of some of the internal clocks in Intel and ATI GPUs. Reducing the number of cycles that GPU components perform in a given time saves the power that they would have consumed in the cycles that they did not have to perform. The kernel automatically reduces the speed of these clocks when the GPU is idle, and increases it when GPU activity increases. Reducing GPU clock cycles can save up to 5 W.
The Intel and ATI graphics drivers in Red Hat Enterprise Linux 6 can detect when no monitor is attached to an adapter and therefore shut down the GPU completely. This feature is especially significant for servers which do not have monitors attached to them regularly.
3.12. RFKill
/dev/rfkill which contains the current state of all radio transmitters on the system. Each device has its current RFKill state registered in sysfs. Additionally, RFKill issues uevents for each change of state in an RFKill-enabled device.
rfkill list to obtain a list of devices, each of which has an index number associated with it, starting at 0. You can use this index number to tell rfkill to block or unblock a device.
Example 3.2. Blocking a RFKill-enabled Device
rfkill block 0rfkill block wifirfkill block allrfkill unblockrfkill help3.13. Optimizations in User Space
Red Hat Enterprise Linux 6 uses a tickless kernel (refer to Section 3.6, “Tickless Kernel”), which allows the CPUs to remain in deeper idle states longer. However, the timer tick is not the only source of excessive CPU wakeups, and function calls from applications can also prevent the CPU from entering or remaining in idle states. Unnecessary function calls were reduced in over 50 applications.
Input or output (I/O) to storage devices and network interfaces forces devices to consume power. In storage and network devices that feature reduced power states when idle (for example, ALPM or ASPM), this traffic can prevent the device from entering or remaining in an idle state, and can prevent hard drives from spinning down when not in use. Excessive and unnecessary demands on storage have been minimized in several applications. In particular, those demands that prevented hard drives from spinning down.
Services that start automatically whether required or not have great potential to waste system resources. Services instead should default to "off" or "on demand" wherever possible. For example, the BlueZ service that enables Bluetooth support previously ran automatically when the system started, whether Bluetooth hardware was present or not. The BlueZ initscript now checks that Bluetooth hardware is present on the system before starting the service.
Chapter 4. Use Cases
4.1. Example — Server
A webserver needs network and disk I/O. Depending on the external connection speed 100 Mbit/s might be enough. If the machine serves mostly static pages, CPU performance might not be very important. Power-management choices might therefore include:
- no disk or network plugins for tuned.
- ALPM turned on.
ondemandgovernor turned on.- network card limited to 100 Mbit/s.
A compute server mainly needs CPU. Power management choices might include:
- depending on the jobs and where data storage happens, disk or network plugins for tuned; or for batch-mode systems, fully active tuned.
- depending on utilization, perhaps the
performancegovernor.
A mailserver needs mostly disk I/O and CPU. Power management choices might include:
ondemandgovernor turned on, because the last few percent of CPU performance are not important.- no disk or network plugins for tuned.
- network speed should not be limited, because mail is often internal and can therefore benefit from a 1 Gbit/s or 10 Gbit/s link.
Fileserver requirements are similar to those of a mailserver, but depending on the protocol used, might require more CPU performance. Typically, Samba-based servers require more CPU than NFS, and NFS typically requires more than iSCSI. Even so, you should be able to use the ondemand governor.
A directory server typically has lower requirements for disk I/O, especially if equipped with enough RAM. Network latency is important although network I/O less so. You might consider latency network tuning with a lower link speed, but you should test this carefully for your particular network.
4.2. Example — Laptop
- Configure the system BIOS to disable all hardware that you do not use. For example, parallel or serial ports, card readers, webcams, WiFi, and Bluetooth just to name a few possible candidates.
- Dim the display in darker environments where you do not need full illumination to read the screen comfortably. Use + → on the GNOME desktop, +++ → on the KDE desktop; or gnome-power-manager or xbacklight at the command line; or the function keys on your laptop.
- Use the
laptop-battery-powersaveprofile of tuned-adm to enable a whole set of power-saving mechanisms. Note that performance and latency for the hard drive and network interface are impacted.
- use the
ondemandgovernor (enabled by default in Red Hat Enterprise Linux 6) - enable laptop mode (part of the
laptop-battery-powersaveprofile):echo 5 > /proc/sys/vm/laptop_mode - increase flush time to disk (part of the
laptop-battery-powersaveprofile):echo 1500 > /proc/sys/vm/dirty_writeback_centisecs - disable nmi watchdog (part of the
laptop-battery-powersaveprofile):echo 0 > /proc/sys/kernel/nmi_watchdog - enable AC97 audio power-saving (enabled by default in Red Hat Enterprise Linux 6):
echo Y > /sys/module/snd_ac97_codec/parameters/power_save - enable multi-core power-saving (part of the
laptop-battery-powersaveprofile):echo 1 > /sys/devices/system/cpu/sched_mc_power_savings - enable USB auto-suspend:
for i in /sys/bus/usb/devices/*/power/autosuspend; do echo 1 > $i; doneNote that USB auto-suspend does not work correctly with all USB devices. - enable minimum power setting for ALPM (part of the
laptop-battery-powersaveprofile):echo min_power > /sys/class/scsi_host/host*/link_power_management_policy - mount filesystem using relatime (default in Red Hat Enterprise Linux 6):
mount -o remount,relatime mountpoint - activate best power saving mode for hard drives (part of the
laptop-battery-powersaveprofile):hdparm -B 1 -S 200 /dev/sd* - disable CD-ROM polling (part of the
laptop-battery-powersaveprofile):hal-disable-polling --device /dev/scd* - reduce screen brightness to
50or less, for example:xbacklight -set 50 - activate DPMS for screen idle:
xset +dpms; xset dpms 0 0 300 - reduce Wi-Fi power levels (part of the
laptop-battery-powersaveprofile):for i in /sys/bus/pci/devices/*/power_level ; do echo 5 > $i ; done - deactivate Wi-Fi:
echo 1 > /sys/bus/pci/devices/*/rf_kill - limit wired network to 100 Mbit/s (part of the
laptop-battery-powersaveprofile):ethtool -s eth0 advertise 0x0F
Appendix A. Tips for Developers
- using threads.
- unnecessary CPU wake-ups and not using wake-ups efficiently. If you must wake up, do everything at once (race to idle) and as quickly as possible.
- using
[f]sync()unnecessarily. - unnecessary active polling or using short, regular timeouts. (React to events instead).
- inefficient disk access. Use large buffers to avoid frequent disk access. Write one large block at a time.
- inefficient use of timers. Group timers across applications (or even across systems) if possible.
- excessive I/O, power consumption, or memory usage (including memory leaks)
- performing unnecessary computation.
A.1. Using Threads
Python uses the Global Lock Interpreter, so threading is profitable only for larger I/O operations. Unladen-swallow is a faster implementation of Python with which you might be able to optimize your code.
Perl threads were originally created for applications running on systems without forking (such as systems with 32-bit Windows operating systems). In Perl threads, the data is copied for every single thread (Copy On Write). Data is not shared by default, because users should be able to define the level of data sharing. For data sharing the threads::shared module has to be included. However, data is not only then copied (Copy On Write), but the module also creates tied variables for the data, which takes even more time and is even slower. For more information, see Things you need to know before programming Perl ithreads.
C threads share the same memory, each thread has its own stack, and the kernel does not have to create new file descriptors and allocate new memory space. C can really use the support of more CPUs for more threads. Therefore, to maximize the performance of your threads, use a low-level language like C or C++. If you use a scripting language, consider writing a C binding. Use profilers to identify poorly performing parts of your code. See also Of Programmers And Hardware: Transcending The Gap.
A.2. Wake-ups
Example A.1. Using inotify
int fd;
fd = inotify_init();
int wd;
/* checking modification of a file - writing into */
wd = inotify_add_watch(fd, "./myConfig", IN_MODIFY);
if (wd < 0) {
  inotify_cant_be_used();
  switching_back_to_previous_checking();
}
...
fd_set rdfs;
struct timeval tv;
int retval;
FD_ZERO(&rdfs);
FD_SET(0, &rdfs);

tv.tv_sec = 5;
value = select(1, &rdfs, NULL, NULL, &tv);
if (value == -1)
  perror(select);
else {
  do_some_stuff();
}
.../proc/sys/fs/inotify/max_user_watches and although it can be changed, this is not recommended. Furthermore, in case inotify fails, the code has to fall back to a different check method, which usually means many occurrences of #if #define in the source code.
A.3. Fsync
Fsync is known as an I/O expensive operation, but this is is not completely true.
fsync and because of the file system settings (mainly ext3 with data-ordered mode), there was a long latency when nothing happened. This could take a long time (up to 30 seconds) if another process was copying a large file at the same time.
fsync wasn't used at all, problems emerged with the switch to the ext4 file system. Ext3 was set to data-ordered mode, which flushed memory every few seconds and saved it to a disk. But with ext4 and laptop_mode, the interval between saves was longer and data might get lost when the system was unexpectedly switched off. Now ext4 is patched, but we must still consider the design of our applications carefully, and use fsync as appropriate.
/* open and read configuration file e.g. ./myconfig */
fd = open("./myconfig", O_RDONLY);
read(fd, myconfig_buf, sizeof(myconfig_buf));
close(fd);
...
fd = open("./myconfig", O_WRONLY | O_TRUNC | O_CREAT, S_IRUSR | S_IWUSR);
write(fd, myconfig_buf, sizeof(myconfig_buf));
close(fd);/* open and read configuration file e.g. ./myconfig */
fd = open("./myconfig", O_RDONLY);
read(fd, myconfig_buf, sizeof(myconfig_buf));
close(fd);
...
fd = open("./myconfig.suffix", O_WRONLY | O_TRUNC | O_CREAT, S_IRUSR | S_IWUSR
write(fd, myconfig_buf, sizeof(myconfig_buf));
fsync(fd); /* paranoia - optional */
...
close(fd);
rename("./myconfig", "./myconfig~"); /* paranoia - optional */
rename("./myconfig.suffix", "./myconfig");Appendix B. Revision History
| Revision History | |||
|---|---|---|---|
| Revision 2.2-2 | Wed Mar 15 2017 | ||
| |||
| Revision 2.2-1 | Tue May 10 2016 | ||
| |||
| Revision 1.0-36 | Sat Feb 27 2016 | ||
| |||
| Revision 1.0-35 | Fri Oct 10 2014 | ||
| |||
| Revision 1.0-34 | Fri Aug 8 2014 | ||
| |||
| Revision 1.0-33 | Wed Sep 25 2013 | ||
| |||
| Revision 1.0-25 | Tue Feb 19 2013 | ||
| |||
| Revision 1.0-18 | Tue Oct 30 2012 | ||
| |||
| Revision 1.0-15 | Thu Oct 18 2012 | ||
| |||
| Revision 1.0-14 | Fri Feb 10 2012 | ||
| |||
| Revision 1.0-0 | Thu Oct 7 2010 | ||
| |||