
Red Hat Insights Blog
Latest Posts
-
How to configure Satellite 6.4 to execute Insights' remediation playbooks
Configuring Satellite 6.4 for Insights' remediation playbook execution
As explained in my previous post, in Satellite 6.4 Insights integration has gone deeper than ever. With this new release, now Insights remediation playbooks can be executed from within the Satellite Web interface.
In this post, we are going to cover how Satellite 6.4 has to be configured in order to do so.
Basically, we simply need to allow Foreman to execute commands remotely.
This plugin enables Foreman to run arbitrary commands on hosts using different providers. Initially only an SSH provider is supported but we plan to add more.
Communication goes through the smart proxy so Foreman does not have to have direct access to the target host and can scale to control many hosts. A command can be customized similarly to provisioning templates or partition tables. A number of templates are included for running basic commands, installing packages, etc.
This plugin is installed in Satellite 6.4 by default.
Satellite server configuration
Next you have to setup ssh keys. By default smart proxy loads the key from
/usr/share/foreman-proxy/.ssh/id_rsa_foreman_proxy. To customize it you can edit the configuration in/etc/foreman-proxy/settings.d/remote_execution_ssh.yml. Without customization you need to create new ssh key and distribute it to target hosts. The key must not use a passphrase.In this post, we are not going to customize it, and use the default location, but just be aware of the options you have.
[root@sat]# cat /etc/foreman-proxy/settings.d/remote_execution_ssh.yml
---
:enabled: https
:ssh_identity_key_file: /var/lib/foreman-proxy/ssh/id_rsa_foreman_proxy
:local_working_dir: /var/tmp
:remote_working_dir: /var/tmp
:kerberos_auth: false
# Whether to run remote execution jobs asynchronously
:async_ssh: false
Please note these are NOT root's ssh keys, but specific to foreman-proxy.
To generate a key, run the following commands on the host where Smart Proxy runs:
[root@sat ~]# mkdir ~foreman-proxy/.ssh
[root@sat ~]# chown foreman-proxy ~foreman-proxy/.ssh
[root@sat ~]# sudo -u foreman-proxy ssh-keygen -f ~foreman-proxy/.ssh/id_rsa_foreman_proxy -N ''
When using SELinux, make sure the directory and the files have correct labels of
ssh_home_t. If not, restore the context:[root@sat ~]# restorecon -RvF ~foreman-proxy/.sshDon’t forget to restart Foreman, Smart Proxy and Foreman tasks, so plugins are reloaded:
[root@sat ~]# service httpd restart
[root@sat ~]# service foreman-tasks restart
[root@sat ~]# service foreman-proxy restart
Finally, you have to refresh the Smart Proxy features in the Foreman.
[root@sat ~]# systemctl restart smart_proxy_dynflow_coreNOTE: There's a known bug affecting systems using directory information services, such as IdM. Basically, when executing ssh, it's executing
/usr/bin/sss_ssh_knownhostsproxyand this does not work with users that do not have a TTY (like the case offoreman-proxy). The workaround to solve this its commenting the following lines in/etc/ssh/ssh_config:#ProxyCommand /usr/bin/sss_ssh_knownhostsproxy -p %p %h # GSSAPIAuthentication yes ## If this option is set to yes then remote X11 clients will have full access ## to the original X11 display. As virtually no X11 client supports the untrusted ## mode correctly we set this to yes. # ForwardX11Trusted yes ## Send locale-related environment variables # SendEnv LANG LC_CTYPE LC_NUMERIC LC_TIME LC_COLLATE LC_MONETARY LC_MESSAGES # SendEnv LC_PAPER LC_NAME LC_ADDRESS LC_TELEPHONE LC_MEASUREMENT # SendEnv LC_IDENTIFICATION LC_ALL LANGUAGE # SendEnv XMODIFIERRemote Hosts Configuration
The remote hosts need to be configured to accept the private key that the smart proxy is using. Root is used as the default user for accessing remote hosts via SSH. You may set the
remote_execution_ssh_userglobal setting to change the default. If you would like to override at the host group, host, or other level, you may use parameters to do so. Set a parameter calledremote_execution_ssh_user.The ssh keys for the smart proxies are available as a host parameter (
remote_execution_ssh_keys). This allows you to manage the authorized keys with your configuration management platform of choice, or through a provisioning template.[root@sat ~]# ssh-copy-id -i /var/lib/foreman-proxy/ssh/id_rsa_foreman_proxy.pub root@icX.example.comNOTE: This step has to be repeated for all the client machines you want Insights to operate.
And that’s all that you need to do, happy remediating!
Posted: 2018-11-20T16:36:03+00:00 -
Running Insights remediation playbooks within Satellite 6.4
What’s all the fuss about Satellite 6.4?
Haven’t you heard the news? Satellite 6.4 gives you the ability to remediate your systems with Insights by executing remediation playbooks directly from the UI. How awesome is that?!

Let’s walk through the steps…
Insights Remediation within Satellite
In this blog, we’re going to identify and resolve issues with Insights, but this time from the Satellite UI (6.4 required), using Satellite 6.4’s new Ansible capabilities.
The first steps are the same as when using Insights in the Customer Portal, which you can read about in previous posts. In fact, the look and feel of the web-based app are exactly the same in the Satellite UI.
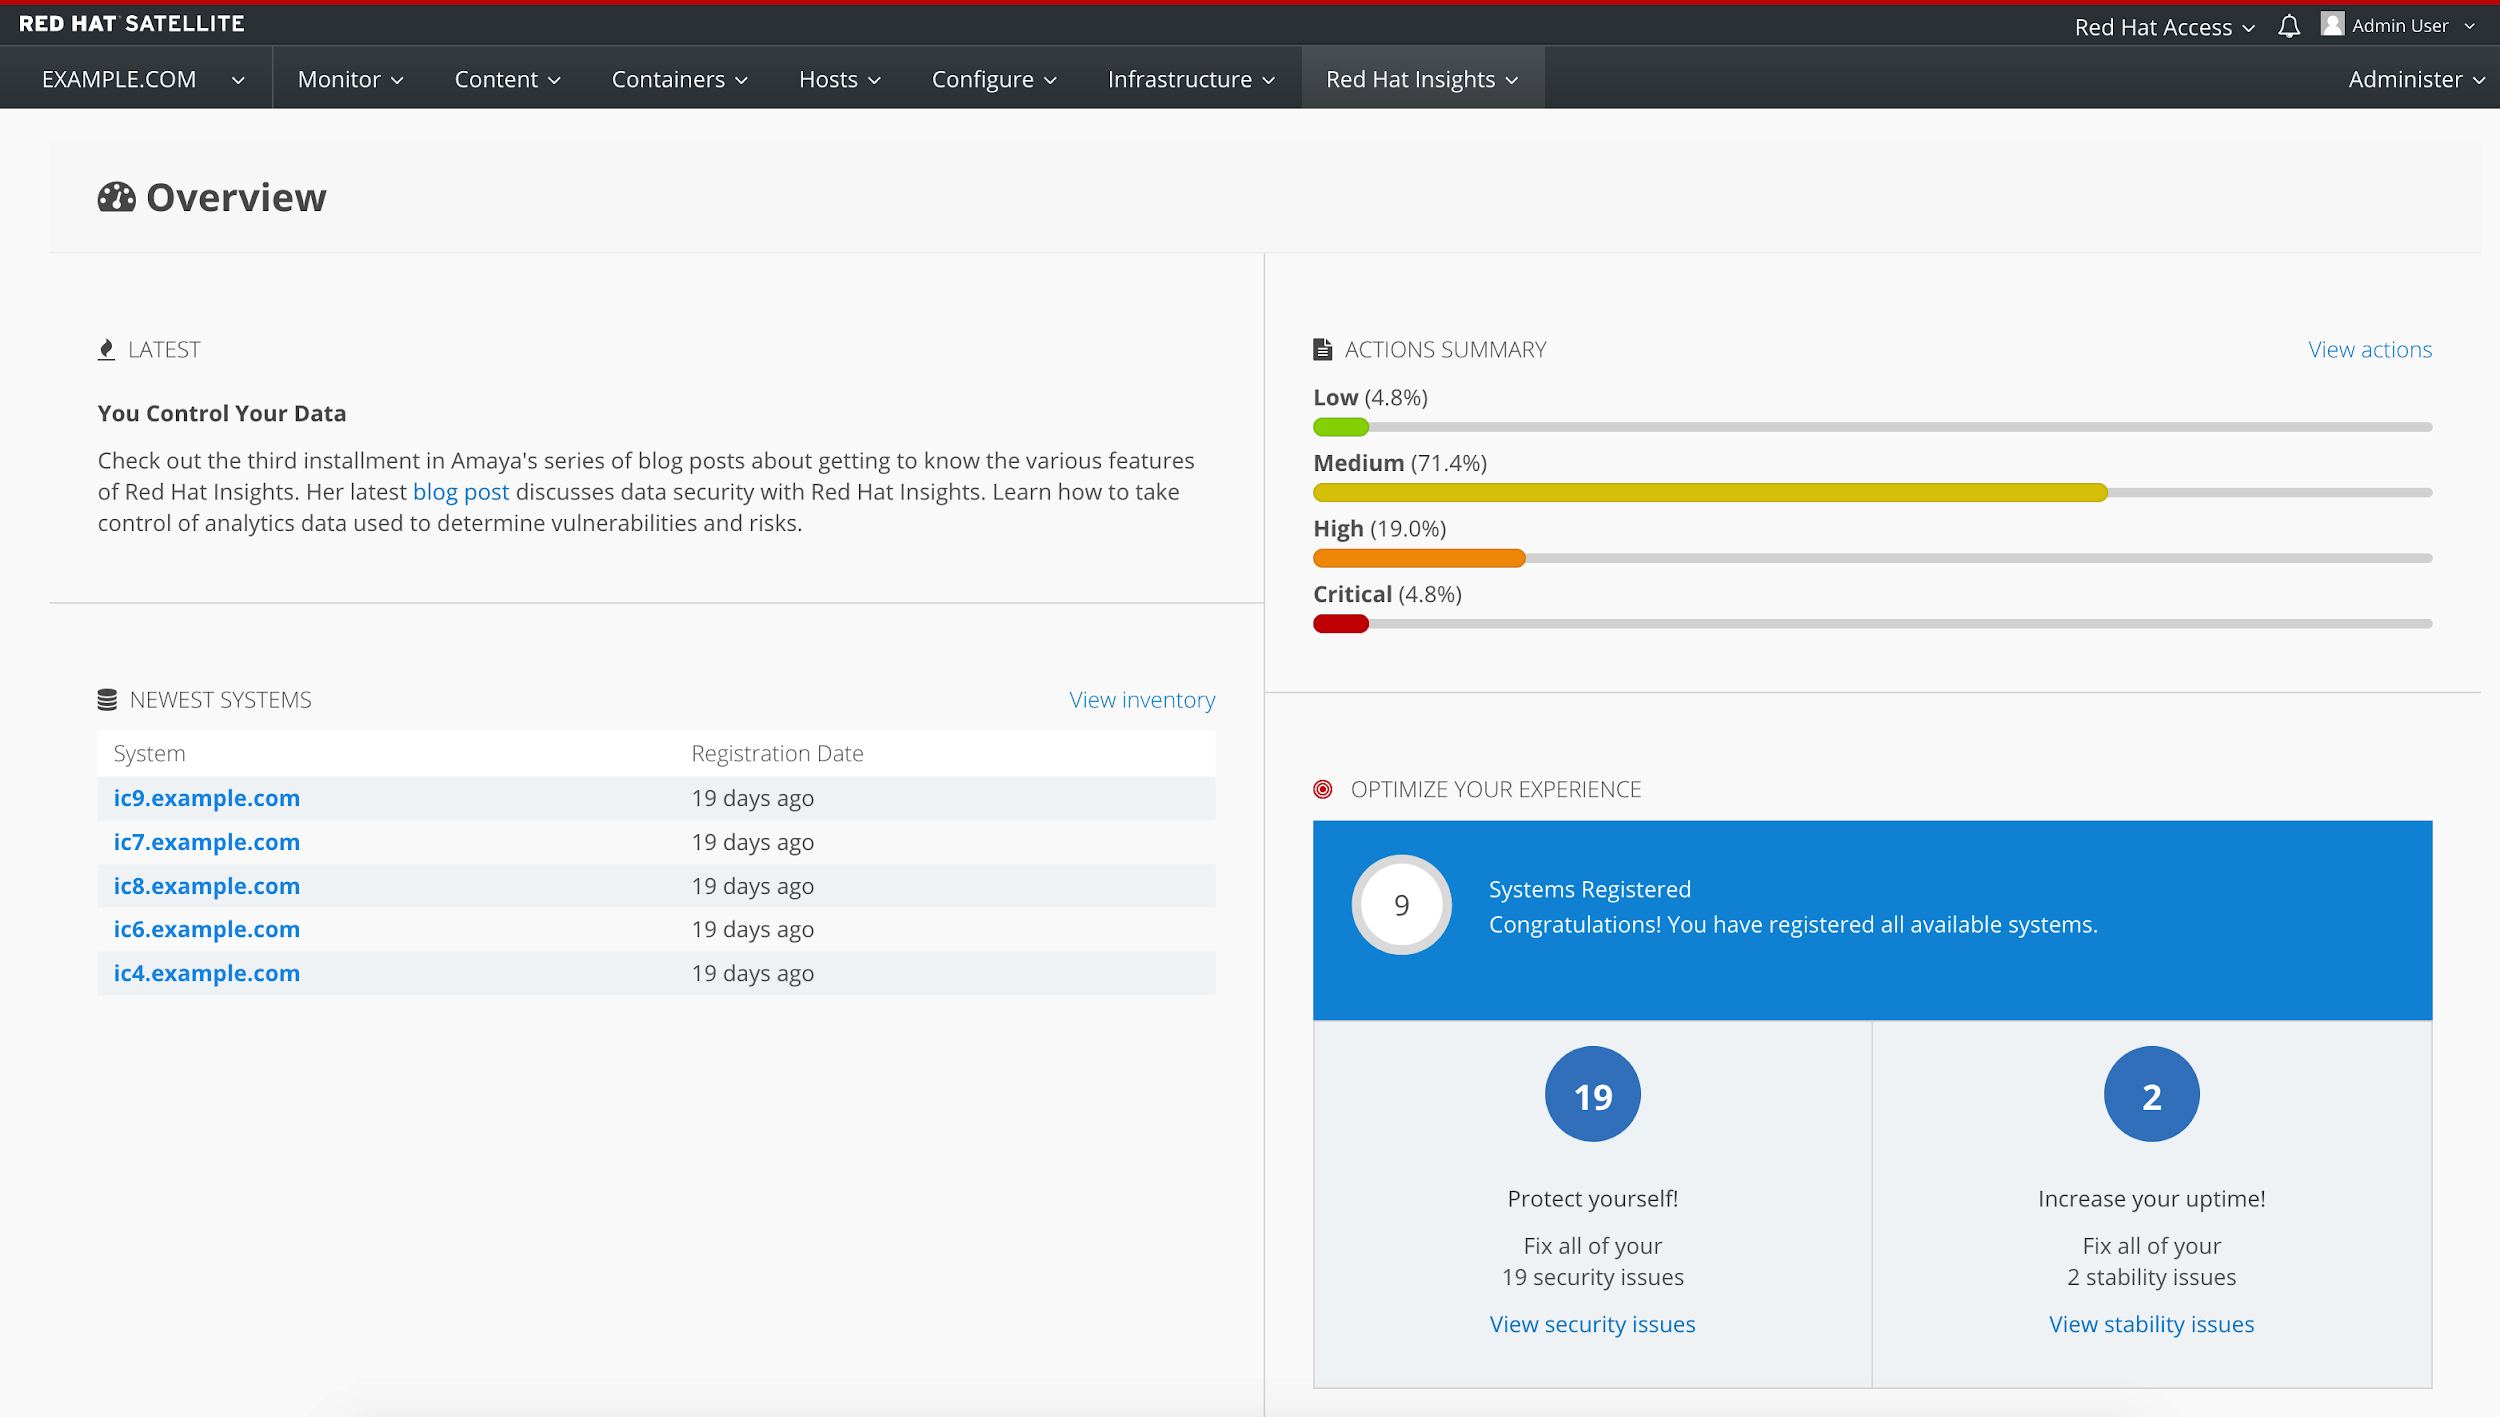
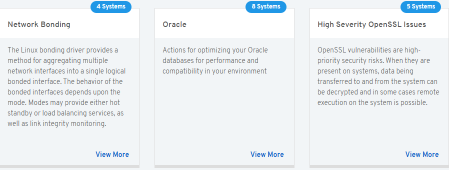
From the dashboard, you are able to identify the issues affecting your infrastructure at a glance, then jump to individual systems from the hyperlinks. Even the Insights menu is visible in the Satellite main menu.

Identifying actions
Like in the customer portal, you can see a list of actions along with the likelihood, impact, total risk, systems affected and whether there is an Ansible playbook solution for each of them.

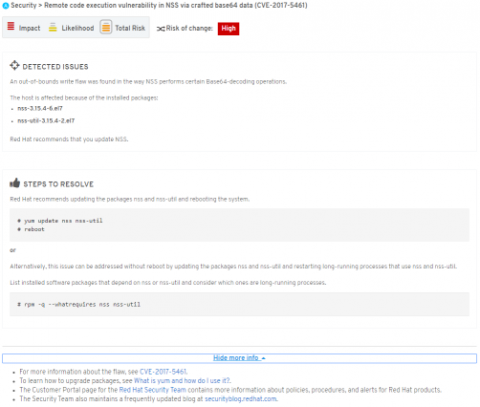
And again, as in Customer Portal, clicking on an issue gives us a description, solution, assessment of total risk and risk of change, and impacted systems.
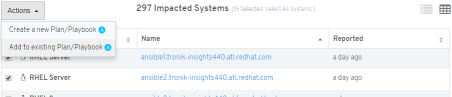
Actions available are create a plan / playbook or extend an existing one. This capability was already available on Satellite 6.3.

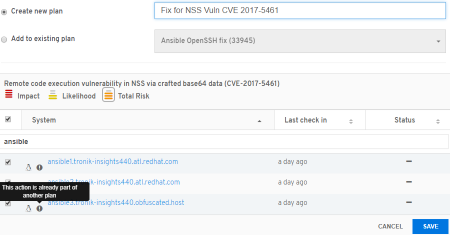
After you choose one of the actions, the plan builder pops up, just like in the customer portal.
Notice that it’s the exact look and feel for a better experience (coherence).
Creating the Plan

Remediating your systems
Here is where all the fun comes!!!
When you save your playbook, you’ll see the same summary as in the Customer Portal. But now, there’s no download button, just a drop down menu in which we can choose between downloading, customizing, or running the playbook directly from Satellite UI---with no need to have an ansible server configured!!

If you click on “Customize Playbook Run,” you can define parameters for when to run the playbook.

When you run the playbook, a visual circle graph lets you know the status of the remediation. The Overview tab shows details about the playbook and the Hosts tab shows greater detail about the remediation on each host.

All from the Satellite 6.4 UI!!!

Yes; it’s as awesome as it sounds. With the click of a button, you can remediate issues on your systems right from the Satellite UI! So sit back and enjoy your safe day with a coffee!
Posted: 2018-10-17T10:30:01+00:00 -
Red Hat Insights guidelines for deployment at scale
Insights guidelines for deployment at scale
Insights usage varies from customer to customer so there is no real "one size fits all" template. However it is worth highlighting some of the features Red Hat has in place to assist with large sized deployments. This is not intended to be a best-practices guide, just some things to consider.
Deployment
I typically emphasize how easy it is to deploy insights - with its minimal steps, because it is a SaaS solution. See the getting started guide. If a customer happens to be also managing these systems via a version of Satellite with Insights integration, mass registration of Insights is built in (via the bootstrap script provided with Satellite).
Proxy
A proxy is not required to be used for Insights, but typically the systems of customers with larger scale deployments are already set up to communicate with Red Hat via a proxy, rather than being individually connected (or in disconnected environments). Insights also supports this infrastructure model via proxy support as an option within our client, so there are no changes that you as the customer need to make to how your systems communicate with our servers.
If you are using a version of Satellite with Insights integration, it can be used as the proxy.Frequency
By default, Insights sends information once daily. We find that this default frequency fits the needs of most accounts.
However, one may have concerns about the impact, at scale, of all these clients checking in and transmitting a payload on your network. To help with this, we have implemented a default feature to make the Insights client automatically stagger its check-in time; so rather than all checking in at once, they'll check in individually or in random groups. All out of the box!And if you want to take it a step further and have full control of your own schedule, the Insights client can be customized via cron (when using RHEL 6) or via systemd (when using RHEL 7.5+).
Remediation
Setting up the systems is one thing to consider at scale, but once Insights is setup and detecting all those problems now on 1000+ systems, how do you take action at scale?
A few recommendations in this regard would be:
* Use Ansible remediation with Insights-generated playbooks to coordinate a fix for one or multiple issues impacting your infrastructure.-
Use Remediations to help coordinate planned remediations for actions and systems.
-
Address by severity - Insights applies one of 4 severity (risk) levels to all actions to help you focus on the most important ones.
-
Attack the low hanging fruit - Insights also provides a "Risk of Change" rating for actions depending on the impact of the change on the environment. Remediating actions with the lowest Risk of Change generally won't require any downtime or coordination.
Posted: 2018-09-07T15:04:56+00:00 -
-
Plans within Satellite!
Remediation plans within Satellite!
One of the most exciting capabilities in Satellite 6.3 is greater integration with Red Hat Insights. Although there are tons of other great features, this one is so important I thought it worth a blog post.
Using Red Hat Insights from the Satellite UI is now no different than using it in the Customer Portal. The coolest added feature brings the full functionality of Insights Planner to Satellite (planner itself was added in 6.2). You can now create remediation plans and generate Ansible Playbooks from within Satellite! From there, you can also review and download the playbooks to simply apply them when you’re ready.
Wanna know how? Just keep reading!
Easily create remediation plans from Satellite 6.3
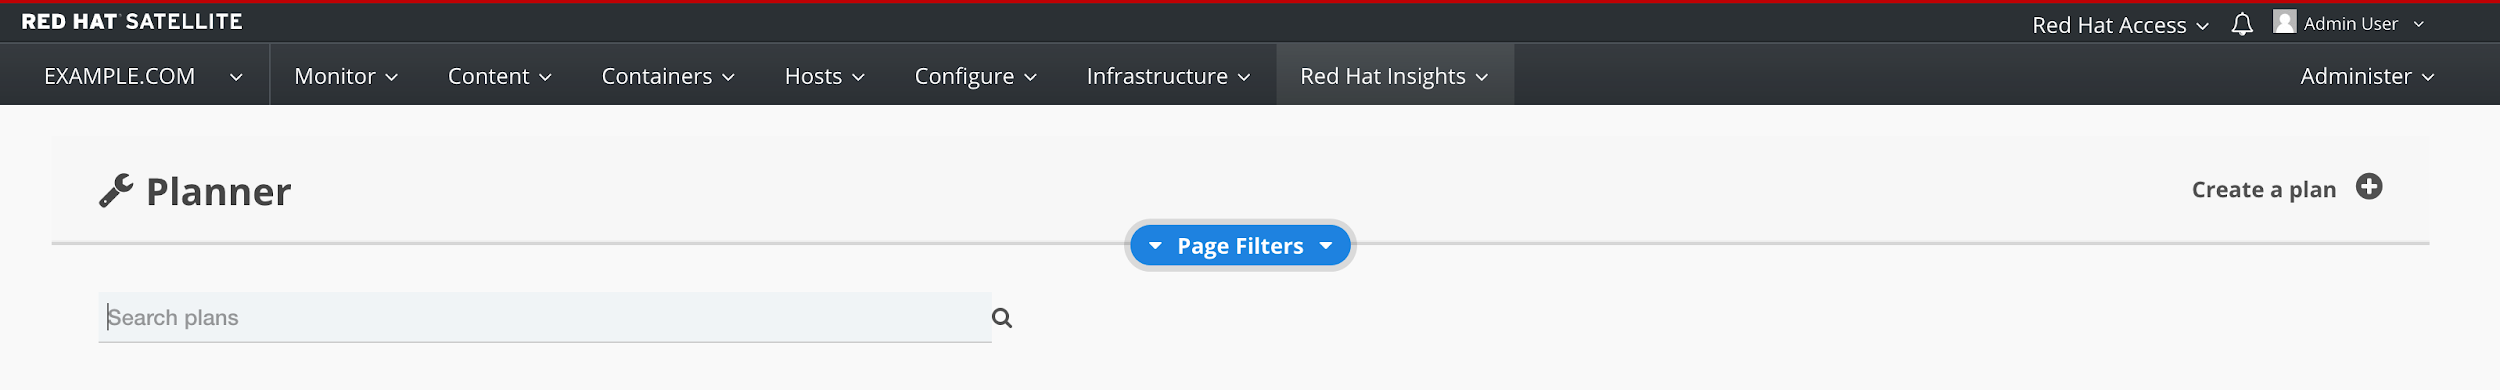
Go to Red Hat Insights -> Planner in your Satellite 6.3 and you'll see the same Insights Planner as is in the Customer Portal.

Click "Create a Plan" in the upper-right corner.
In the Plan/Playbook Builder, add a name for your plan or playbook. Select the system, systems, or group you want your plan to apply to and the actions you want the plan to solve.
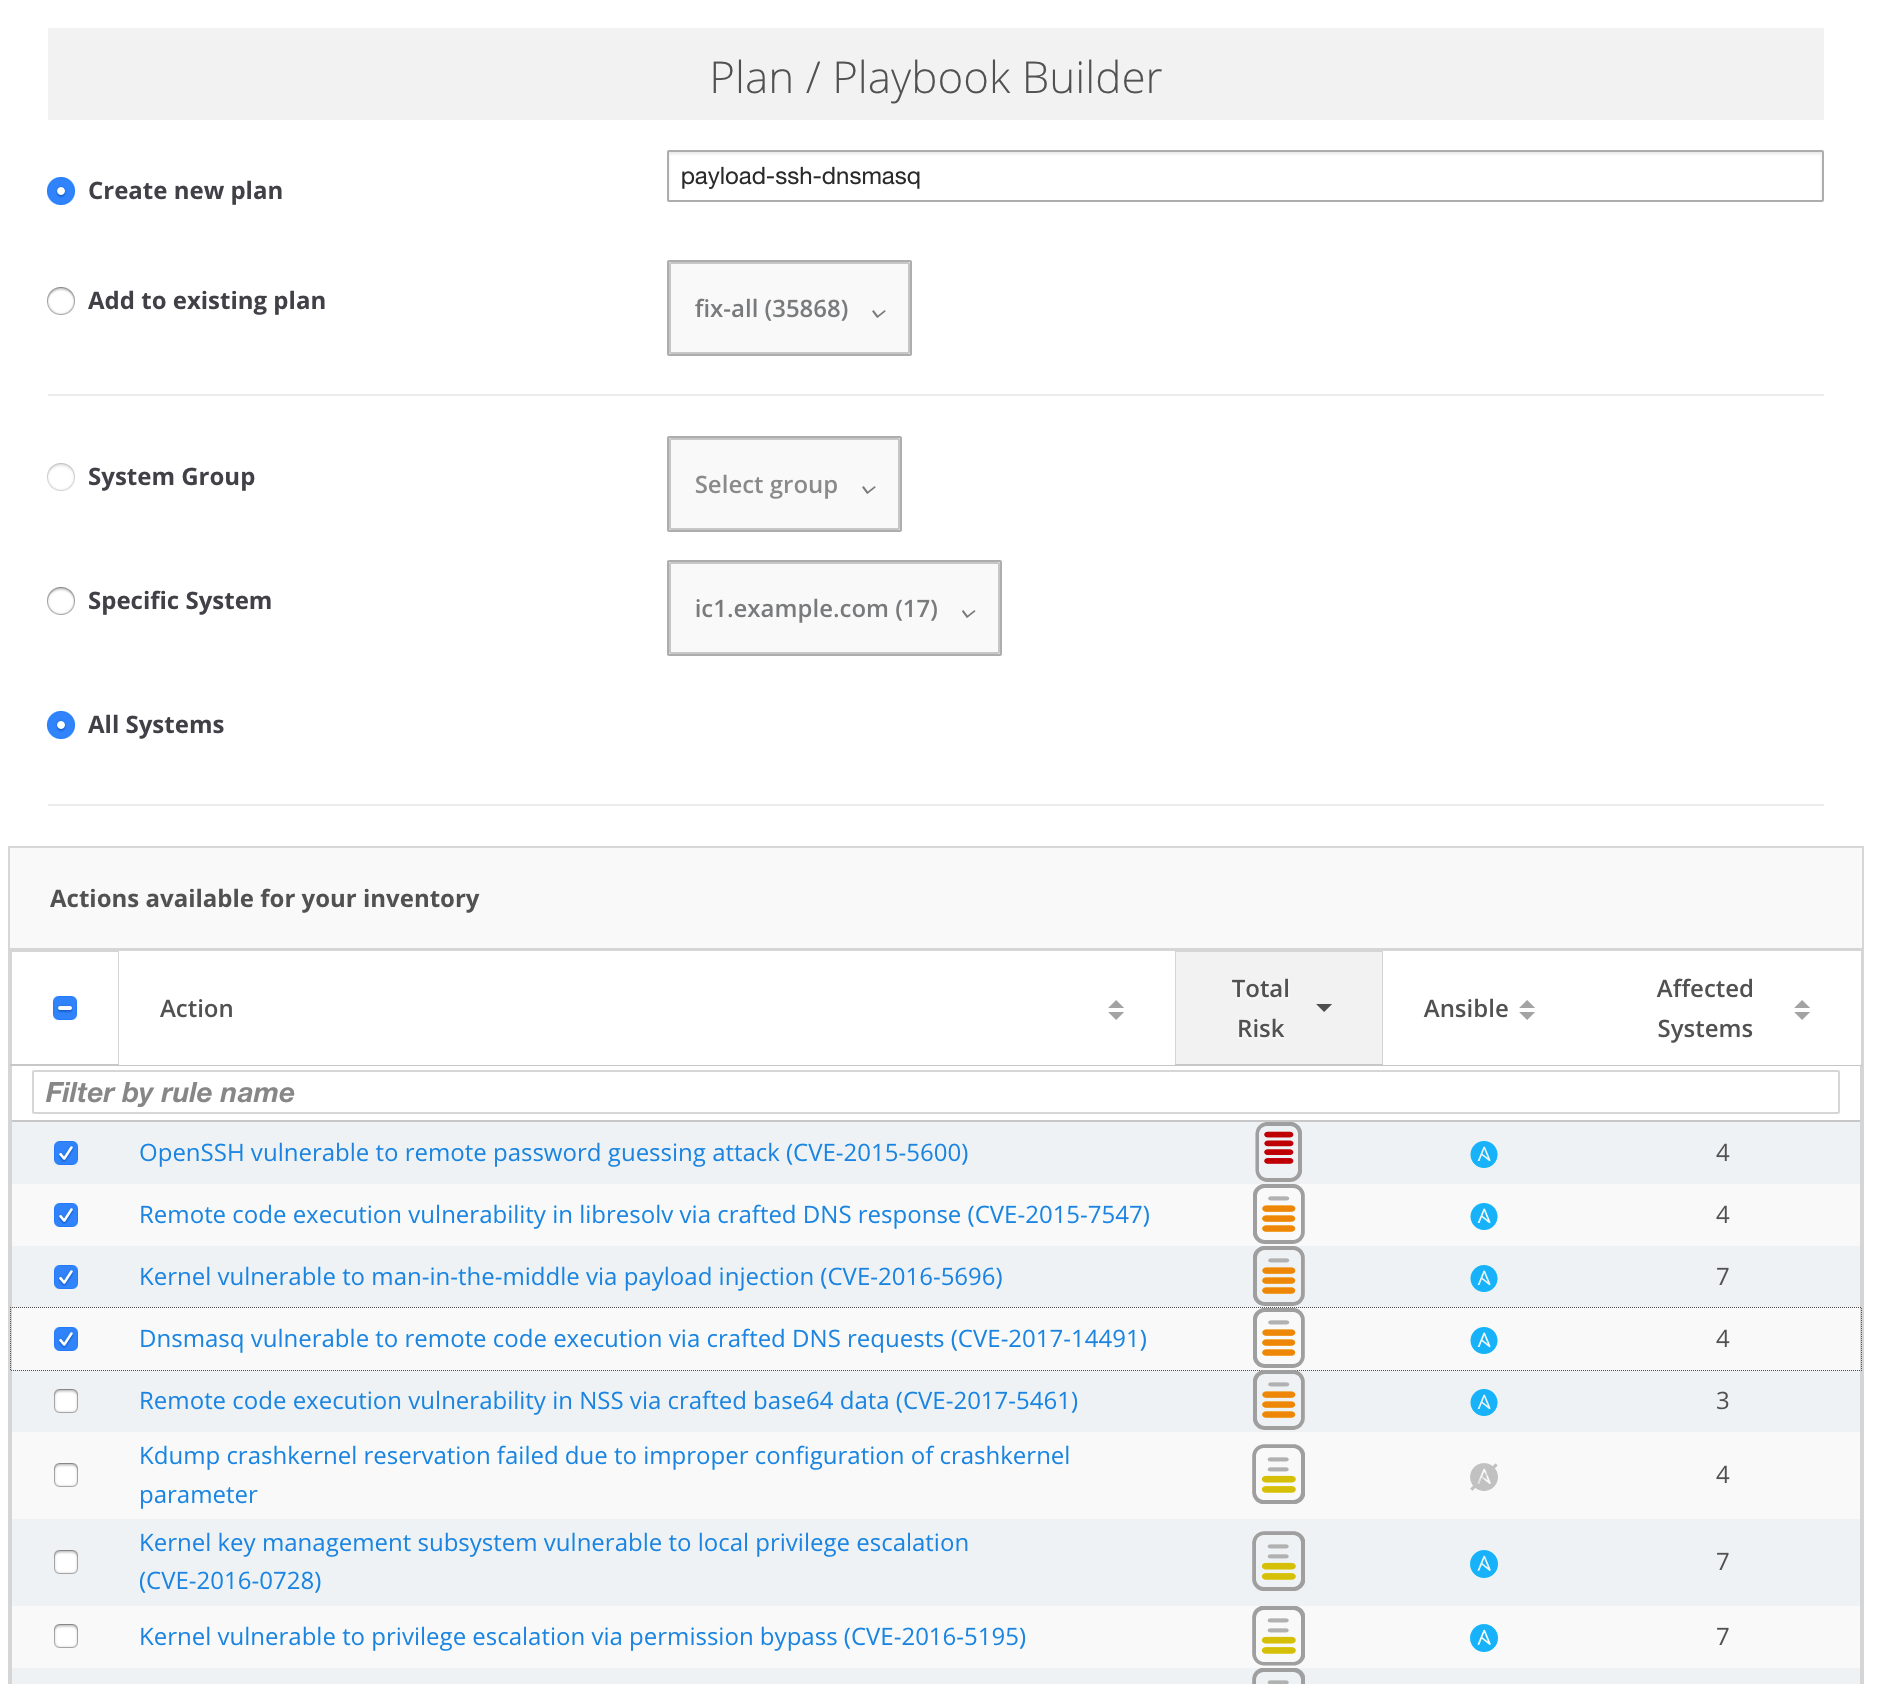
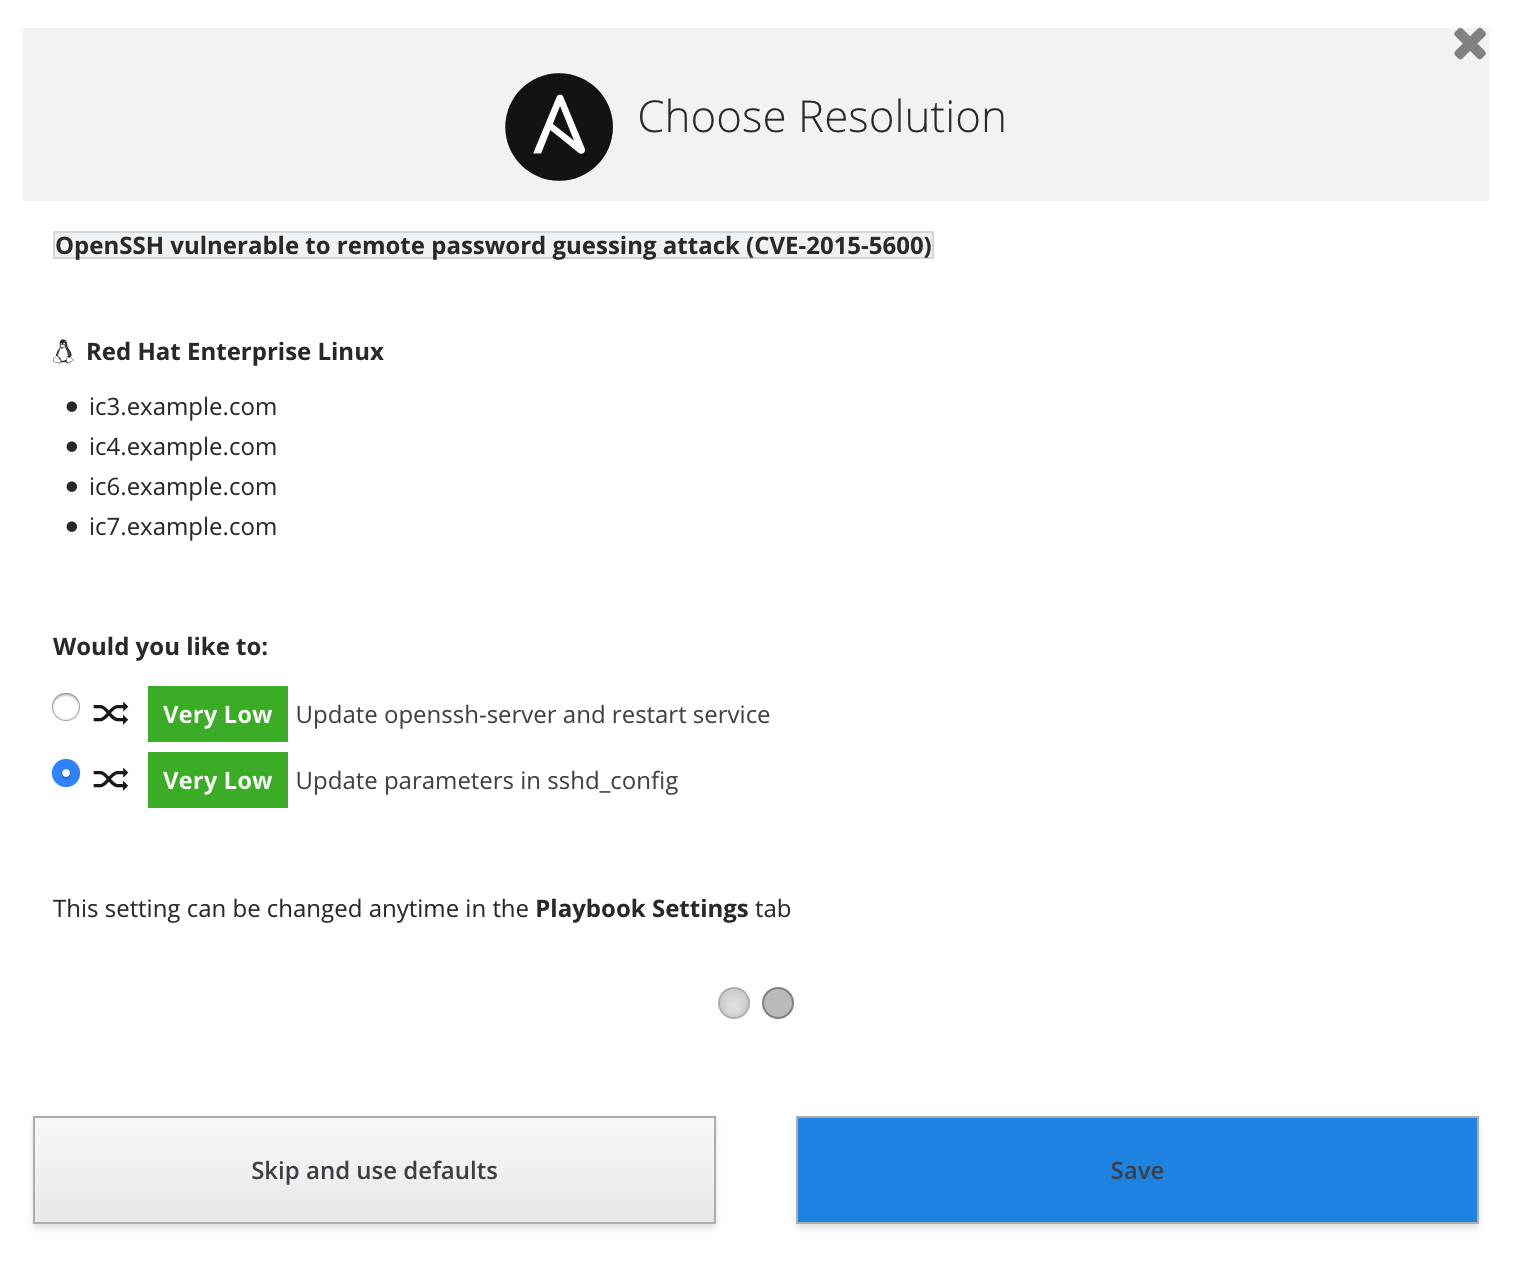
Insights may give you different resolution options, based on factors such as the risk of change or down time to the system. Choose the one that best fits your requirements.
Once that's done, your plan will pop up so you can review it. It's shown in a very visual way, so you can, at a glance, see the issues affecting the different systems and the total risk that issue represents.
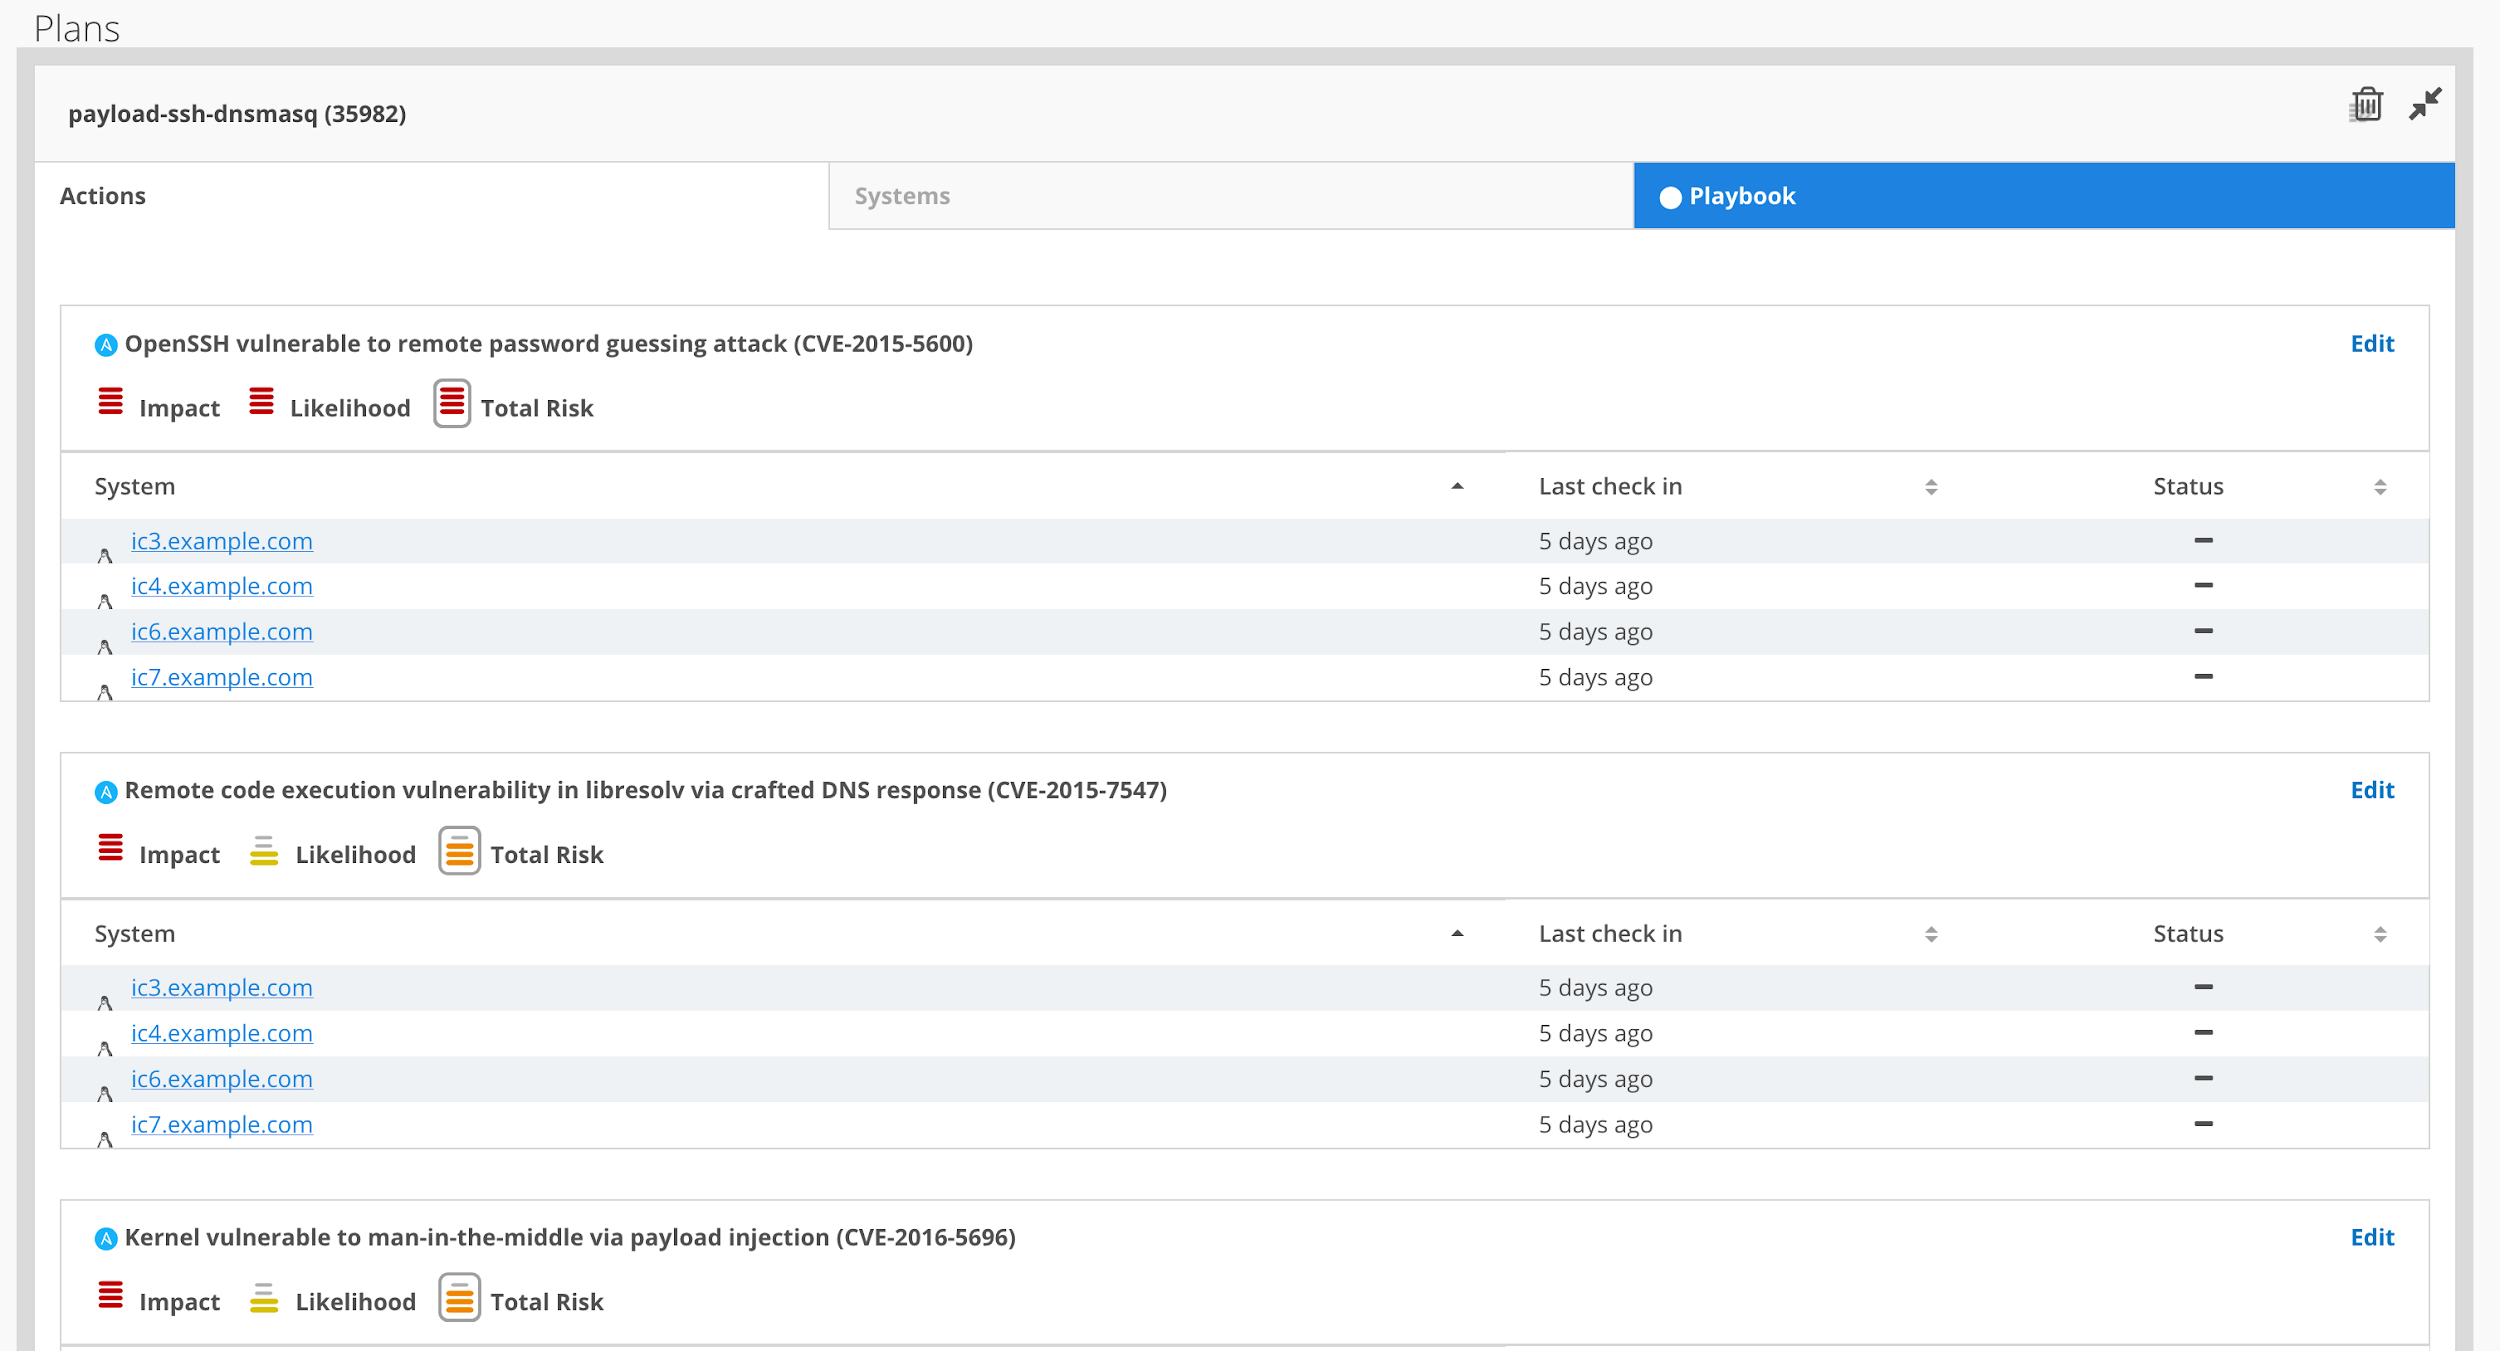
Next, download the automatically generated playbook.
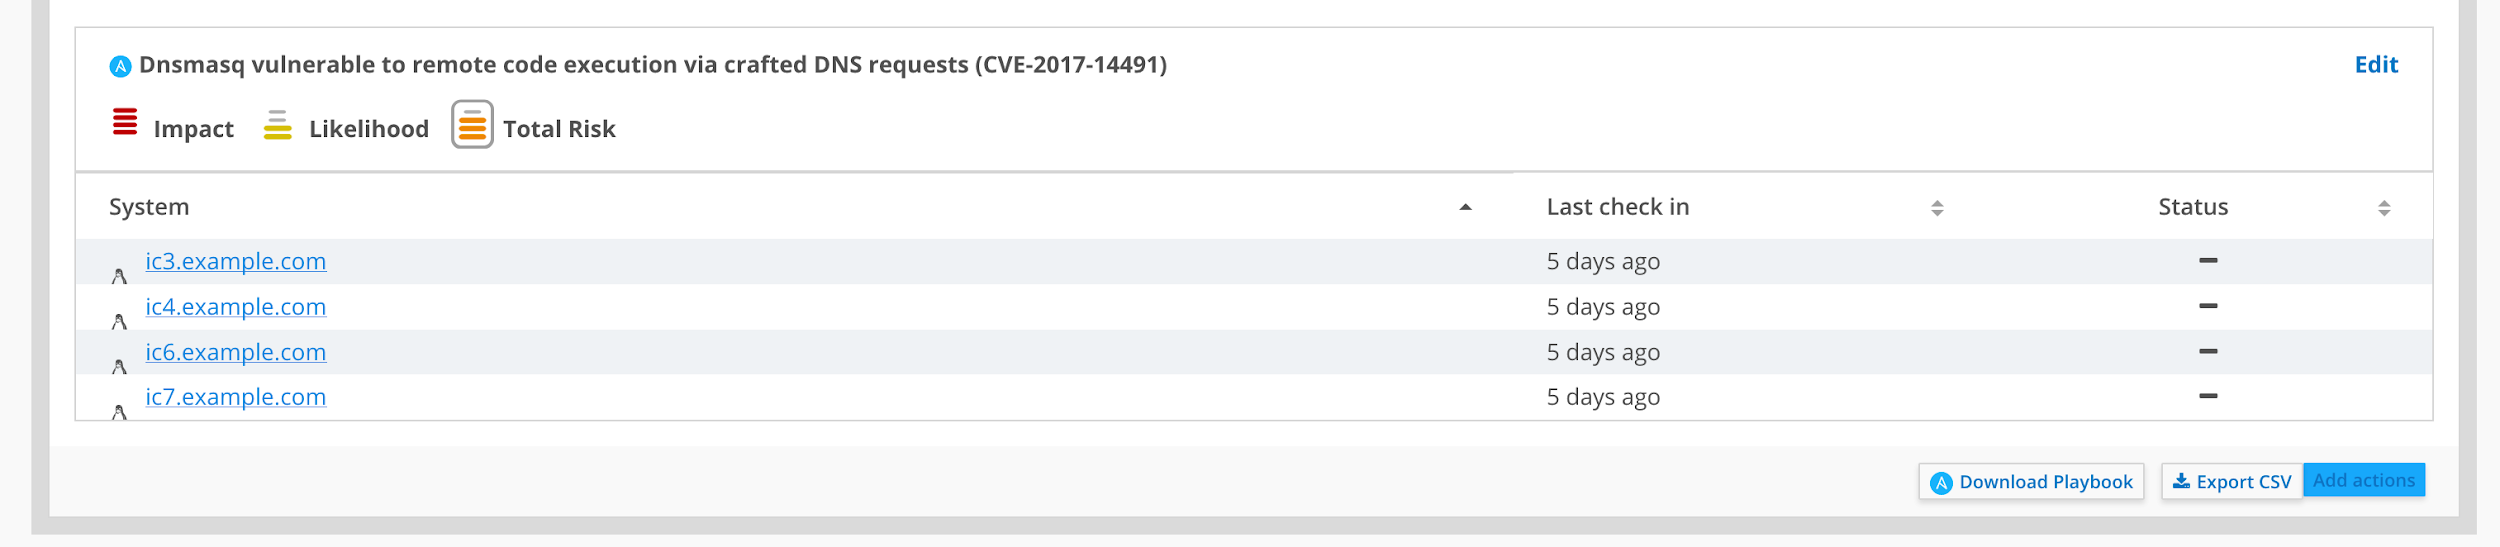
Once you've downloaded it, you can run it using Ansible from the command line as follows:
[root@tower ]# ansible-playbook payload-ssh-dnsmasq.yml
Happy remediating!
Posted: 2018-07-23T09:46:03+00:00 -
Insights 103
Back in the Hood!!
After a crazy and exciting week of innovations in San Francisco, here I am again to tell you a bit more on how to customize Red Hat Insights to your needs!
To blacklist or not to blacklist, that is the question
As explained in my previous post Red Hat Insights 102, you can control the data Red Hat Insights sends to Red Hat servers, how data is sent, and when it is sent. But deviating from the default has its drawbacks too.
We want to provide our customers with the necessary options and controls to the data that Insights collects. However, with each modification to the default payload sent to Red Hat, you may adversely change the level of analysis Insights provides about your environment. Since Insights collects what is minimally needed for analysis. Each removal of data from the collection payload can impact our rules capabilities to detect the issue within your infrastructure.
NOTE:
Before we continue, I want to add a few words about the differences in commands required for RHEL 6 vs. RHEL 7 systems. This will affect many of the commands shared below. The name of the Red Hat Insights client has changed for RHEL 7.5+ but has not yet done so for RHEL 6.
For RHEL 7.5+ users, the name of the client (and all commands and locations that use the name of the client) is
insights-client. For older RHEL users, the name and other changes will come to RHEL 6 with the release of RHEL 6.10. For now though, RHEL 6 users should continue to use the legacy client name:redhat-access-insights.Blacklisting information, or how to deny access to certain data
Red Hat Insights collects metadata about the runtime configuration of a system (approximately 1% of what would be collected via sosreport during a support case) but this data can be customized, anonymized, blacklisted and obfuscated in the way that you need.
You can decide to exclude entire files, specific commands, specific patterns, and specific keywords from the data that is sent to Red Hat. To enable these exclusions, you simply need to create a file called
/etc/redhat-access-insights/remove.conf(or/etc/insights-client/remove.confif you are already using RHEL 7.5) and specify this file in theremove_fileline of/etc/redhat-access-insights/redhat-access-insights.conf(or/etc/insights-client/insights-client.confif you are already using RHEL 7.5), as in the following example:[remove] files=/etc/cluster/cluster.conf,/etc/hosts commands=/bin/dmesg patterns=password,username keywords=super$ecret,ultra$ecretLet's dig into the directives from the example above.
files: A comma-separated list of files to be excluded. Each element in the list of files must be the absolute path to the file. To ensure exclusion, file names listed here must match exactly what is shown in the collection rules.commands: A comma-separated list of commands that should not be executed and whose output should not be sent. To ensure exclusion, command names listed here must match exactly what is shown in the collection rules.patterns: A comma-separated list of patterns that should not be sent.keywords: A comma-separated list of keywords that should not be sent. Matching keywords will be replaced with the literal keyword. For this option to take effect, theobfuscateoption must be set toTruein the/etc/redhat-access-insights/redhat-access-insights.conffile.
Important!
Patterns affect entire lines so any line that includes a matching pattern will not be sent.
As explained in my previous blog post, you can validate data to be sent with the
redhat-access-insights --no-uploadcommand.Let's get our hands dirty!
Let's take a look at what's collected and sent to Red Hat by the Red Hat Insights client using the default configuration.

To see what’s collected, without actually taking the action of collecting the data, we simply execute the agent with the
--no-uploadoption as follows:[root@gherkin ~]# redhat-access-insights --no-upload Starting to collect Insights data See Insights data in /var/tmp/oLUbKq/insights-gherkin-20180521110933.tar.gzTo inspect what's being collected, we simply have to unzip the generated tar.gz file and dig into it, through commands and files:
[root@gherkin ~]# tar xvfz /var/tmp/oLUbKq/insights-gherkin-20180521110933.tar.gz
[root@gherkin ~]# cd ./insights-gherkin-20180521110933/
We can see the hostname being collected:
[root@gherkin insights-gherkin-20180521110933]# cat insights_commands/hostname
gherkin
NIC information is also collected:
[root@gherkin insights-gherkin-20180521110933]# cat insights_commands/ethtool_eno1
Settings for eno1:
    Supported ports: [ TP ]
    Supported link modes:   10baseT/Half 10baseT/Full
                            100baseT/Half 100baseT/Full
                            1000baseT/Full
    Supported pause frame use: No
    Supports auto-negotiation: Yes
    Advertised link modes:  10baseT/Half 10baseT/Full
                            100baseT/Half 100baseT/Full
                            1000baseT/Full
    Advertised pause frame use: No
    Advertised auto-negotiation: Yes
    Speed: 1000Mb/s
    Duplex: Full
    Port: Twisted Pair
    PHYAD: 1
    Transceiver: internal
    Auto-negotiation: on
    MDI-X: off (auto)
    Supports Wake-on: pumbg
    Wake-on: g
    Current message level: 0x00000007 (7)
                   drv probe link
    Link detected: yes
Kernel version information, architecture, and OS version is collected too:
[root@gherkin insights-gherkin-20180521110933]# cat insights_commands/uname_-a
Linux gherkin 3.10.0-693.11.1.el7.x86_64 #1 SMP Fri Oct 27 05:39:05 EDT 2017 x86_64 x86_64 x86_64 GNU/Linux
[root@gherkin insights-gherkin-20180521110933]# cat insights_commands/uptime
 11:09:39 up 53 days, 10:27,  3 users,  load average: 0.40, 1.24, 0.90
Filesystems currently mounted on our machine:
[root@gherkin insights-gherkin-20180521110933]# cat insights_commands/mount
sysfs on /sys type sysfs (rw,nosuid,nodev,noexec,relatime)
proc on /proc type proc (rw,nosuid,nodev,noexec,relatime)
devtmpfs on /dev type devtmpfs (rw,nosuid,size=16323324k,nr_inodes=4080831,mode=755)
securityfs on /sys/kernel/security type securityfs (rw,nosuid,nodev,noexec,relatime)
tmpfs on /dev/shm type tmpfs (rw,nosuid,nodev)
[...]
Insights also collects the hostnames and IPs our system knows about (these are my home LAN's machines):
[root@gherkin insights-gherkin-20180521110933]# cat etc/hosts
127.0.0.1   localhost localhost.localdomain localhost4 localhost4.localdomain4
::1         localhost localhost.localdomain localhost6 localhost6.localdomain6
# Máquinas virtuales residentes en gherkin
192.168.100.250 ansible-tower    ansible-tower.tortilla.org
192.168.100.189    ansible-node1    ansible-node1.tortilla.org
192.168.100.199    icg1        icg1.example.com
192.168.100.202    icg2        icg2.example.com
192.168.100.147    icg3        icg3.example.com
192.168.100.194    icg4        icg4.example.com
But what if I don't want to send all that data to Red Hat? Well, let's configure our host so it won't send the previous data.
First of all, we need to configure
/etc/redhat-access-insights/redhat-access-insights.confto tell the Insights agent where theremove.conffile to be used is located:[root@gherkin ~]# vi /etc/redhat-access-insights/redhat-access-insights.conf [redhat-access-insights] remove_file=/etc/redhat-access-insights/remove.confSince we don't want to send our own machine name or IP to Red Hat, in the very same file, we need to specify to obfuscate them as follows:
# Obfuscate IP addresses
obfuscate=True

# Obfuscate hostname
obfuscate_hostname=True
Another thing Red Hat Insights collects is the sshd configuration, for example, the access type:
[root@gherkin insights-gherkin-20180521110933]# cd etc/ssh/
[root@gherkin ssh]# grep -E '[P|p]assword' *
#PermitEmptyPasswords no
# the setting of "PermitRootLogin without-password".
Now it's the time to tune the
remove.conffile to our needs:[root@gherkin ~]# vi /etc/redhat-access-insights/remove.conf [remove] files=/etc/hosts,/proc/cpuinfo commands=/bin/dmesg,/bin/mount,/bin/mount,/bin/uname -a,/sbin/ethtool,/usr/bin/uptime patterns=password,usernameIn this way, all the previous information won't be collected and sent. To verify it, we just need to re run the agent with
--no-uploadoption, and see its results:[root@gherkin ~]# redhat-access-insights --no-upload WARNING: Excluding data from files Starting to collect Insights data WARNING: Skipping command /bin/dmesg WARNING: Skipping command /sbin/ethtool WARNING: Skipping command /bin/mount WARNING: Skipping command /bin/uname -a WARNING: Skipping command /usr/bin/uptime WARNING: Skipping file /proc/cpuinfo WARNING: Skipping file /etc/hosts See Insights data in /var/tmp/eJ9LoU/soscleaner-3125813513575232.tar.gzBy executing the agent, you can see the list of commands that will be skipped, as specified in the remove.conf file).
In addition, we'll inspect each of the previous commands and files from the
tar.gzfile:[root@gherkin soscleaner-3125813513575232]# cat insights_commands/hostname host0 [root@gherkin soscleaner-3125813513575232]# cat proc/cpuinfo cat: proc/cpuinfo: No such file or directory [root@gherkin soscleaner-3125813513575232]# cat etc/hosts cat: etc/hosts: No such file or directory [root@gherkin soscleaner-3125813513575232]# cat insights_commands/ethtool_eno1 cat: insights_commands/ethtool_eno1: No such file or directory [root@gherkin soscleaner-3125813513575232]# cat insights_commands/mount cat: insights_commands/mount: No such file or directory [root@gherkin soscleaner-3125813513575232]# cat insights_commands/uptime cat: insights_commands/uptime: No such file or directoryAnd finally, let's verify how patterns also work with the example of the sshd configuration:
[root@gherkin soscleaner-3125813513575232]# cd etc/ssh/
[root@gherkin ssh]# ls
sshd_config
[root@gherkin ~]# grep -E '[P|p]assword' sshd_config
Wrapping up
Red Hat Insights has been designed to ensure that minimal, specific data is collected.
We encourage customers to check what is collected with the
--no-uploadoption prior to making modifications.Find out more
If you want to know about the patterns and files and commands Insights collects data from as well as the the whole list of files and commands that are used to collect data from, you can take a look at this document.
Posted: 2018-05-29T19:35:47+00:00 -
Red Hat Management & Automation with Insights at Red Hat Summit San Francisco 2018!
Hi again everyone, I'm Will Nix, Technical Evangelist for Red Hat Management & Automation and I'm headed into my 7th year here at Red Hat. I'm really excited for everyone to join us this year at Red Hat Summit 2018 in San Francisco's Moscone center.
For the past several years I've presented at Summit, and again this year I'll be presenting in several sessions, labs, and workshops. Check out a really brief description below and join me! Sign up for the events in your Red Hat Summit app, and don't forget to give us feedback on how the sessions went!
Check out a list of all sessions where we'll be spreading the proactive systems management goodness here: https://agenda.summit.redhat.com/SpeakerDetail.aspx?id=365781:
Session: Smarter infrastructure management with Red Hat Satellite & Red Hat Insights on Tuesday, May 8 at 10:30 AM - 11:15 AM
Learn how to integrate Satellite and Insights systems managment with prescriptive analytics to prevent unplanned downtime and enable secure deployments in your clouds and datacenters.

Session: Operations risk remediation in highly secure infrastructures on Tuesday, May 8 at 11:45 AM - 12:30 PM
For customers who are operating in connected highly secure environments and want to take advantage of Red Hat's prescriptive analytics and systems management service, Red Hat Insights.

Mini-session: Monitor and automate infrastructure risk remediation in 15 minutes or less on Tuesday, May 8 at 3:55 PM - 4:15 PM
A quick 15 minute session on the fastest way to begin monitoring risk in your Red Hat infrastructure.

Lab: Implementing proactive security and compliance automation on Wednesday, May 9 at 10:00 AM - 12:00 PM
Replay: Implementing proactive security and compliance automation on Wednesday, May 9 at 1:00 PM - 3:00 PM
Join us in this lab to see how to use various Red Hat management and platform technologies to automate security in your environments.

Lab: Integrated management with Red Hat technologies on Thursday, May 10 at 10:45 AM - 12:45 PM
Choose your own adventure with each of Red Hat's Management technologies in this integrated lab, highlighting Red Hat CloudForms, Red Hat Ansible Tower, Red Hat Insights, and Red Hat Satellite.

BYOD Workshop: Red Hat Satellite and Red Hat Insights test drive on Thursday, May 10 at 1:45 PM - 3:45 PM
Bring your own laptop and login to a virtual lab environment where you can test drive Red Hat's latest Satellite 6 to quickly learn how to do content management and prescriptive analytics.
One more thing! Drop by the Red Hat Management and Automation booth to check out demo's of Red Hat Ansible Automation technology, Satellite, CloudForms, and Insights. Let us know how we can help you better manage your mission critical environments.
Thanks, and see you there!
-WillPosted: 2018-05-01T15:21:09+00:00 -
Insights 102
Before we begin...
Before we begin with how to configure Red Hat Insights to be tailored to your needs (in terms of controlling what is sent to Red Hat servers and how it is sent) let me please remind you of the very basics of Red Hat Insights…
Can I control what Red Hat Insights is doing behind the curtains?
Absolutely!
Red Hat Insights collects metadata about the runtime configuration of a system. The data collected is 1% of what would be collected via sosreport during a support case. The data collected is a subset of an sosreport, so if a sosreport has been approved for usage, Insights data collection should also be acceptable.
The Red Hat Insights tool allows customers to review the data being collected by use of a
--no-uploadparameter. This runs the Insights client & collection, but does not transmit it to Red Hat for analysis. This collection is stored locally in a temporary directory where it can be inspected.# ls -lh /var/tmp/TAFHhW/insights-amaya-insights2-20180129165816.tar.gz -rw-r--r--. 1 root root 138K Jan 29 16:58 /var/tmp/TAFHhW/insights-amaya-insights2-20180129165816.tar.gz # ls -lh /var/tmp/sosreport-amaya-insights2-20180129165924.tar.xz -rw-------. 1 root root 12M Jan 29 16:59 /var/tmp/sosreport-amaya-insights2-20180129165924.tar.xzThat data is sent to Red Hat’s servers over SSL and compared to our Support Knowledge Database, looking for matches, and results sent back to customer, in the form of actions, where they are displayed.
Insights on Red Hat Insights
Red Hat Insights requires Python-2.6.6-64 or later, being its main configuration file:
/etc/redhat-access-insights/redhat-access-insights.confRed Hat Insights registration will auto-detect how the system is registered for software updates and can auto-configure the client based on that information. For auto-configuration, CERT is the default authmethod. Otherwise, authmethod can be set to BASIC, requiring a username and password for the target Insights server (Customer Portal or Satellite).
Red Hat Insights uses Satellite server as a Proxy to send diagnostic data to the Customer Portal so requires a connected environment.
Log files
The log file can be found at
/var/log/redhat-access-insights/redhat-access-insights.log. The logs rotate each time data is successfully collected, to.log.1,.2,.n,so be aware that if an upload has occurred since the case was opened, relevant logs might now be in a different file.
The log file records the process of collecting data and uploading that data to the Insights server.I still want to control more of it
Well, you can!
Insights can be configured by the customer to further restrict what's collected / sent, and optionally to obfuscate hostname and / or IP addresses from reports if desired. Customers can always look at the source code directly from the rpm - everything is made available for their perusal.
All data is trimmed down to the minimal necessary facts before being uploaded and encrypted both in transit and at rest. The customer may also choose to alter the name chosen to represent the system in the UI (eg,
apache01.prodinstead of a fully qualified domain name).Customers can opt-out of sending any data they wish to the service via a configuration blacklist. The service will continue to function, and only health checks which depend on that specific piece of data will be impacted.
The Insights client will enable customers to ignore any specific file, keyword or pattern, making data redaction easy to use.
The data collected is sent over a secure TLS / https connection. It's encrypted at rest on Red Hat's systems using LUKS encryption, and is kept only until the next report is received, which by default is 24 hours. If another report doesn't arrive in the scan interval period, the data on file (encrypted) is kept for a maximum of 2 weeks and then deleted from our systems.
The Red Hat Insights client also provides an easy parameter to obfuscate hostname and IP information. The actual hostname and IP information is replaced with consistent obfuscated names sufficient for rule analysis.
How is data collected?
As new Insights rules are identified, there may be a need for additional metadata collection for analysis and detection. The list of System Information collected by Red Hat Insights is updated on an as-needed basis. The Red Hat Insights client, upon running, pings Red Hat to determine if any additional metadata is needed for rules which have been introduced since the last run. For example, if a new malware check is added, Insights may need to inspect new data sources to determine if a system is impacted.
This automatic check is enabled by default to ensure customers get all new rules and proactive alerts for their system. This ping to Red Hat can be disabled and manually updated via rpm version; however, this may cause customers to miss out on new health checks which depend on new information.
When Red Hat updates the collection rules, the rules are GPG signed by the redhat-tools GPG key. The Insights client will immediately abort if this signature cannot be verified. This file is also manually inspected carefully before each update is released.
Some examples
These are some of the files Red Hat Insights collects and sends to be processed:
/etc/redhat-release
/proc/meminfo
/var/log/messages
Do not worry! we do not collect the entire messages file, but rather the lines that match a potential rule (i.e. page allocation failure).
Or some of the commands we run:
Commands:
/bin/rpm -qa
/bin/uname -a
/usr/sbin/dmidecode
If you want to know the whole list of commands run and data collected you can take a look at this document.
As said, main configuration file is
/etc/redhat-access-insights/redhat-access-insights.conf, and it’s a very usual ini type of file with # delimited comments, let’s take a brief look at it:[root@server ~]# cat /etc/redhat-access-insights/redhat-access-insights.conf # Example options in this file are the defaults # Change log level, valid options DEBUG, INFO, WARNING, ERROR, CRITICAL. Default DEBUG #loglevel=DEBUG # Log each line executed #trace=False # Attempt to auto configure with Satellite server #auto_config=True # Change authentication method, valid options BASIC, CERT. Default BASIC #authmethod=BASIC # username to use when authmethod is BASIC #username= # password to use when authmethod is BASIC #password= [...]To obfuscate your IP addresses, simply add the line:
obfuscate=TrueOr to obfuscate hostnames, simply add the line:
obfuscate_hostname=True BlacklistAnd addding items to the blacklist is as simple as using
/etc/redhat-access-insights/remove.confWrapping up...
We know you are concerned about the security of your data, yet there are times when it needs to be shared to provide the best capabilities for optimization and management. For this reason I wanted to let you know that the team here at Red Hat understands, and has worked hard to provide you with powerful tools that keep your data safe.
Wanna know more?? Find more info here.Posted: 2018-02-19T17:58:15+00:00 -
Insights 101
The new girl in the hood!
First of all, let me introduce myself, my name is Amaya Gil and I’m a new Insights SME (so you will see a lot of me from now on), working as a Technical Marketing Manager in the Management BU at Red Hat.
I’m a Computer Science Engineer from Madrid (Spain) and I’ve been a Redhatter since 2.010 evolving from different EMEA SA roles to the BU.
I also happen to speak four languages and since English is one of them… here you go!
What is Red Hat Insights?
Haven't heard of Red Hat Insights yet? No problem, this is Red Hat Insights first stop!!!
Red Hat Insights is a Software-as-a-Service (SaaS) offering that provides continuous, in-depth analysis of registered Red Hat-based systems to proactively identify threats to security, performance and stability across physical, virtual and cloud environments, and container deployments.
Red Hat Insights analyzes select files on a system, getting smarter with each additional piece of intelligence and data. Red Hat Insights can automatically discover relevant information, proactively recommend tailored next actions, and even automate tasks with Ansible Playbooks. Using Red Hat Insights, customers can benefit from the experience and technical knowledge of Red Hat Certified Engineers, making it easier to identify, prioritize, and resolve issues before business operations are affected.
As a SaaS offering, Red Hat Insights regularly updates and expands its knowledge base to reflect new IT challenges that can impact the stability of mission-critical systems.
We even got a video for you!
If I was still unable to make myself clear with what Red Hat Insights is, in this link I leave you a very quick video that would definitely clear your mind: Introduction to Red Hat Insights
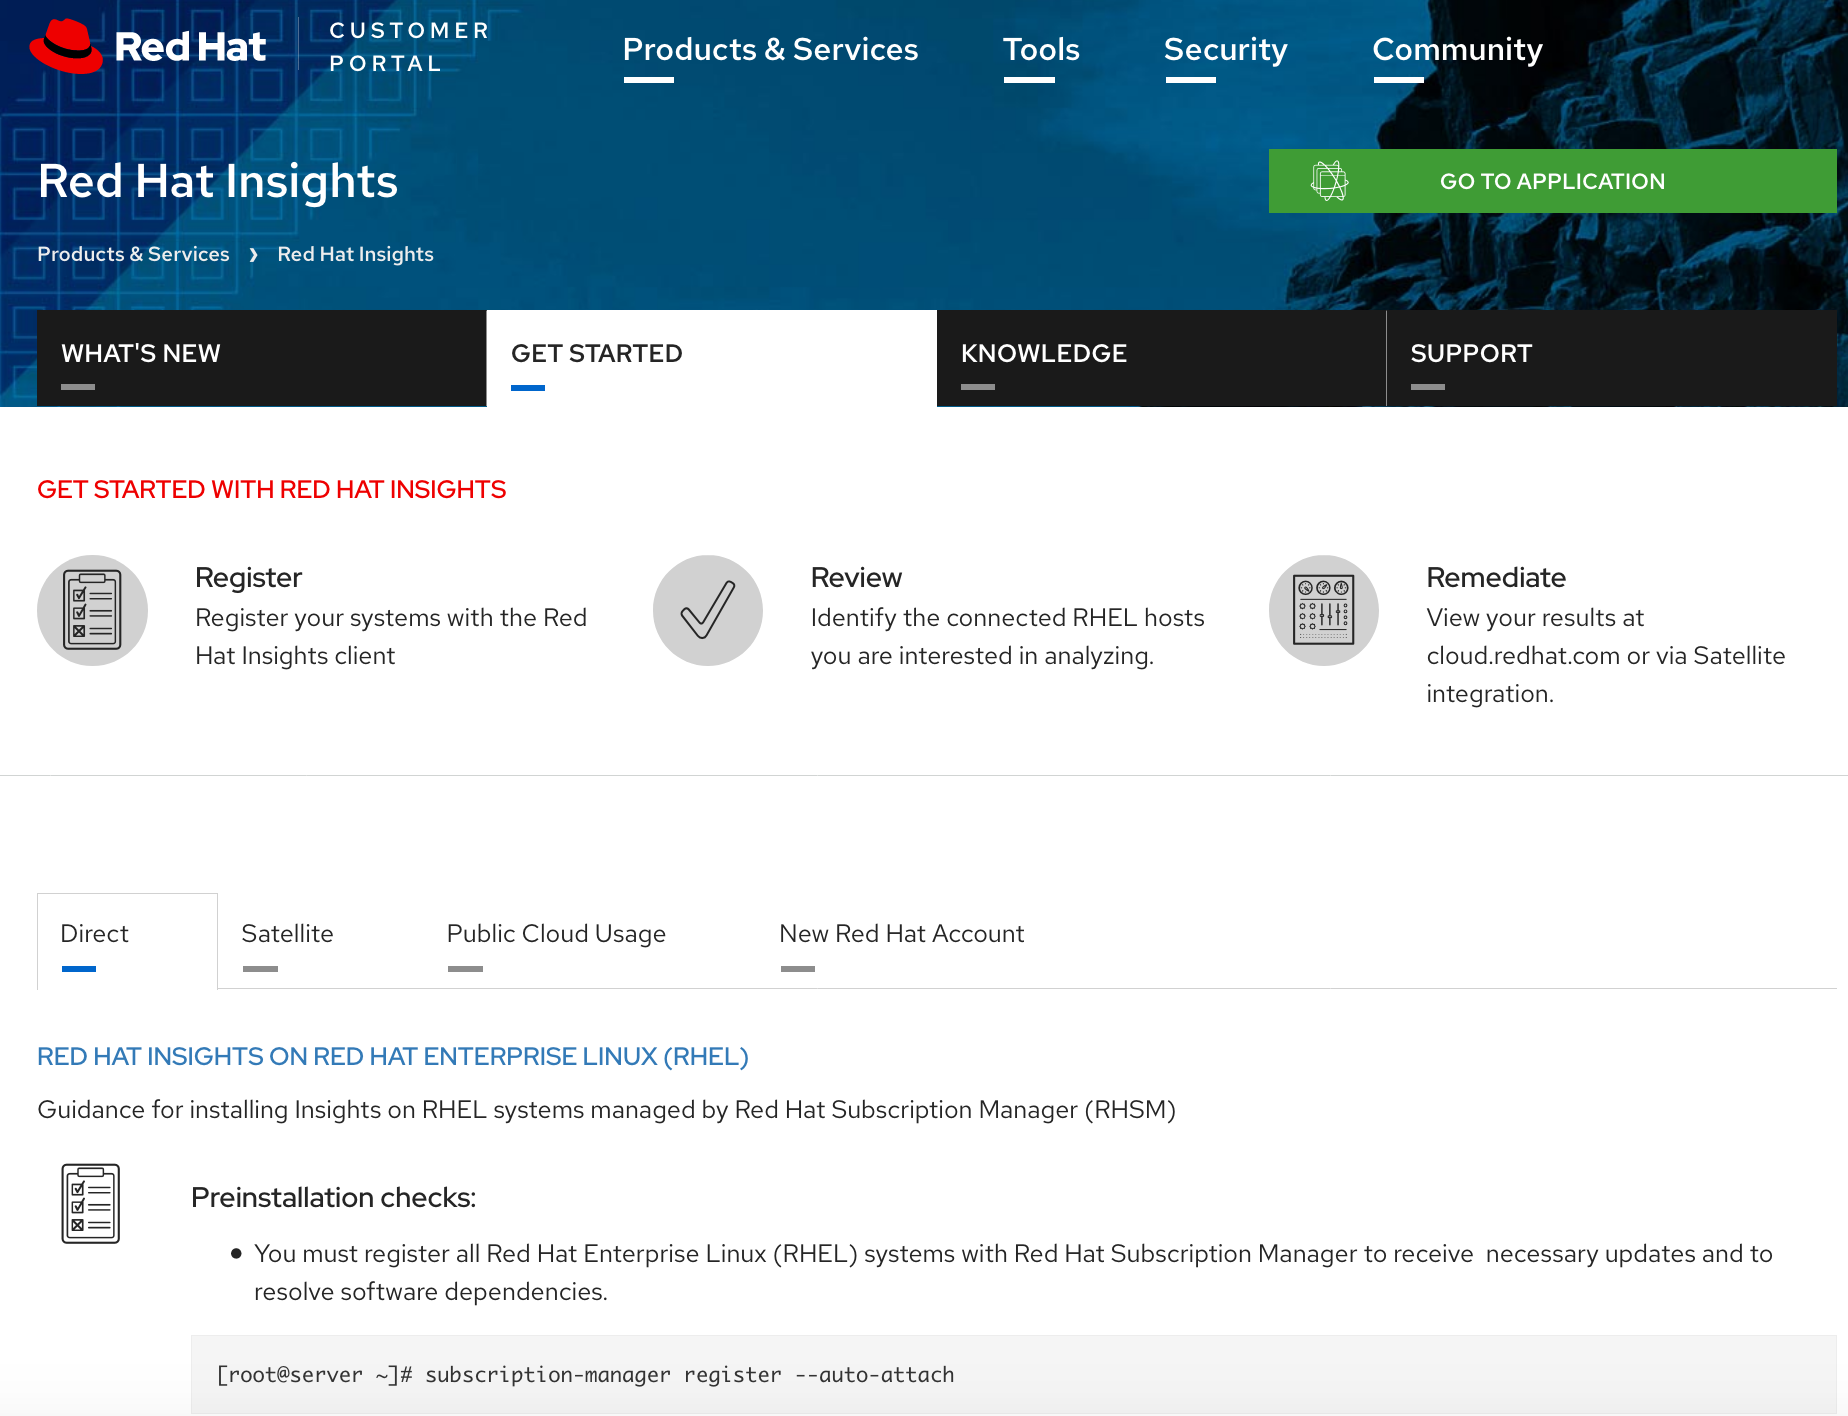
Getting started with Red Hat Insights
To access Red Hat Insights, you just need a valid subscription to Red Hat and install the agent on each and every machine you want to monitor, it is as simple as running this command:
[root@server ~]# subscription-manager register --auto-attach [root@server ~]# yum install redhat-access-insights [root@server ~]# redhat-access-insights --registerBut no worries! You can also evaluate Red Hat Insights before purchasing it,
to begin evaluating Red Hat Insights, visit Insights Evaluation to activate any available evaluations associated with your account. This step must be completed prior to any system registration with Insights (the steps above).You must have RHEL 6 and later, or RHEL 7 and later, to use Insights (this process can be automated in different ways, further info can be found at Getting Started with Insights.
Finally after registration, the Insights client will upload initial system metadata to Red Hat Insights. You should be able to immediately see your system in the Insights user interface.
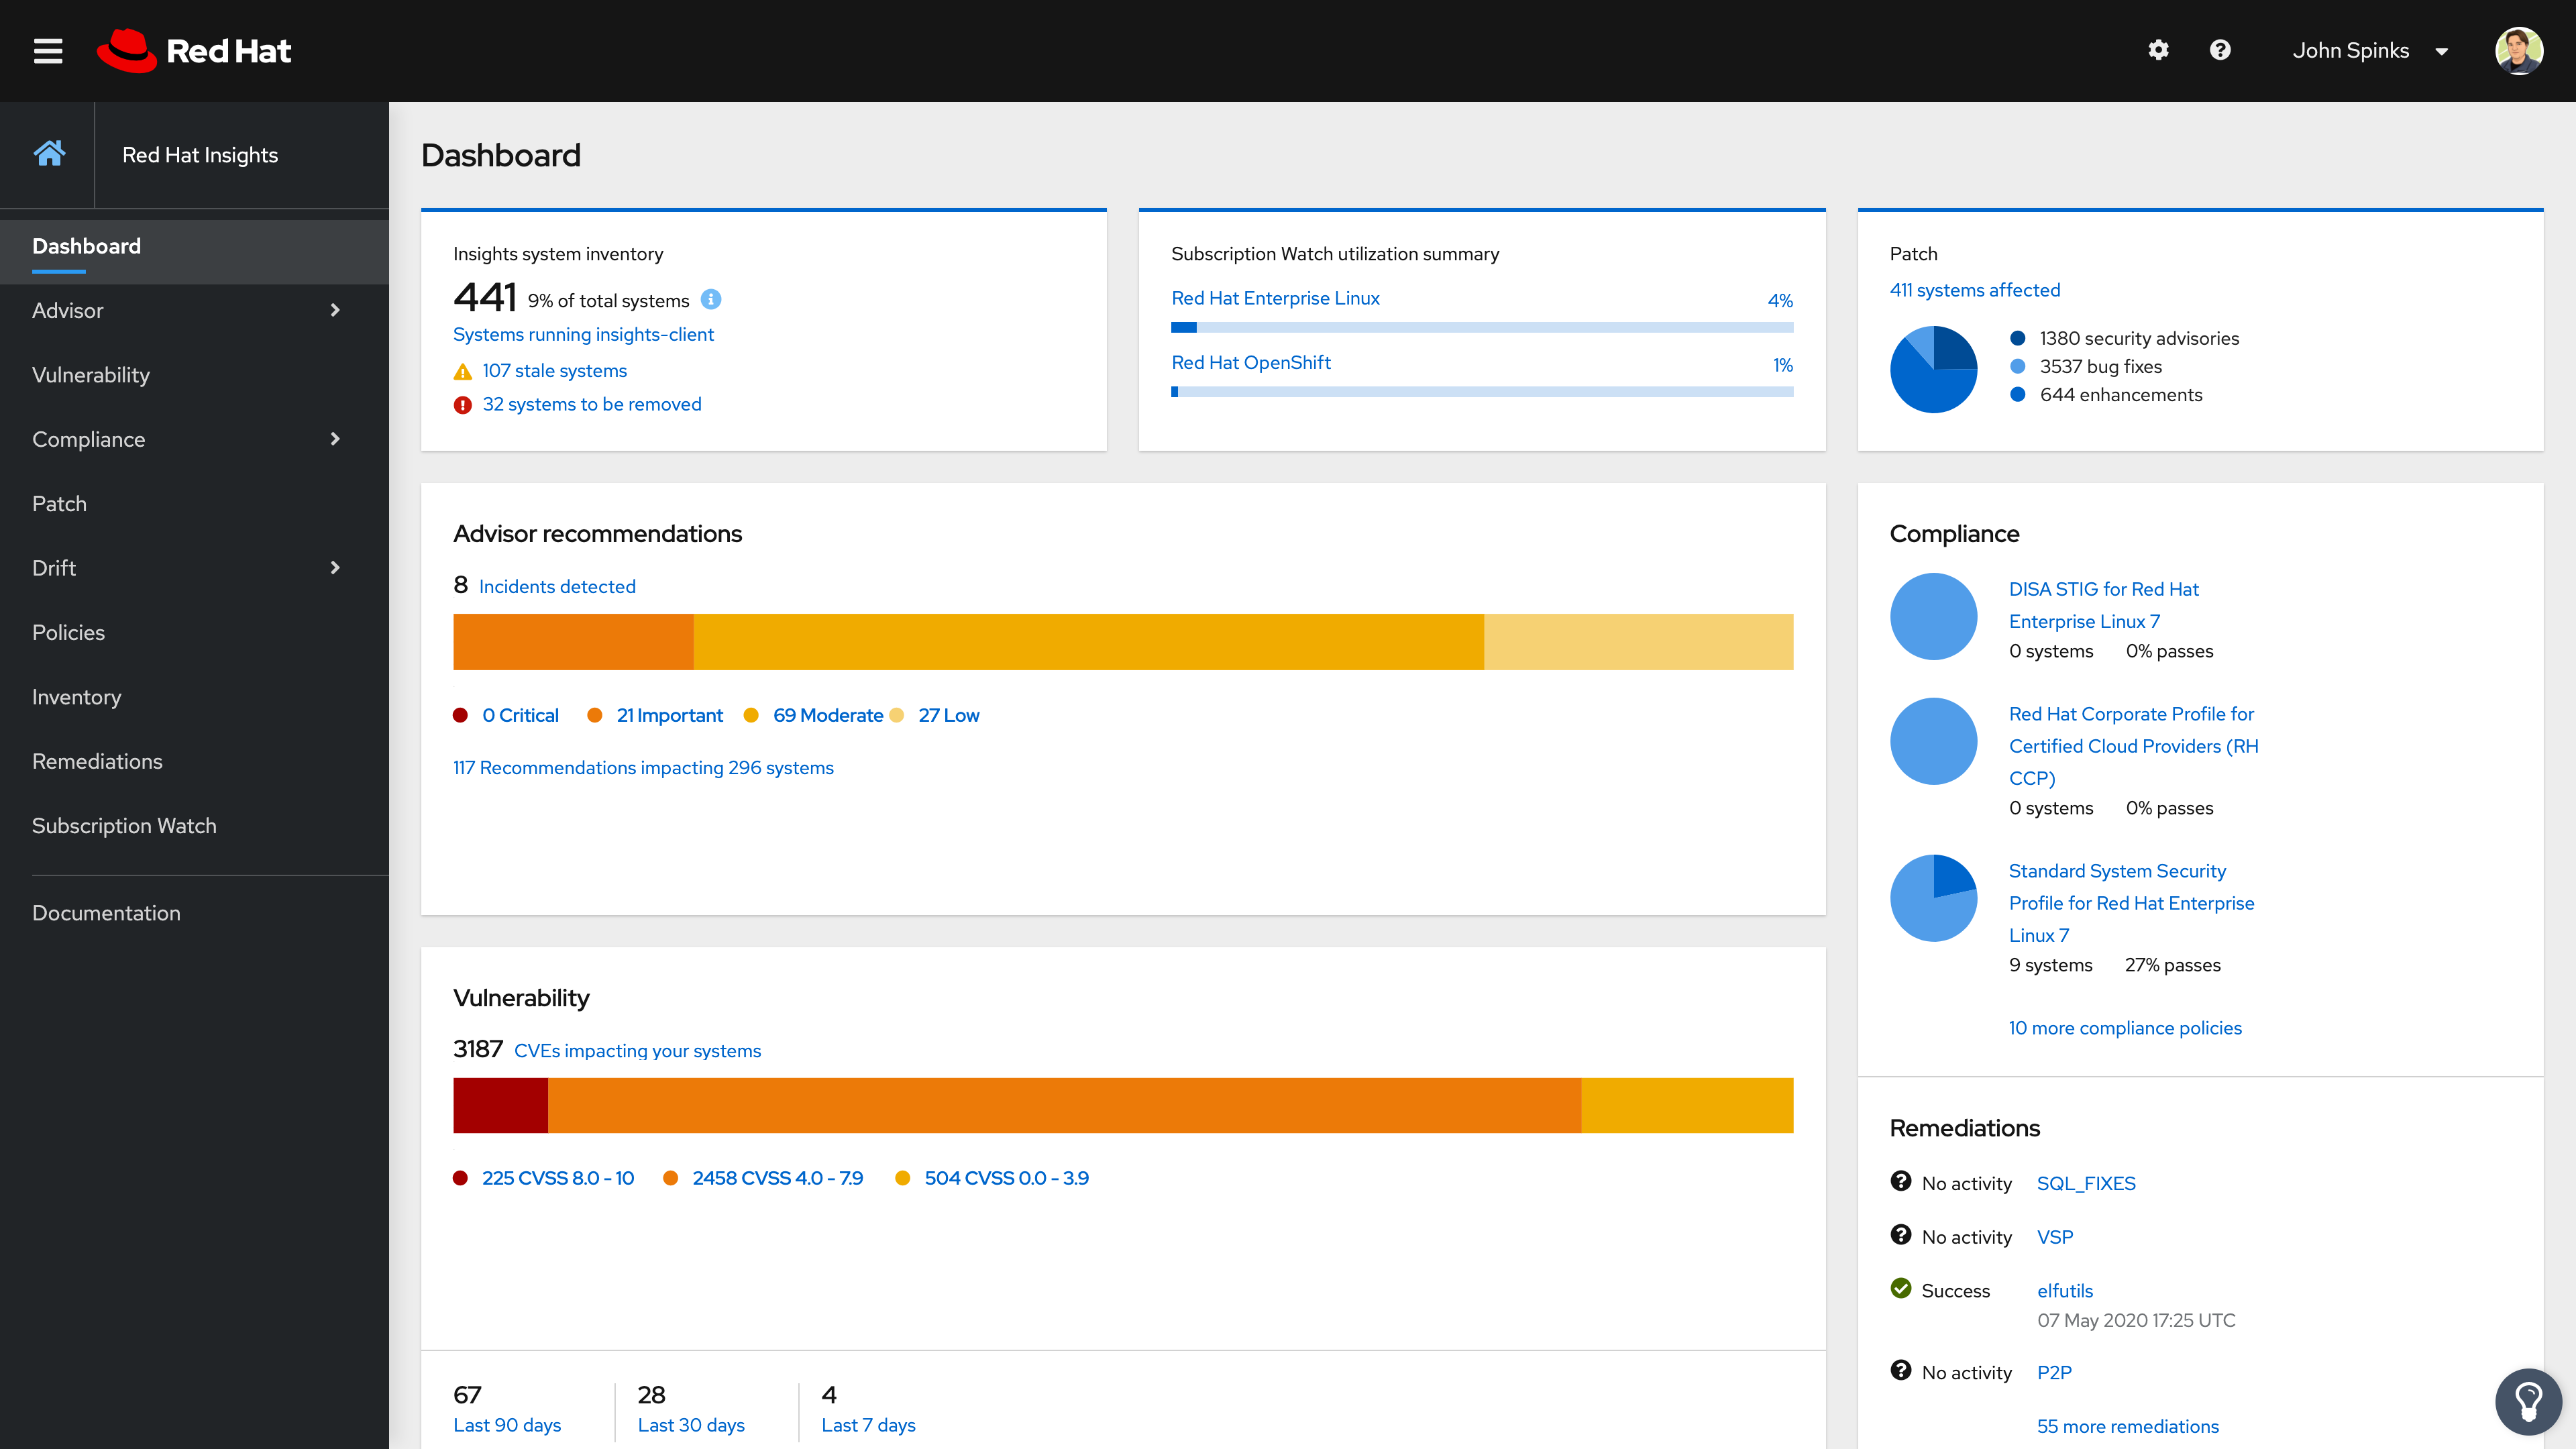
Insights from the UI
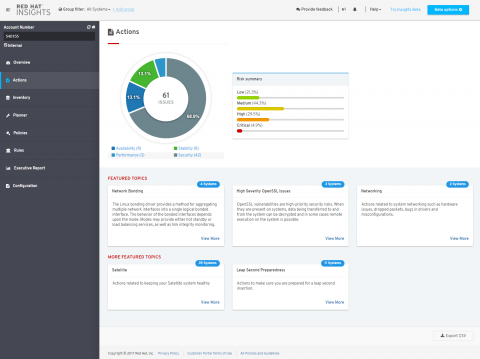
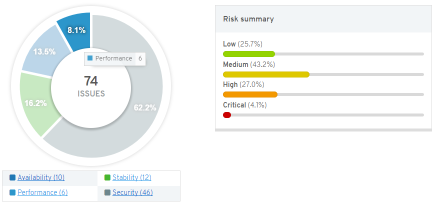
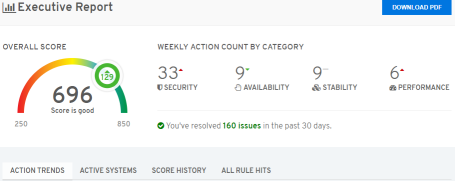
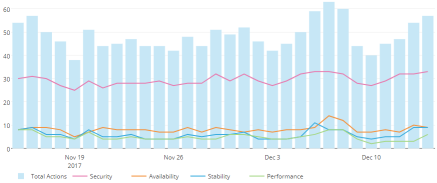
First stop is the Dashboard, which will give you a quick overview of your systems, latests news from Red Hat, actions summary and plan summary.
At a glance, Insights allows you to see your systems health, as well as some other intresting things like Latest news from Red Hat (under Latest box) or your Newest Systems (newly registered into Insights), Actions to be taken (in a summary form) or all of your Plans Summary, which gathers all the actions to be taken into groups of machines (previously defined by you).
In the left side of the screen you can see all the Insights features in the form of tabs.

Insights prioritizes security and displays graphical and easy to understand alerts, that gives you a clear idea of the impact a given risk has for your infrastructure.

- Hot items = Red Hat will occasionally update this to point you to new / interesting information or Vulnerabilities.
- High prio = Systems not checking in or critical suggestions from Red Hat about what to check out.
- Plan Summary = A glance into current Action Planner plans and their completion status.
- Actions Summary = numerical representation of topics and categories of problems in the infrastructure
It’s all very intuitive and easy to use, as you can see.

What can I monitor with Red Hat Insights?
Insights is delivered as Software-as-a-Service via Red Hat Customer Portal, and integrated with CloudForms (4.0+) and Satellite (5.7, 6.1+)
Supported Platforms:- Red Hat Enterprise Linux 6.4 and higher, RHEL 7 and higher
- Red Hat OpenStack 7 and higher
- Red Hat Virtualization 4 and higher
- Red Hat OpenShift Container Platform
- Red Hat Cloud Infrastructure 6 and higher, and Cloud Suite 6 and higher (included in RHCI/RHCS SKU’s)
One of the great features of Red Hat Insights is that there is no new infrastructure to manage, and also provides Ansible Tower integration which enables playbooks generated in Red Hat Insights to be automatically imported into Ansible Tower.
In the next blog post, I will give you some insights on insights, how data is collected, what data is collected, how you can control it... so stay tuned!
Wanna know more?? Find more info here
Posted: 2018-02-08T15:10:40+00:00 -
January 2018 service release: A new year, a new look... and webhooks!
Happy New Year! One way to get this new year started off right is to get started preventing some of the problems and downtime you may have experienced over the holidays. Using Insights can help future proof your infrastructure with integrated Ansible automation and a report on which systems you still need to patch for vulnerabilities like Meltdown and Spectre. Click here to see if you have systems that are missing the latest patches for these critical vulnerabilities.
Latest release
We're pleased to announce the latest service release of Red Hat Insights.
Read below for more information or check out the new features and let us know your thoughts by using the "Provide Feedback" button from within the Insights UI in the top right.For more information about the latest Insights release, refer to our Red Hat Insights Release Notes.
Newest features:
User Interface Layout
In an effort to ease workflow and visibility throughout the Insights application we are shifting to a full screen application mode. This both frees up valuable screen space to more efficiently bring you the latest information on critical threats to your infrastructure, and gives us some more room to continue to add features that you request. Remember, keep the feedback coming, there's a provide feedback button at the top of the user interface.
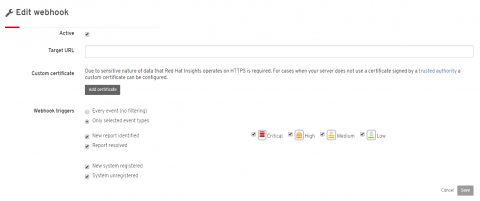
Webhooks for integration
Insights has now enabled our Webhook integration for custom alerts and notifications. Many of the Incident Management and response services that are used today allow for Webhook consumption which allows for Insights notifications in the tools and workflows you already use. For more information on getting Webhooks configured, please visit Understanding Red Hat Insights - Webhook Integration.
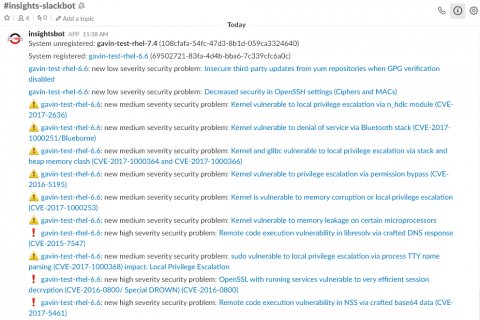
Our engineers, for internal demo purposes, integrated Insights Webhooks functionality with the Slack messaging service. This example allowed for our teams to be notified in chat immediately when new critical issues had been identified on our registered hosts with Insights. For those interested our example code for this integration is online at:
https://github.com/jharting/insights-slackbot/blob/tutorial/tutorial/Tutorial.md
Please note, this is example code and is not officially supported by Red Hat.
CI/CD workflow examples
We previously added support for Jenkins and CI/CD workflow integration and now we have published some quick start example code. This code is available at https://github.com/RedHatInsights/insights-CI-examples/tree/master/examples/jenkins and we will have additional related materials coming soon right here on our blog.
Please note, this is example code and is not officially supported by Red Hat.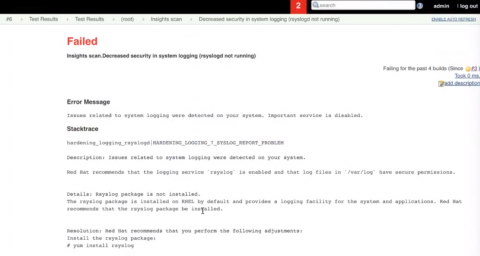
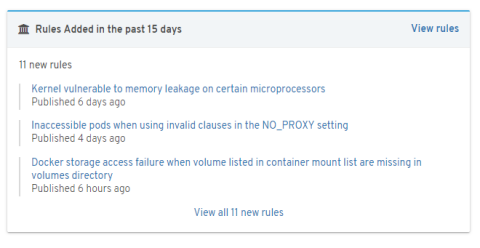
Newest rules widget
And to wrap up what's new in this service release, we've added a new widget to the UI with the latest rule additions to the Insights service. Since rules are constantly being added to Red Hat Insights on a regular basis you can now stay up to date with the latest additions on the Overview page. Additional filtering controls around when a rule was added have also been added to our rules page.
Thanks for your feedback and helping continue to improve the Insights service. Have a great new year!
Will
Posted: 2018-01-10T00:11:44+00:00 -
Avoid unplanned downtime this holiday season with automated risk remediation
It's that time of year again! Many of us in information technology don't have the luxury of letting our guard down during this crucial time for retail, finance, healthcare, and logistics. Being on call or glued to a monitor or app so that we can keep track of late breaking issues and quickly troubleshoot problems if the need arises is often a requirement in the infrastructure and operations world.
Downtime is unavoidable. It’s either planned or it's forced.
We can help you avoid unplanned downtime and save your organization time and effort with a quick introduction to Red Hat's proactive analytics service for security and infrastructure operations: Red Hat Insights.
When your systems are forced down or have known critical vulnerabilities how do you typically respond?
For those risk averse and security conscious, and to be honest -- who isn’t these days, being informed and having accurate intelligence to more quickly fix vulnerabilities and bugs so that we can safeguard valuable data and achieve greater infrastructure stability is only half the battle.
The other half is actually acting on that intelligence. Red Hat Insights can help you do both.
I'll also link you to the getting started guide so that you can begin using Insights right away with an evaluation, or you can contact your Red Hat account team for a larger scale proof of concept. It only takes a couple of minutes to get up and running on most deployments, and may take only a few seconds if you're already leveraging automation technologies like Ansible, or one of Red Hat's Management portfolio solutions like Ansible Tower, CloudForms, or Satellite.
What is Red Hat Insights?
Red Hat developed the Insights service for exactly the type of problems that keep us on edge during this time of year, to ease troubleshooting, find problems that crop up, and fix them faster!
Red Hat Insights takes advantage of both historical data and the latest knowledge from Red Hat and scales to your infrastructure. Insights is a constantly evolving and hyper-aware Software-as-a-Service (SaaS) platform that monitors and helps manage risk in both the traditional datacenter and hybrid cloud environments.
Insights is not an appliance and requires a very minimal setup with no added infrastructure cost. The goal with Insights has always been to help reduce complexity and risk in our customers’ infrastructures. We want to enable an easy to understand analysis of where problems exist and how to quickly resolve them with trusted, validated advice from Red Hat.
Get Started with Red Hat Management:
We do this in a few different ways. Insights is already integrated into each of the tools you may be using to manage your Red Hat Enterprise Linux infrastructure, and we continue to more tightly integrate with each management solution from Red Hat each release.
The latest releases of Red Hat Ansible Tower supports Insights host reporting directly from the inventory as well as project integration for Insights Ansible Playbook generation and automation jobs built with or imported from the Insights Planner.
Red Hat Satellite has had Insights support since Satellite 5.7 and Satellite 6.1, and continues to be a popular platform management solution for systems lifecycle provisioning and management, as well as risk reporting and remediation with Insights integration.
Red Hat CloudForms has had Insights reporting integration since CloudForms 4.0, and now with the latest 4.5 release has Ansible automation capabilities to further increase remediation efficiency across your managed infrastructures.
Red Hat's Customer Portal also makes it really easy to get started with Insights if you don't currently utilise any other software in the management portfolio.
Even if you're using the Ansible upstream unsupported offering you can take advantage of dynamically generated Ansible Playbooks from Insights to quickly remediate any problems that are identified. Insights can generate a playbook template that enables you to run immediately with ansible-playbook or AWX, or modify tasks therein for your own needs.

In addition, If you have a Technical Account Manager or Consulting engagement you can also engage those services to get more information about enabling Insights reporting for infrastructure health assessments.
How it works:
I'll drop a few screenshots here to give you an idea of how Red Hat Insights works and how easy it is to get started, but if you have a minute or two you should give it a try. Insights supports RHEL 6.4 and newer, so you will need a current RHEL subscription to take advantage of Insights.
You can also use Satellite 5.7 or newer for Insights reporting, but at the time of this post the newest Insights features are being developed for Red Hat Satellite 6 and newer, Red Hat CloudForms 4.5 and newer, and Ansible Tower 3.2 and newer.
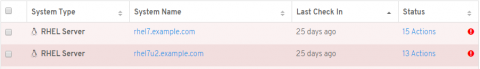
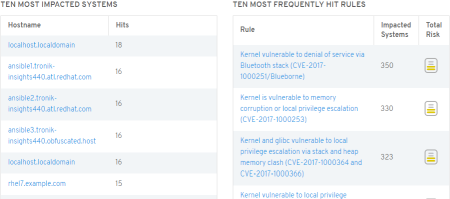
We're always adding new Rules based off of the newest or hottest critical issues which are impacting our customers' infrastructures that trigger Actions.
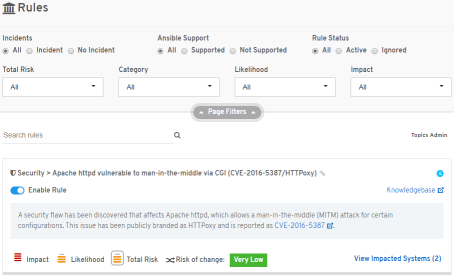
A Rule is how we describe what kind of risks we're looking for from the analytics engine.
When a rule is generated for reporting an action is displayed.
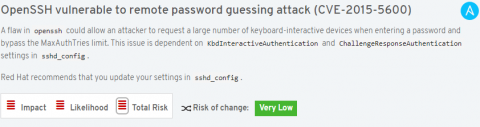
Actions typically offer a description of the associated risk, tailored to the system with the problem, and how to resolve.
From here, you perform the remediation. If you’re using automation, it will call the Insights client to run again and verify if the problem has been resolved.
Using these techniques you can remediate vast amounts of systems with automation, or more surgically if you need to perform some targeted manual or custom automated remediations.
So if you’d like to get started this holiday season and take advantage of Insights proactive remediation capabilities click here to get started. We think Insights will help you avoid potential downtime and increase your infrastructure health score with a minimal time investment during this busy holiday season.
And finally, as with everything we do here at Red Hat - We truly value your feedback. There's a "Provide Feedback" button at the top of Red Hat Insights in the Customer portal, which you get access to as an Insights subscriber, so please give us your feedback about what's working great or what could help make Insights more valuable for you. Barring that, you may also email us at insights at redhat dot com as well.
Thanks for reading, and stay secure and informed,
WillPosted: 2017-12-15T18:01:25+00:00